Global Chip on Board (COB) Light Emitting Diode Market (2011-2016)


Urbanization, increasing infrastructure, and government initiatives are the factors resulting in increase in modern lighting products. Incandescent lighting turns out to be a very costly and poor medium of lighting source. This stirs the push to LED lighting. COB LED technology has emerged due to its features such as low power consumption, cost-effective lighting, and high intensity output. COB LED market contributes around 7 to 8% to the overall market for LED and is expected to reach around 20% in the near future.
The market for COB LED is still at the growing stage and has high potential to grow in future. The government�s support towards banning incandescent lighting and urbanization will lead to increase in the demand for COB LED lights. At present, pricing is the main hurdle for COB LED technology but that will also be resolved; as companies will achieve technology expertise and economies of scale; thereby making it more competitive with respect to conventional lighting. COB LED will be mainly preferred for illumination due to its high density and better color mixing.
In global market, APAC is the market leader in COB LED technology; both in terms of manufacturing companies and usage. China, Japan, and Taiwan are the main contributors to the overall market in it. It is followed by the U.S.; where urbanization and government�s support are driving the lighting market. Europe is close to U.S. It is where lighting is taking a toll due to increase in the usage of ultra modern lighting for hospitality industry and architectural lighting. Rest of the world caters to Middle East and Africa; where Dubai is the largest contributor to infrastructure and lighting.
This report deals with all the driving factors, restraints, and opportunities with respect to the COB LED market that is helpful in identifying trends and key success factors for the industry. The report does distinguish between traditional lighting source and COB LED technology on the basis of various aspects. It also profiles the various companies in the field of COB lighting, with their competitive landscape and strategies. The report throws light on the winning strategies and burning issues pertaining to the COB LED industry.
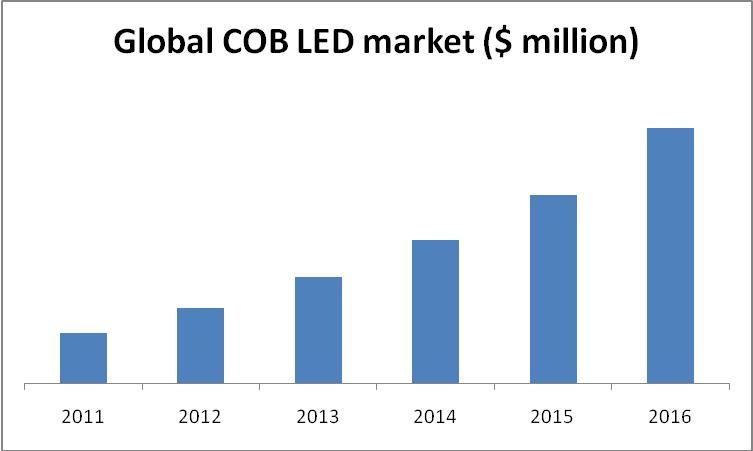
The global market is expected to reach $3.4 billion in 2016 at a CAGR of 38.5% from 2011 to 2016. Application market will be more inclined towards illumination in general lighting and is expected to reach to $2.9 billion in 2016 at a CAGR of 36.9% from 2011 to 2016.
Scope of the report
This research report categorizes the global COB LED market on the basis of applications and geography; it also covers the forecasting revenue and analyzing trends in the global COB LED market.
On the basis of application market
COB LED market is mainly segmented into four applications; namely: illumination, automotive, backlighting, and others. �Others� applications is further segmented into medical equipment and projectors. Here, illumination is further divided into various sub applications such as residential, commercial, architectural, hospitality, outdoor, and industrial. Automotive is further divided into interior automotive application and exterior automotive application; wherein exterior applications consist of headlamps, side lamps, rear lamps, and DRLs. Backlighting is further divided into LED television, handhelds, monitors, and screen display lighting.
These are the major applications on the basis of which market is divided and projected but it is expected that some more COB LED applications will be added in the COB LED portfolio in future.
On the basis of geography
North America, Europe, Asia-Pacific, and ROW are covered in the report.
Chip on Board (COB) LED market is driven by various factors such as high lumen and uniform output, and cost-effective and energy-efficient lighting. Governments of various regions are also backing this technology due to its features that outperform old incandescent and CFL lighting. In the current scenario, COB technology is a costly and complex process as compared to traditional lighting but it is expected that heavy investment in infrastructure from the companies and economy of scale will cut their cost in near future. Illumination in general lighting, backlighting, and automotives will be highly beneficiary areas.
The various companies currently involved in COB LED technology are Citizen Electronics (Japan), Everlight (Taiwan), Tridonic (Austria), Prophotonix (U.S.), PerkinElmer (U.S.), and many more.
Source: MarketsandMarkets Analysis
 Exclusive indicates content/data unique to MarketsandMarkets and not available with any competitors.
TABLE OF CONTENTS
1 INTRODUCTION
1.1 KEY TAKE-AWAYS
1.2 REPORT DESCRIPTION
1.3 MARKETS COVERED
1.4 STAKEHOLDERS
1.5 RESEARCH METHODOLOGY
1.5.1 MARKET SIZE
1.5.2 KEY DATA POINTS FROM SECONDARY SOURCES
1.5.3 KEY DATA POINTS FROM PRIMARY SOURCES
1.5.4 ASSUMPTIONS MADE FOR THIS REPORT
1.5.5 PRIMARY RESEARCH CONTRIBUTORS
2 SUMMARY
3 MARKET OVERVIEW
3.1 INTRODUCTION
3.2 MARKET DEFINITION
3.3 MARKET DYNAMICS
3.3.1 DRIVERS
3.3.1.1 Energy efficiency
3.3.1.2 Government support
3.3.1.3 Extremely flat & slim design
3.3.1.4 Longer life span
3.3.1.5 Better color mixing
3.3.2 RESTRAINTS
3.3.2.1 Higher price
3.3.2.2 Complex manufacturing process
3.3.3 OPPORTUNITIES
3.3.3.1 Advancements on design front
3.3.3.2 Market at nascent stage
3.3.3.3 Cost saving
3.4 BURNING ISSUE
3.4.1 LACK OF AWARENESS
3.5 WINNING IMPERATIVE
3.5.1 ECONOMY OF SCALE
3.6 COB LED APPLICATION ANALYSIS
3.7 TECHNOLOGY LIFE CYCLE OF COB LED
3.8 MARKET SHARE ANALYSIS
3.9 PATENT ANALYSIS
3.10 LED MARKET AT A GLANCE
3.10.1 DEFINITION OF LED
3.10.2 VARIOUS FORMS OF LED
3.10.2.1 By types
3.10.2.2 By product/usage
3.10.2.3 By application
3.10.2.4 By packaging/technology
3.10.2.5 By material
3.10.2.6 By power/intensity
3.10.2.7 By color
3.10.3 LED PACKAGING
3.10.3.1 Functions of LED packaging
3.10.3.2 Key components of packaged LED
3.10.3.3 Leading LED packaging companies
3.10.4 LED VALUE CHAIN ANALYSIS
3.10.5 RECENT INNOVATION OF LED TECHNOLOGY
3.11 EVOLUTION OF CHIP ON BOARD LED TECHNOLOGY
3.11.1 LED AS A CYLINDRICAL DEVICE
3.11.2 �T� OR DIP TYPE TECHNOLOGY
3.11.3 SURFACE MOUNT DEVICE
3.11.4 CHIP ON BOARD LED
4 COB LED TECHNOLOGY
4.1 INTRODUCTION
4.2 MANUFACTURING PROCESS OF COB LED
4.3 VALUE CHAIN ANALYSIS OF COB LED
4.4 STEPS IN IMPLEMENTING COB LED MODULE
4.4.1 CHIP SELECTION
4.4.2 PACKAGING
4.4.3 ENCAPSULATION
4.4.4 PCB DESIGN & THERMO MANAGEMENT
4.4.5 RELIABILITY TEST
4.4.6 RUN TEST
4.5 CHIP ON BOARD LED ARRAY
4.6 LED VS CHIP ON BOARD LED
5 COB LED APPLICATION MARKET
5.1 COB LED APPLICATIONS
5.2 ILLUMINATION
5.2.1 RESIDENTIAL
5.2.2 OFFICE SPACE
5.2.3 INDUSTRIAL
5.2.4 SHOP AREA
5.2.5 HOSPITALITY INDUSTRY
5.2.6 OUTDOOR LIGHTING
5.2.7 ARCHITECTURAL
5.3 AUTOMOTIVE
5.3.1 INTERIOR
5.3.2 EXTERIOR
5.3.2.1 Headlamp
5.3.2.2 Sidelight
5.3.2.3 DRLs
5.3.2.4 Rear light
5.4 BACKLIGHTING
5.4.1 LED TELEVISION
5.4.2 MONITOR
5.4.3 HANDHELDS
5.4.4 SCREEN DISPLAY LIGHTING
5.5 OTHERS
5.5.1 MEDICAL EQUIPMENT
5.5.2 PROJECTORS
5.6 HIGH BRIGHTNESS LIGHTING
6 GEOGRAPHICAL ANALYSIS
6.1 NORTH AMERICA
6.2 EUROPE
6.3 APAC
6.4 ROW
7 COMPETITIVE LANDSCAPE
7.1 KEY GROWTH STRATEGIES
8 COMPANY PROFILES
8.1 OSRAM
8.1.1 OVERVIEW
8.1.2 PRODUCTS & SERVICES
8.1.3 FINANCIALS
8.1.4 STRATEGY
8.1.5 DEVELOPMENTS
8.2 PERKINELMER
8.2.1 OVERVIEW
8.2.2 PRODUCTS & SERVICES
8.2.3 FINANCIALS
8.2.4 STRATEGY
8.2.5 DEVELOPMENTS
8.3 CITIZEN ELECTRONICS
8.3.1 OVERVIEW
8.3.2 PRODUCTS & SERVICES
8.3.3 FINANCIALS
8.3.4 DEVELOPMENTS
8.4 CREE INC
8.4.1 OVERVIEW
8.4.2 PRODUCTS & SERVICES
8.4.3 FINANCIALS
8.4.4 STRATEGY
8.4.5 DEVELOPMENTS
8.5 SEOUL SEMICONDUCTOR
8.5.1 OVERVIEW
8.5.2 PRODUCTS & SERVICES
8.5.3 FINANCIALS
8.5.4 STRATEGY
8.5.5 DEVELOPMENTS
8.6 EVERLIGHT ELECTRONICS
8.6.1 OVERVIEW
8.6.2 PRODUCTS & SERVICES
8.6.3 FINANCIALS
8.6.4 STRATEGY
8.6.5 DEVELOPMENTS
8.7 TRIDONIC
8.7.1 OVERVIEW
8.7.2 PRODUCTS & SERVICES
8.7.3 FINANCIALS
8.7.4 STRATEGY
8.7.5 DEVELOPMENTS
8.8 SHARP ELECTRONICS
8.8.1 OVERVIEW
8.8.2 PRODUCTS & SERVICES
8.8.3 FINANCIALS
8.8.4 STRATEGY
8.8.5 DEVELOPMENTS
8.9 GE LIGHTING
8.9.1 OVERVIEW
8.9.2 PRODUCTS & SERVICES
8.9.3 FINANCIALS
8.9.4 STRATEGY
8.9.5 DEVELOPMENTS
8.10 LEXTAR ELECTRONICS CORP
8.10.1 OVERVIEW
8.10.2 PRODUCTS & SERVICES
8.10.3 FINANCIALS
8.10.4 STRATEGY
8.10.5 DEVELOPMENTS
8.11 EMTEQ
8.11.1 OVERVIEW
8.11.2 PRODUCTS & SERVICES
8.11.3 FINANCIALS
8.11.4 STRATEGY
8.11.5 DEVELOPMENTS
8.12 ENLUX LIGHTING
8.12.1 OVERVIEW
8.12.2 PRODUCTS & SERVICES
8.12.3 FINANCIALS
8.12.4 STRATEGY
8.12.5 DEVELOPMENT
8.13 PROPHOTONIX
8.13.1 OVERVIEW
8.13.2 PRODUCT & SERVICES
8.13.3 FINANCIALS
8.13.4 STRATEGY
8.13.5 DEVELOPMENT
8.14 LUMINUS DEVICES
8.14.1 OVERVIEW
8.14.2 PRODUCTS & SERVICES
8.14.3 FINANCIALS
8.14.4 STRATEGY
8.14.5 DEVELOPMENTS
8.15 LUSTROUS TECHNOLOGY LTD
8.15.1 OVERVIEW
8.15.2 PRODUCTS & SERVICES
8.15.3 FINANCIALS
8.15.4 STRATEGY
8.15.5 DEVELOPMENT
8.16 BRIDGELUX INC
8.16.1 OVERVIEW
8.16.2 PRODUCTS & SERVICES
8.16.3 FINANCIALS
8.16.4 STRATEGY
8.16.5 DEVELOPMENTS
8.17 COOPER LIGHTING
8.17.1 OVERVIEW
8.17.2 PRODUCTS & SERVICES
8.17.3 FINANCIALS
8.17.4 STRATEGY
8.17.5 DEVELOPMENTS
8.18 LG INNOTEK
8.18.1 OVERVIEW
8.18.2 PRODUCTS & SERVICES
8.18.3 FINANCIALS
8.18.4 STRATEGY
8.18.5 DEVELOPMENTS
8.19 LUMISHORE LTD
8.19.1 OVERVIEW
8.19.2 PRODUCTS & SERVICES
8.19.3 FINANCIALS
8.19.4 STRATEGY
8.19.5 DEVELOPMENT
8.20 LEISO LIGHTING (DONGUAN) TECH. LTD
8.20.1 OVERVIEW
8.20.2 PRODUCTS & SERVICES
8.20.3 FINANCIALS
8.20.4 STRATEGY
8.20.5 DEVELOPMENT
8.21 NEO-NEON LED LIGHTING INTERNATIONAL LTD
8.21.1 OVERVIEW
8.21.2 PRODUTCS & SERVICES
8.21.3 FINANCIALS
8.21.4 STRATEGY
8.21.5 DEVELOPMENTS
8.22 3DZ LTD
8.22.1 OVERVIEW
8.22.2 PRODUCTS & SERVICES
8.22.3 FINANCIALS
8.23 LUMAGINE
8.23.1 OVERVIEW
8.23.2 PRODUCTS & SERVICES
8.23.3 FINANCIALS
APPENDIX
U.S. PATENTS
EUROPE PATENTS
JAPAN PATENTS
LIST OF TABLES
TABLE 1 COB LED MARKET REVENUE, BY GEOGRAPHY, 2010 � 2016 ($MILLION)
TABLE 2 TOP PLAYERS IN LED MARKET
TABLE 3 COB LED PATENTS, BY COMPANY, 2006 � 2011
TABLE 4 POPULAR LIGHTS OF LED
TABLE 5 LEADING LED PACKAGING COMPANIES
TABLE 6 REGION-WISE MARKET OF LED, 2010 ($MILLION)
TABLE 7 DIFFERENCE BETWEEN TRADITIONAL �T� TYPE OR CYLINDRICAL LED & COB LED
TABLE 8 GLOBAL COB LED MARKET REVENUE, BY APPLICATIONS, 2010 � 2016 ($MILLION)
TABLE 9 GLOBAL COB LED ILLUMINATION MARKET REVENUE, BY APPLICATIONS, 2010 � 2016 ($MILLION)
TABLE 10 COB LED RESIDENTIAL LIGHTING MARKET REVENUE, BY GEOGRAPHY, 2010 � 2016 ($MILLION)
TABLE 11 COB LED OFFICE AREA LIGHTING MARKET REVENUE, BY GEOGRAPHY, 2010 � 2016 ($MILLION)
TABLE 12 COB LED INDUSTRIAL LIGHTING MARKET REVENUE, BY GEOGRAPHY, 2010 � 2016 ($MILLION)
TABLE 13 COB LED SHOP AREA LIGHTING MARKET REVENUE, BY GEOGRAPHY, 2010 � 2016 ($MILLION)
TABLE 14 COB LED HOSPITALITY LIGHTING MARKET REVENUE, BY GEOGRAPHY, 2010 � 2016 ($MILLION)
TABLE 15 COB LED OUTDOOR LIGHTING MARKET REVENUE, BY GEOGRAPHY, 2010 � 2016 ($MILLION)
TABLE 16 COB LED ARCHITECTURAL LIGHTING MARKET REVENUE, BY GEOGRAPHY, 2010 � 2016 ($MILLION)
TABLE 17 GLOBAL COB LED AUTOMOTIVE MARKET REVENUE, BY APPLICATIONS, 2010 � 2016 ($MILLION)
TABLE 18 COB LED INTERIOR AUTOMOTIVE LIGHTING MARKET REVENUE, BY GEOGRAPHY, 2010 � 2016 ($MILLION)
TABLE 19 COB LED HEADLAMP MARKET REVENUE, BY GEOGRAPHY, 2010 � 2016 ($MILLION)
TABLE 20 COB LED SIDELIGHT MARKET REVENUE, BY GEOGRAPHY, 2010 - 2016 ($MILLION)
TABLE 21 COB LED DRL MARKET REVENUE, BY GEOGRAPHY, 2010 � 2016 ($MILLION)
TABLE 22 COB LED REAR LIGHT MARKET REVENUE, BY GEOGRAPHY, 2010 � 2016 ($MILLION)
TABLE 23 GLOBAL COB LED BACKLIGHTING MARKET REVENUE, BY APPLICATIONS, 2010 � 2016 ($MILLION)
TABLE 24 COB LED TELEVISION MARKET REVENUE, BY GEOGRAPHY, 2010 � 2016 ($MILLION)
TABLE 25 COB LED MONITOR MARKET REVENUE, BY GEOGRAPHY, 2010 � 2016 ($MILLION)
TABLE 26 COB LED HANDHELDS MARKET REVENUE, BY GEOGRAPHY, 2010 � 2016 ($MILLION)
TABLE 27 COB LED SCREEN DISPLAY MARKET REVENUE, BY GEOGRAPHY, 2010 � 2016 ($MILLION)
TABLE 28 GLOBAL COB LED OTHER MARKET REVENUE, BY APPLICATIONS, 2010 � 2016 ($MILLION)
TABLE 29 COB LED MEDICAL LIGHTING MARKET REVENUE, BY GEOGRAPHY, 2010 � 2016 ($MILLION)
TABLE 30 COB LED PROJECTORS LIGHTING MARKET REVENUE, BY GEOGRAPHY, 2010 � 2016 ($MILLION)
TABLE 31 NORTH AMERICA: COB LED MARKET REVENUE, BY APPLICATIONS, 2010 � 2016 ($MILLION)
TABLE 32 EUROPE: COB LED MARKET REVENUE, BY APPLICATIONS, 2010 � 2016 ($MILLION)
TABLE 33 APAC: COB LED MARKET REVENUE, BY APPLICATIONS, 2010 � 2016 ($MILLION)
TABLE 34 ROW: COB LED MARKET REVENUE, BY APPLICATIONS, 2010 � 2016 ($MILLION)
TABLE 35 MERGER & ACQUISITION, 2009
TABLE 36 COLLABORATIONS/PARTNERSHIPS/AGREEMENTS/JOINT VENTURES, 2008 - 2011
TABLE 37 NEW PRODUCTS DEVELOPMENT, 2008 - 2011
LIST OF FIGURES
FIGURE 1 OVERVIEW OF COB LED APPLICATIONS
FIGURE 2 IMPACT ANALYSIS OF DRIVERS
FIGURE 3 COMPARISON OF COLOR MIXING BETWEEN TRADITIONAL LED & COB LED
FIGURE 4 IMPACT ANALYSIS OF RESTRAINTS
FIGURE 5 COB LED APPLICATIONS MAPPING
FIGURE 6 PACKAGING/TECHNOLOGY LIFE CYCLE
FIGURE 7 COB LED PATENTS, BY GEOGRAPHY, 2006 � 2011
FIGURE 8 COB LED PATENTS, BY GEOGRAPHY, 2006 � 2011
FIGURE 9 LED PATENT ANALYSIS, BY GEOGRAPHY, 2006 � 2011
FIGURE 10 COMPARISON OF PATENT FILING, BY TECHNOLOGY, 2000 � 2010
FIGURE 11 GLOBAL PATENT ANALYSIS, BY TECHNOLOGY, 2006 � 2011
FIGURE 12 LED LIGHTING PENETRATION, 2010 � 2014
FIGURE 13 CHANGES IN LED APPLICATION
FIGURE 14 CLASSIFICATION OF LED
FIGURE 15 INTERNAL DIAGRAM OF COB LED
FIGURE 16 LED PACKAGING PROCESS
FIGURE 17 LED PACKAGING EQUIPMENT MARKET, 2010 � 2016 ($MILLION)
FIGURE 18 SIMPLIFIED LED LIGHTING PRODUCTS VALUE CHAIN
FIGURE 19 EVOLUTION OF COB LED
FIGURE 20 INTERNAL DIAGRAM OF CYLINDRICAL LED
FIGURE 21 �T� TYPE LED
FIGURE 22 SMD LED TECHNOLOGY
FIGURE 23 TRANSFORMATION OF TRADITIONAL LIGHTING TO COB LED LIGHTING
FIGURE 24 TYPES OF COB LED PRODUCTS
FIGURE 25 COMPARISON BETWEEN STANDARD LED & COB LED
FIGURE 26 TECHNOLOGICAL TRENDS IN COB LED
FIGURE 27 MANUFACTURING PROCESS OF COB LED
FIGURE 28 VALUE CHAIN ANALYSIS OF COB LED
FIGURE 29 FORMS OF COB LED ARRAYS
FIGURE 30 COMPARISON OF MANUFACTURING PROCESS OF SMD & COB ASSEMBLY
FIGURE 31 CLASSIFICATION OF COB LED APPLICATION MARKET
FIGURE 32 COB LED APPLICATIONS, BY VOLTAGE & CURRENT RATING
FIGURE 33 GROWTH REVENUE MATRIX OF COB LED, BY APPLICATIONS
FIGURE 34 DISTRIBUTION OF HB LED MARKET, BY APPLICATIONS, 2010
FIGURE 35 NORTH AMERICA: COB LED MARKET REVENUE, BY APPLICATIONS, 2010 � 2016 ($MILLION)
FIGURE 36 EUROPE: COB LED MARKET REVENUE, BY APPLICATIONS, 2010 � 2016 ($MILLION)
FIGURE 37 APAC: COB LED MARKET REVENUE, BY APPLICATIONS, 2010 � 2016 ($MILLION)
FIGURE 38 ROW: COB LED MARKET, BY APPLICATIONS, 2010 � 2016 ($MILLION)
FIGURE 39 KEY GROWTH STRATEGIES, 2008 � 2011


Growth opportunities and latent adjacency in Global Chip on Board (COB) Light Emitting Diode Market