Coalescing Agent Market by Type (Hydrophilic, Hydrophobic), Application (Paints & Coatings, Adhesive & Sealants, Inks, Personal Care Ingredient), and Region (Apac, North America, Europe, Middle East & Africa, South America) - Global Forecast to 2023


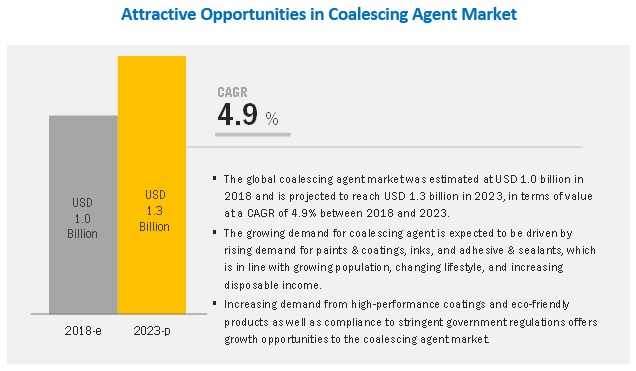
[119 Pages Report] The coalescing agent market size is projected to grow from USD 1.0 billion in 2018 to USD 1.3 billion by 2023, at a CAGR of 4.9%. Coalescing agents are typically solvents which help optimize the film formation process of polymer emulsion. Coalescing agents are used as an additive to reduce the minimum film formation temperature, resulting in optimized film coherence and improve film properties such as scrub resistance, abrasion resistance, mechanical properties, and appearance.
The hydrophilic segment is expected to witness higher growth during the forecast period.
The coalescing agents market has been classified based on type as hydrophilic and hydrophobic. The hydrophilic segment of the market is projected to witness the higher CAGR during the forecast period. Hydrophilic coalescing agents are categorized into water soluble and low water soluble. Low water-soluble hydrophilic is one of the most commonly used coalescing agent owing to their high efficiency, low water solubility, and reduced risk of penetrating in the porous substrate. Furthermore, increasing demand for environment-friendly coalescing agent also supports the growth of the hydrophilic segment.
The paints & coatings segment accounts for the largest market share of the overall market.
Based on application, the coalescing agents market has been segmented into paints & coatings, inks, adhesive & sealants, personal care ingredient, and others. The paints & coatings application segment is projected to lead the overall coalescing agents market during the forecast period. The large market size in this segment is mainly attributed to the high demand in various end-use industry such as construction, automotive, furniture & wood working, and others. Increasing demand for high-performance coatings for application such as coil, marine, automotive, OEM refinish drives the demand for coalescing agent in this segment.
APAC is expected to account for the largest market share during the forecast period.
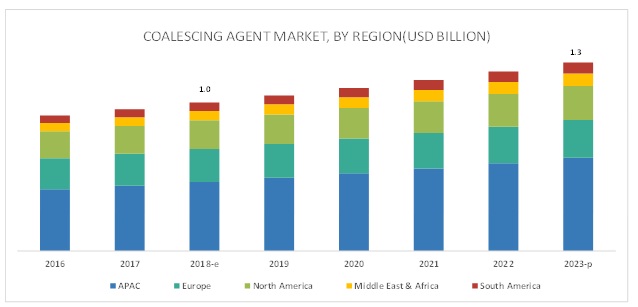
The APAC region is the largest consumer of coalescing agents across the globe. The APAC coalescing agents market is also projected to witness the highest CAGR between 2018 and 2023. Strong economic growth and increasing manufacturing output are majorly driving the demand for coalescing agents in the region.
Some of the key players operating in the coalescing agents market are Elementis Plc (UK), Eastman Chemical Company (US), Synthomer Plc (UK), DowDuPont (US), BASF SE (Germany), Croda International Plc (UK), Evonik Industries AG (Germany), Arkema Group (France), and Celanese Corporation (US). Competition among these players is high and, they mostly compete with each other on prices and quality of their products and product customization.
Please visit 360Quadrants to see the vendor listing of Top 20 Personal Care Ingredients Companies, Worldwide 2023
Scope of the Report
|
Report Metric |
Details |
|
Years considered for the study |
2016-2023 |
|
Base year considered |
2017 |
|
Forecast period |
2018-2023 |
|
Units considered |
Value (USD Million) and Volume (Ton) |
|
Segments covered |
Type, Application, and Region |
|
Geographies covered |
APAC, Europe, North America, Middle East & Africa, and South America |
|
Companies covered |
Eastman Chemical Company (US), DowDuPont (US), BASF SE (Germany), Evonik Industries AG (Germany), and Synthomer Plc (UK), among others. Total 25 key players of coalescing agents market are covered. |
This research report categorizes the coalescing agents market based on type, application, and region.
Coalescing agents Market, by Type:
- Hydrophilic
- Hydrophobic
Coalescing agents Market, by Application:
- Paints & Coatings
- Inks
- Adhesive & Sealants
- Personal Care Ingredient
- Others
Coalescing Agents Market, by Region:
- APAC
- Europe
- North America
- Middle East & Africa
- South America
Recent Developments
- In June 2018, The Dow Chemical Company (US) announced a series of phased expansion of its global glycol capacity through a series of seven debottlenecking and incremental expansion projects. The company will increase the production capacity of select p-series and performance glycol ethers, including the DOWANOL Glycol Ethers product line.
- In November 2017, Evonik Industries AG (Germany) signed an agreement to acquire the high-concentrates additive compounding business of 3M (US). This expanded the company’s specialty additives for plastic industry, including solid additives.
- In March 2017, Synthomer Plc (UK) acquired Perstorp Oxo Belgium AB (Belgium), a niche performance additives business serving the industrial and decorative coatings industries. The company will focus on expanding Perstorp Belgium’s market position by leveraging its existing sales, technical services infrastructure, and operational performance.
Key questions addressed by the report
- Which are the revenue pockets in coalescing agents market?
- What are the prime strategies of leaders in the coalescing agents market?
- What is the future product mix of coalescing agents market?
To speak to our analyst for a discussion on the above findings, click Speak to Analyst
 Exclusive indicates content/data unique to MarketsandMarkets and not available with any competitors.
Table of Contents
1 Introduction (Page No. - 15)
1.1 Objectives of the Study
1.2 Market Definition
1.3 Scope of the Study
1.3.1 Years Considered for the Study
1.4 Currency
1.5 Units Considered
1.6 Limitations
1.7 Stakeholders
2 Research Methodology (Page No. - 18)
2.1 Research Data
2.1.1 Secondary Data
2.1.1.1 Key Data From Secondary Sources
2.1.2 Primary Data
2.1.2.1 Key Data From Primary Sources
2.1.2.2 Key Industry Insights
2.2 Market Size Estimation
2.2.1 Bottom-Up Approach
2.2.2 Top-Down Approach
2.3 Data Triangulation
2.3.1 Assumptions
3 Executive Summary (Page No. - 25)
4 Premium Insights (Page No. - 29)
4.1 Attractive Opportunities in the Coalescing Agent Market
4.2 Coalescing Agent Market, By Region
4.3 Coalescing Agent Market, By Application
4.4 Coalescing Agent Market, By Country
4.5 Coalescing Agent Market, By Type
5 Market Overview (Page No. - 32)
5.1 Introduction
5.2 Market Dynamics
5.2.1 Drivers
5.2.1.1 Increasing Demand From Growing End-Use Industries
5.2.1.2 Rapid Urbanization in Emerging Economies
5.2.2 Restraints
5.2.2.1 High Production Cost of Coalescing Agent
5.2.3 Opportunities
5.2.3.1 Rising Demand for Environment-Friendly Coalescing Agents
5.2.4 Challenges
5.2.4.1 Compliance With Stringent Regulations and Standards
6 Industry Trends (Page No. - 35)
6.1 Porter’s Five Forces Analysis
6.1.1 Threat of New Entrants
6.1.2 Threat of Substitutes
6.1.3 Bargaining Power of Suppliers
6.1.4 Bargaining Power of Buyers
6.1.5 Intensity of Competitive Rivalry
6.2 Macroeconomic Overview and Key Trends
6.2.1 Trends and Forecast of GDP
7 Coalescing Agent Market, By Type (Page No. - 38)
7.1 Introduction
7.2 Hydrophilic Coalescing Agent
7.3 Hydrophobic Coalescing Agent
8 Coalescing Agent Market, By Application (Page No. - 42)
8.1 Introduction
8.2 Paints & Coatings
8.3 Adhesive & Sealants
8.4 Inks
8.5 Personal Care Ingredient
8.6 Others
9 Coalescing Agent Market, By Region (Page No. - 49)
9.1 Introduction
9.2 APAC
9.2.1 China
9.2.1.1 Rising Demand for High-Performance Coatings Coupled With Strong Economic Growth to Drive the Demand for Coalescing Agents
9.2.2 Japan
9.2.2.1 Rising Demand for Environment-Friendly Products to Drive the Market
9.2.3 India
9.2.3.1 Rapid Urbanization and Increasing Construction and Automotive Production to Drive the Demand for Coalescing Agents
9.2.4 South Korea
9.2.4.1 Growing Paints & Coatings Industry to Drive the Demand for Coalescing Agents
9.2.5 Indonesia
9.2.5.1 Growing Industrial and Construction Activity to Drive the Demand for Coalescing Agent
9.2.6 Rest of APAC
9.3 Europe
9.3.1 Germany
9.3.1.1 Strong Economic Growth and Continuous Expansion of End-Use Industries Drive the Coalescing Agent Market
9.3.2 France
9.3.2.1 Recovery of Economy and Stringent Regulations on Emission of Voc Supports the Demand for Coalescing Agent
9.3.3 UK
9.3.3.1 Growing Demand From End-Use Industries Such as Construction and Automotive Drives the Coalescing Agent Market
9.3.4 Italy
9.3.4.1 Slow Growth in Country’s Economy Due to Weakening Demand and Inflation May Impact the Market
9.3.5 Spain
9.3.5.1 Strong Economic Growth in Line With Growing End-Use Industries to Drive the Coalescing Agent Market in the Country
9.3.6 Russia
9.3.6.1 Improving Private & Public Investment and Construction Activities Will Increase the Demand for Coalescing Agent
9.3.7 Turkey
9.3.7.1 Improving Private & Public Investment and Construction Activities Will Increase the Demand for Coalescing Agent
9.3.8 Rest of Europe
9.4 North America
9.4.1 US
9.4.1.1 Strong Economic Growth and Rising Demand for Eco-Friendly Coalescing Agents
9.4.2 Canada
9.4.2.1 Rising Demand From Automotive & Construction Industries
9.4.3 Mexico
9.4.3.1 Increasing Investments in End-Use Industries and Strong Economic Growth
9.5 Middle East & Africa
9.5.1 Saudi Arabia
9.5.1.1 Efforts to Diversify Oil-Based Economy and Strong Economic Growth Will Increase the Demand
9.5.2 South Africa
9.5.2.1 Rebound in South African Economy Will Drive Demand for Coalescing Agent
9.5.3 Rest of Middle East & Africa
9.6 South America
9.6.1 Brazil
9.6.1.1 Rebound in Economic Growth Likely to Boost Demand for Coalescing Agent in Paints & Coatings
9.6.2 Argentina
9.6.2.1 Financial Aid From Imf to Revive Economic Growth and Drive Demand in Automotive & Construction Industries
9.6.3 Rest of South America
10 Competitive Landscape (Page No. - 83)
10.1 Introduction
10.2 Competitive Situation and Trends
10.2.1 Expansions
10.2.2 Acquisitions
11 Company Profiles (Page No. - 87)
(Business Overview, Products Offered, Recent Developments, SWOT Analysis, MnM View)*
11.1 Eastman Chemical Company
11.2 DowDuPont
11.3 BASF SE
11.4 Evonik Industries AG
11.5 Elementis Plc
11.6 Synthomer Plc
11.7 Celanese Corporation
11.8 Croda International Plc
11.9 Cargill, Incorporated
11.10 Arkema Group
11.11 Additional Company Profiles
11.11.1 Stepan Company
11.11.2 Oxea GmbH
11.11.3 Runtai Chemical Co., Ltd.
11.11.4 Addapt Chemicals B.V.
11.11.5 Patcham FZC
11.11.6 Chemoxy International Ltd.
11.11.7 XF Technologies Inc.
11.11.8 Hallstar
11.11.9 Krishna Antioxidants Pvt. Ltd.
11.11.10 Ascend Performance Materials
11.11.11 King Industries, Inc.
11.11.12 Cytec (Solvay)
11.11.13 Sino-Japan Chemical Co., Ltd.
11.11.14 Rudolf GmbH
11.11.15 Oxiteno
*Details on Business Overview, Products Offered, Recent Developments, SWOT Analysis, MnM View Might Not Be Captured in Case of Unlisted Companies.
12 Appendix (Page No. - 113)
12.1 Insights From Industry Experts
12.2 Discussion Guide
12.3 Knowledge Store: Marketsandmarkets’ Subscription Portal
12.4 Available Customizations
12.5 Related Reports
12.6 Author Details
List of Tables (70 Tables)
Table 1 Trends and Forecast of Per Capita GDP (USD)
Table 2 Coalescing Agent Market Size, By Type, 2016–2023 (Ton)
Table 3 By Market Size, By Type, 2016–2023 (USD Million)
Table 4 Hydrophilic Coalescing Agent Market Size, By Region, 2016–2023 (Ton)
Table 5 Hydrophilic Coalescing Agents Market Size, By Region, 2016–2023 (USD Million)
Table 6 Hydrophobic Coalescing Agent Market Size, By Region, 2016–2023 (Ton)
Table 7 Hydrophobic Coalescing Agents Market Size, By Region, 2016–2023 (USD Million)
Table 8 Coalescing Agent Market Size, By Application, 2016–2023 (Ton)
Table 9 By Market Size, By Application, 2016–2023 (USD Million)
Table 10 Coalescing Agent Market Size in Paints & Coatings, By Region, 2016–2023 (Ton)
Table 11 By Market Size in Adhesive & Sealants, By Region, 2016–2023 (Ton)
Table 12 Coalescing Agent Market Size in Inks, By Region, 2016–2023 (Ton)
Table 13 By Market Size in Personal Care Ingredient, By Region, 2016–2023 (Ton)
Table 14 Coalescing Agent Market Size in Other Applications, By Region, 2016–2023 (Ton)
Table 15 By Market Size, By Region, 2016–2023 (Ton)
Table 16 Coalescing Agent Market Size, By Region, 2016–2023 (USD Million)
Table 17 By Market Size, By Type, 2016–2023 (Ton)
Table 18 Coalescing Agent Market Size, By Type, 2016–2023 (USD Million)
Table 19 By Market Size, By Application, 2016–2023 (Ton)
Table 20 Coalescing Agents Market Size, By Application, 2016–2023 (USD Million)
Table 21 APAC: Coalescing Agent Market Size, By Country, 2016–2023 (Ton)
Table 22 APAC: By Market Size, By Country, 2016–2023 (USD Million)
Table 23 APAC: By Market, By Type, 2016–2023 (Ton)
Table 24 APAC: By Market, By Type, 2016–2023 (USD Million)
Table 25 APAC: By Market, By Application, 2016–2023 (Ton)
Table 26 China: Coalescing Agent Market, By Application, 2016–2023 (Ton)
Table 27 Japan: By Market, By Application, 2016–2023 (Ton)
Table 28 India: Coalescing Agent Market, By Application, 2016–2023 (Ton)
Table 29 South Korea: By Market, By Application, 2016–2023 (Ton)
Table 30 Indonesia: Coalescing Agent Market, By Application, 2016–2023 (Ton)
Table 31 Rest of APAC: By Market, By Application, 2016–2023 (Ton)
Table 32 Europe: Coalescing Agent Market Size, By Country, 2016–2023 (Ton)
Table 33 Europe: By Market Size, By Country, 2016–2023 (USD Million)
Table 34 Europe: By Market Size, By Type 2016–2023 (Ton)
Table 35 Europe: By Market Size, By Type 2016–2023 (USD Million)
Table 36 Europe: By Market Size, By Application, 2016–2023 (Ton)
Table 37 Germany: By Market Size, By Application, 2016–2023 (Ton)
Table 38 France: Coalescing Agent Market Size, By Application, 2016–2023 (Ton)
Table 39 UK: By Market Size, By Application, 2016–2023 (Ton)
Table 40 Italy: Coalescing Agent Market Size, By Application, 2016–2023 (Ton)
Table 41 Spain: By Market Size, By Application, 2016–2023 (Ton)
Table 42 Russia: Coalescing Agent Market Size, By Application, 2016–2023 (Ton)
Table 43 Turkey: By Market Size, By Application, 2016–2023 (Ton)
Table 44 Rest of Europe: Coalescing Agents Market Size, By Application, 2016–2023 (Ton)
Table 45 North America: Coalescing Agent Market Size, By Country, 2016–2023 (Ton)
Table 46 North America: By Market Size, By Country, 2016–2023 (USD Million)
Table 47 North America: By Market, By Type, 2016–2023 (Ton)
Table 48 North America: By Market, By Type, 2016–2023 (USD Million)
Table 49 North America: By Market, By Application, 2016–2023 (Ton)
Table 50 US: By Market, By Application, 2016–2023 (Ton)
Table 51 Canada: Coalescing Agent Market, By Application, 2016–2023 (Ton)
Table 52 Mexico: By Market, By Application, 2016–2023 (Ton)
Table 53 Middle East & Africa: Coalescing Agent Market Size, By Country, 2016–2023 (Ton)
Table 54 Middle East & Africa: By Market Size, By Country, 2016–2023 (USD Million)
Table 55 Middle East & Africa: By Market Size, By Type, 2016–2023 (Ton)
Table 56 Middle East & Africa: By Market Size, By Type, 2016–2023 (USD Million)
Table 57 Middle East & Africa: By Market, By Application, 2016–2023 (Ton)
Table 58 Saudi Arabia: By Market, By Application, 2016–2023 (Ton)
Table 59 South Africa: Coalescing Agents Market, By Application, 2016–2023 (Ton)
Table 60 Rest of Middle East & Africa: By Market, By Application, 2016–2023 (Ton)
Table 61 South America: Coalescing Agent Market, By Country, 2016–2023 (Ton)
Table 62 South America: By Market, By Country, 2016–2023 (USD Million)
Table 63 South America: By Market, By Type, 2016–2023 (Ton)
Table 64 South America: By Market, By Type, 2016–2023 (USD Million)
Table 65 South America: By Market, By Application, 2016–2023 (Ton)
Table 66 Brazil: Coalescing Agents Market, By Application, 2016–2023 (Ton)
Table 67 Argentina: By Market, By Application, 2016–2023 (Ton)
Table 68 Rest of South America: Coalescing Agent Market, By Application, 2016–2023 (Ton)
Table 69 Expansions, 2016–2018
Table 70 Acquisitions, 2016–2018
List of Figures (42 Figures)
Figure 1 Market Segmentation
Figure 2 Coalescing Agent Market: Research Design
Figure 3 Breakdown of Primary Interviews
Figure 4 Market Size Estimation: Bottom-Up Approach
Figure 5 Market Size Estimation: Top-Down Approach
Figure 6 Coalescing Agent Market: Data Triangulation
Figure 7 Hydrophilic Segment to Lead the Overall Coalescing Agent Market
Figure 8 Paints & Coatings to Be the Largest Application
Figure 9 APAC Was the Largest Coalescing Agent Market in 2017
Figure 10 India to Be Fastest-Growing Coalescing Agent Market During Forecast Period
Figure 11 Growing Paints & Coatings Segment to Drive the Coalescing Agent Market
Figure 12 APAC to Be Fastest-Growing Coalescing Agent Market During Forecast Period
Figure 13 Paints & Coatings is the Largest Application of Coalescing Agent Market
Figure 14 India to Register the Highest Cagr Between 2018 and 2023
Figure 15 Hydrophilic Dominated Overall Coalescing Agent Market
Figure 16 Coalescing Agent Market Dynamics
Figure 17 Porter’s Five Forces Analysis
Figure 18 Hydrophilic to Dominate Overall Coalescing Agent Market Between 2018 and 2023
Figure 19 Paints & Coatings to Be the Largest Application of Coalescing Agent Between 2018 and 2023
Figure 20 APAC to Register the Highest Cagr in the Coalescing Agent Market
Figure 21 APAC Market Snapshot: India Estimated to Be Fastest-Growing Market, 2018–2022
Figure 22 Europe Market Snapshot: Turkey Estimated to Be Fastest-Growing Market, 2018–2022
Figure 23 North America: Us to Be Fastest-Growing Market for Coalescing Agent Between 2018 and 2023
Figure 24 Middle East & Africa: Saudi Arabia to Be Fastest-Growing Market for Coalescing Agent
Figure 25 South America: Brazil to Be Fastest-Growing Market for Coalescing Agent
Figure 26 Market Ranking Analysis
Figure 27 Companies Primarily Adopted Inorganic Growth Strategies (2016–2018)
Figure 28 Eastman Chemical Company: Company Snapshot
Figure 29 Eastman Chemical Company: SWOT Analysis
Figure 30 DowDuPont: Company Snapshot
Figure 31 DowDuPont: SWOT Analysis
Figure 32 BASF SE: Company Snapshot
Figure 33 BASF SE: SWOT Analysis
Figure 34 Evonik Industries AG: Company Snapshot
Figure 35 Elementis Plc: Company Snapshot
Figure 36 Elementis Plc: SWOT Analysis
Figure 37 Synthomer Plc: Company Snapshot
Figure 38 Synthomer Plc: SWOT Analysis
Figure 39 Celanese Corporation: Company Snapshot
Figure 40 Croda International Plc: Company Snapshot
Figure 41 Cargill, Incorporated: Company Snapshot
Figure 42 Arkema Group: Company Snapshot
The study involved four major activities to estimate the current market size for coalescing agents. Exhaustive secondary research was done to collect information on the market, peer market, and parent market. The next step was to validate these findings, assumptions, and sizing with industry experts across the value chain through primary research. Both top-down and bottom-up approaches were employed to estimate the complete market size. Thereafter, market breakdown and data triangulation were used to estimate the market size of the segments and the sub-segments.
Secondary Research
In the secondary research process, various secondary sources such as Hoovers, Bloomberg BusinessWeek, and Dun & Bradstreet have been referred to identify and collect information for this study. These secondary sources included annual reports, press releases & investor presentations of companies; white papers; certified publications; articles by recognized authors; gold standard & silver standard websites; food safety organizations; regulatory bodies; trade directories; and databases.
Primary Research
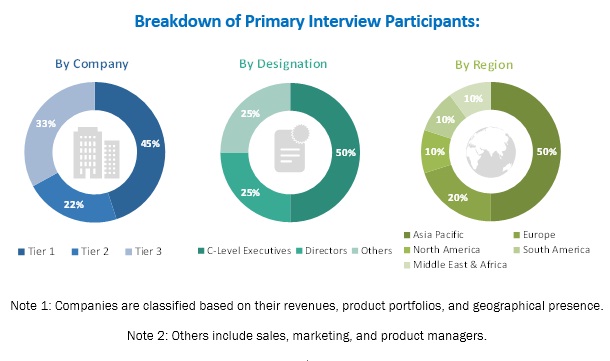
The primary sources considered in the study mainly include several industry experts from core and related industries and preferred suppliers, manufacturers, distributors, service providers, and organizations related to all segments of the coalescing agent industry’s supply chain. After arriving at the overall market size, the total market has been split into several segments and subsegments. The figure below illustrates the breakdown of the primary interviews based on company type, designation, and region conducted during this research study on the coalescing agents market:
To know about the assumptions considered for the study, download the pdf brochure
Market Size Estimation
Both the top-down and bottom-up approaches were used to estimate and validate the total size of the coalescing agents market. These methods were also used extensively to estimate the size of various sub-segments of the market. The research methodology used to estimate the market size includes the following:
- The key players in the industry and markets are identified through extensive secondary research.
- The industry’s supply chain and market size, in terms of value, are determined through primary and secondary research processes.
- All percentage shares, splits, and breakdowns are determined using secondary sources and verified through primary sources.
Data Triangulation
After arriving at the overall market size-using the market size estimation processes as explained above, the market was split into several segments and sub-segments. In order to complete the overall market engineering process and arrive at the exact statistics of each market segment and sub-segments, the data triangulation and market breakdown procedures were employed, wherever applicable. The data was triangulated by studying various factors and trends from both the demand and supply sides in the coalescing agents market.
Research Objectives
- To define, describe, and analyze the coalescing agents market based on type, application, and region
- To forecast and analyze the size of the coalescing agents market (in terms of value and volume) in 5 key regions, namely, APAC, Europe, North America, the Middle East & Africa, and South America
- To forecast and analyze the coalescing agents market at the country level in each region
- To strategically analyze each submarket with respect to the individual growth trends and its contribution to the overall coalescing agents market
- To analyze opportunities in the coalescing agents market for the stakeholders by identifying high-growth segments of the market
- To identify significant market trends and factors driving or inhibiting the growth of the coalescing agents market and its submarkets
- To strategically profile the key players in the coalescing agents market and comprehensively analyze their growth strategies
Available Customizations
With the given market data, MarketsandMarkets offers customizations according to the specific needs of companies. The following customization options are available for the report:
Regional Analysis
- A further breakdown of the regional coalescing agents market to the country level with additional applications and/or types
Country Information
- Additional country information (up to 3)
Company Information
- Detailed analysis and profiles of additional market players (up to 5)


Growth opportunities and latent adjacency in Coalescing Agent Market