Composites Testing Market by Testing Type (Destructive, Non-Destructive), Product Type (Continuous Fiber, Discontinuous Fiber, Polymer Matrix, Ceramic Matrix), Application (Aerospace & Defense, Transportation, Wind) & Region - Global Forecast to 2026


[143 Pages Report] The composites testing market was valued at USD 1.47 Billion in 2015, and is projected to reach USD 3.06 Billion in 2026 at a CAGR of 6.95%. The use of composites is becoming crucial in the interior and exterior structural applications of aircraft and transport vehicles due their high strength, and superior performance. These composites have to comply with the stringent composites testing standards and manufacturers’ proprietary testing standards to ensure safety and durability.
In this study, the years considered to estimate the market size of composites testing are:
- Base Year – 2015
- Estimated Year – 2016
- Projected Year – 2026
- Forecast Period – 2016 to 2021 (medium-term) and 2016 to 2026 (long term)
2015 has been considered the base year for company profiles. Whenever information was unavailable for the base year, the prior year has been considered.
Objectives of the Study
- To define, describe, and forecast the global composites testing market, in terms of value
- To identify and measure the global market by testing type, product type, application, and region
- To analyze significant region-specific market trends in North America, Europe, Asia-Pacific, Latin America, and the Middle East & Africa (ME&A) and country-specific trends in the U.S., Germany, France, the U.K., China, and India
- To provide detailed information regarding the major factors influencing the growth of the market (drivers, restraints, opportunities, industry-specific challenges)
- To strategically profile and analyze the key market players and their core competencies
- To analyze recent market developments such as partnerships, joint ventures, and mergers & acquisitions of the global composites testing market
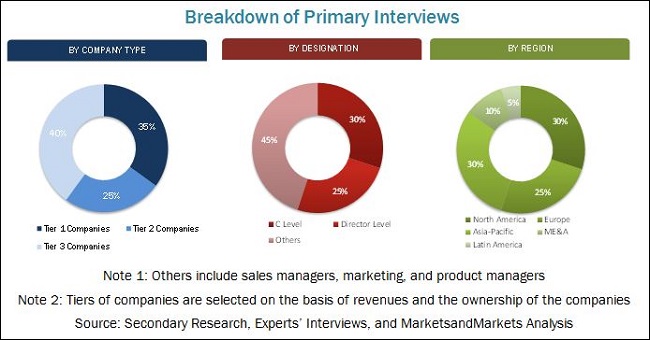
Various secondary sources such as such as Factiva, Hoovers, Manta and others have been used to understand and gain insights into the global market. Experts from top composites testing companies have been interviewed to verify and collect critical information and to assess the trends in the global composites testing market during the forecast period. The top-down, bottom up and data triangulation approaches have been implemented to calculate the exact values of the overall parent and individual market sizes.
To know about the assumptions considered for the study, download the pdf brochure
The market for composites testing has a diversified ecosystem, including the downstream stakeholders such as manufacturers, vendors, end-users, and government organizations. Some of the major composite testing service providers are Exova Group (U.K.), Intertek Group (U.K.), Mistras Group Inc. (U.S.)., Element Materials Technology (U.S.), Westmoreland Mechanical Testing & Research Inc. (U.S.), Matrix Composites (U.K.) , Instron (U.K.), ETIM Composites Testing Laboratory (France), Henkel AG & CO. KGaA (Germany). This study focuses on the various types of composites testing methods that are used by end-users, such as, aircraft manufacturers, automotive manufacturers, rotor blade manufacturers and others.
Please visit 360Quadrants to see the vendor listing of Top 20 Composites Companies, Worldwide 2023
Target audience
- Composites manufacturers
- Raw material suppliers
- Prepreg suppliers
- Distributors & suppliers
- Industry associations
“The study answers several questions for the stakeholders, primarily which market segments they should focus upon during the next two to five years to prioritize their efforts and investments.”
Scope of the Report:
This research report categorizes the global market of aerospace composites based on fiber type, resin type, aircraft type, application, and region. It forecasts revenue growth and gives an analysis of trends in each of the submarkets till 2026
On the basis of Product Type,
- Continuous fiber composites
- Discontinuous fiber composites
- Polymer matrix composites
- Ceramic matrix composites
- Others
On the basis of Testing Method
- Destructive
- Non-destructive
On the basis of Application
- Aerospace & defense
- Transportation
- Wind energy
- Building & construction
- Sporting goods
- Electricals & electronics
- Others
On the basis of Region
- North America
- Europe
- Asia-Pacific
- Latin America
- Middle East & Africa
Available Customizations
With the given market data, MarketsandMarkets offers customizations according to the specific needs of the companies. The following customization options are available for the report:
Product Analysis
- Product matrix, which gives a detailed comparison of the product portfolio of each company
Regional Analysis
- Further breakdown of the North American market
- Further breakdown of the European market
- Further breakdown of the Asia-Pacific region market
- Further breakdown of the South American market
- Further breakdown of the Middle Eastern & African market
Company Information
- Detailed analysis and profiles of additional market players
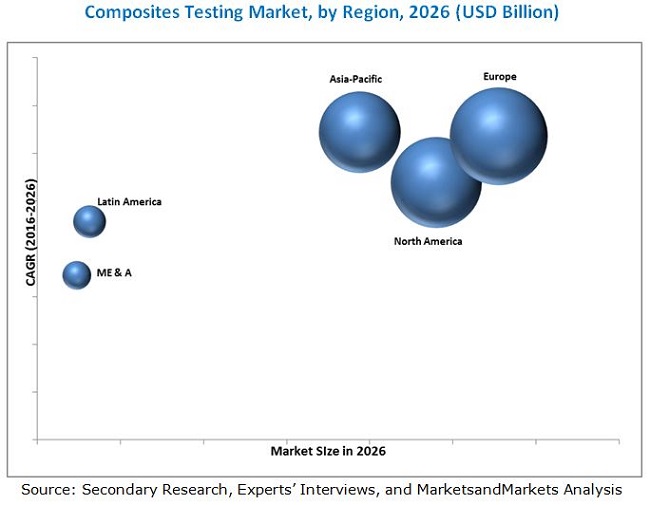
The global composites testing market is projected to reach USD 3.06 Billion by 2026, at a CAGR of 6.95%, from 2016 to 2026. The increasing penetration of composites in the aerospace & defense, transportation and wind energy applications and stringent composites testing standards, are the key factors responsible for the growth of the global composites testing market.
The global market is segmented into testing method, product type, application and region. The market, by testing method is further segmented into destructive and non-destructive testing methods. The destructive composites testing market is expected to grow at a faster rate during the forecast period due to the increasing penetration of composites in the wind energy and sporting goods applications. However, the non-destructive composites testing applications accounted for the largest market share owing to the high demand from high end applications such as aerospace & defense and transportation.
By product type, continuous fiber composites had the largest market share in terms of value owing to their high demand from commercial airline companies and automotive manufacturers globally.
The high penetration of composites in various applications such as aerospace & defense, transportation, wind energy, building & construction, sporting goods, electrical & electronics and others is driving the demand for composites testing. Different types of composites used in these applications have to comply with stringent composites testing standards, as well as manufacturers’ proprietary testing standards at every step in the supply chain of composite manufacturing. The aerospace & defense applications led the composites testing market owing to the high demand for composites testing services from advanced commercial aircraft. Advanced commercial aircraft have a significant percentage of composites in their airframe structures. The composites used in airframe structures therefore require different testing methods to ensure their safety and performance.
Europe accounted for the largest market share in the global composites testing market during the forecast period. This is due to the low interest rates, the presence of established players, very high growth in the number of commercial aircraft deliveries, clearance in the backlog of purchase orders from Airbus and the replacement of old aircraft. In addition, government policies such as, by the European Union Automotive Fuel Economy (UNEP) which emphasizes the use of light weight materials in transportation to increase fuel efficiency, are further driving the market in Europe.
The global composites testing market is growing rapidly, in terms of value. However, a few factors act as restraints in the growth of the market. Issues related to recyclability and lack of trained operators for composites testing are the major restraints in the growth of the market.
Companies such as Exova Group plc (U.K.), Intertek Group plc (U.K.), Mistras Group Inc. (U.S.)., Element Materials Technology (U.S.), Westmoreland Mechanical Testing & Research Inc. (U.S.), Matrix Composite Inc. (U.K.) , Instron (U.K.), ETIM Composites Testing Laboratory (France), Henkel AG & CO. KGaA (Germany) are the leading market players in the global composites testing market. They have been adopting various organic and inorganic growth strategies such as agreements & partnerships, investments & expansions and acquisitions to enhance their shares in the global market.
To speak to our analyst for a discussion on the above findings, click Speak to Analyst
 Exclusive indicates content/data unique to MarketsandMarkets and not available with any competitors.
Table of Contents
1 Introduction (Page No. - 15)
1.1 Objectives of the Study
1.2 Market Definition
1.3 Market Scope
1.3.1 Years Considered in the Report
1.4 Currency
1.5 Limitations
1.6 Stakeholders
2 Research Methodology (Page No. - 17)
2.1 Research Data
2.1.1 Secondary Data
2.1.1.1 Key Data From Secondary Sources
2.1.2 Primary Data
2.1.2.1 Key Data From Primary Sources
2.1.2.2 Key Industry Insights
2.1.2.3 Breakdown of Primary Interviews
2.2 Market Size Estimation
2.2.1 Bottom-Up Approach
2.2.2 Top-Down Approach
2.3 Composites Testing Market: Data Triangulation
2.3.1 Research Assumptions
3 Executive Summary (Page No. - 24)
4 Premium Insights (Page No. - 29)
4.1 Significant Opportunities in the Composite Testing Market
4.2 Composites Testing Market, By Product Type
4.3 Composites Testing Market, By Region
4.4 Composites Testing Growth, By Country
4.5 Application Growth Matrix
5 Market Overview (Page No. - 32)
5.1 Introduction
5.2 Market Segmentation
5.2.1 Composites Testing Market, By Product Type
5.2.2 Composites Testing Market, By Testing Methods
5.2.3 Composites Testing Market, By Application
5.2.4 Composites Testing Market, By Region
5.3 Market Dynamics
5.3.1 Drivers
5.3.1.1 Increasing Demand for Composite Testing From Automotive and Aerospace & Defense Industries to Meet High Performance Standards
5.3.1.2 Growing Demand for Testing of Hydraulic Frames in Aerospace & Defense Application
5.3.1.3 Absence of Coherent Database for Testing Composites for Different Applications
5.3.1.4 Large Investments for Composites Testing Facilities in Asia-Pacific
5.3.2 Restraints
5.3.2.1 Lack of Trained Operators and Expertise in Developing Regions
5.3.2.2 Issues Related to Recyclability of Composites
5.3.3 Opportunities
5.3.3.1 Automated Methods for Composites Testing
5.3.3.2 Penetration of Composites in Various Industries
5.3.4 Challenges
5.3.4.1 Analyzing Complex Fiber Composition
5.3.4.2 Standardization of Composites Testing Methods
5.3.5 Threat of New Entrants
5.3.6 Threat of Substitutes
5.3.7 Bargaining Power of Suppliers
5.3.8 Bargaining Power of Buyers
5.3.9 Intensity of Competitive Rivalry
6 Macroeconomic Overview and Key Trends (Page No. - 41)
6.1 Introduction
6.2 Trends and Forecast of GDP
6.3 Per Capita GDP vs Per Capita Composite Materials Demand
6.4 Trends of the Aerospace Industry
6.5 Air Traffic Trends in the Aerospace Industry
6.6 Trends of Automotive Industry
6.7 Trends of Wind Energy Industry
7 Composites Testing Market, By Testing Method (Page No. - 50)
7.1 Introduction
7.2 Non-Destructive Testing
7.2.1 Visual Testing
7.2.2 Tap Testing
7.2.3 Ultrasonic Testing
7.2.4 Thermography Testing
7.2.5 Radiographic Testing
7.2.6 Shearography Testing
7.3 Destructive Testing
7.3.1 Compression Testing
7.3.2 Flexure Testing
7.3.3 Hardness Testing
7.3.4 Tensile Testing
7.3.5 Impact Testing
8 Composites Testing Market, By Product Type (Page No. - 58)
8.1 Introduction
8.2 Continuous Fiber Composites
8.3 Discontinuous Fiber Composites
8.4 Polymer Matrix Composites
8.5 Ceramic Matrix Composites
8.6 Other Composites
9 Composites Testing Market, By Application (Page No. - 65)
9.1 Introduction
9.2 Aerospace & Defense
9.3 Transportation
9.4 Wind Energy
9.5 Building & Construction
9.6 Sporting Goods
9.7 Electricals & Electronics
9.8 Others
9.8.1 Marine
9.8.2 Medical
9.8.3 Pipes & Tanks
10 Regional Analysis (Page No. - 78)
10.1 Introduction
10.2 North America
10.2.1 Composites Testing Market Size in North America, By Testing Method
10.2.2 Market Size in North America, By Application
10.2.3 Market Size in North America, By Country
10.2.4 Canada
10.2.4.1 Market Size in Canada, By Testing Method
10.2.4.2 Market Size in Canada, By Application
10.2.5 U.S.
10.2.5.1 Market Size in U.S., By Testing Method
10.2.5.2 Market Size in U.S., By Application
10.3 Europe
10.3.1 Market Size in Europe, By Testing Method
10.3.2 Market Size in Europe, By Application
10.3.3 Market Size in Europe, By Country
10.3.3.1 France
10.3.3.1.1 Market Size in France, By Testing Method
10.3.3.1.2 Market Size in France, By Application
10.3.3.2 Germany
10.3.3.2.1 Market Size in Germany, By Testing Method
10.3.3.2.2 Market Size in Germany, By Application
10.3.3.3 U.K.
10.3.3.3.1 Market Size in U.K, By Testing Method
10.3.3.3.2 Market Size in U.K., By Application
10.3.3.4 Italy
10.3.3.4.1 Market Size in Italy, By Testing Method
10.3.3.4.2 Market Size in Italy, By Application
10.3.3.5 Spain
10.3.3.5.1 Market Size in Spain, By Testing Method
10.3.3.5.2 Market Size in Spain, By Application
10.3.3.6 Netherlands
10.3.3.7 Austria
10.3.3.8 Russia
10.3.3.9 Turkey
10.3.3.10 Rest of Europe
10.4 Asia-Pacific
10.4.1 Composites Testing Market Size in Asia-Pacific, By Testing Method
10.4.1.1 Composites Testing Market Size in Asia-Pacific, By Application
10.4.1.2 Composites Testing Market Size in Asia-Pacific, By Country
10.4.1.3 China
10.4.1.3.1 Market Size in China, By Testing Method
10.4.1.3.2 Market Size in China, By Application
10.4.1.4 Japan
10.4.1.4.1 Market Size in Japan, By Testing Method
10.4.1.4.2 Market Size in Japan, By Application
10.4.1.5 India
10.4.1.5.1 Market Size in India, By Testing Method
10.4.1.5.2 Market Size in India, By Application
10.4.1.6 Malaysia
10.4.1.7 Singapore
10.4.1.8 South Korea
10.4.1.9 Australia & New Zealand
10.4.1.10 Rest of Asia-Pacific
10.5 Latin America
10.5.1 Composites Testing Market Size in Latin America, Y Testing Method
10.5.2 Composites Testing Market Size in Latin America, By Application
10.5.3 Composites Testing Market Size in Latin America, By Country
10.5.3.1 Brazil
10.5.3.1.1 Market Size in Brazil, By Testing Method
10.5.3.1.2 Market Size in Brazil, By Application
10.5.3.2 Mexico
10.5.3.3 Argentina
10.5.3.4 Rest of Latin America
10.6 Middle East & Africa
10.6.1 Composites Testing Market Size in Middle East & Africa, By Testing Method
10.6.2 Composites Testing Market Size in Middle East & Africa, By Application
10.6.3 Composites Testing Market Size in Middle East & Africa, By Country
10.6.4 UAE
10.6.4.1 Market Size in UAE, By Testing Method
10.6.4.2 Market Size in UAE, By Application
10.6.5 South Africa
10.6.5.1 Market Size in South Africa, By Testing Method
10.6.5.2 Market Size in South Africa, By Application
10.6.6 Qatar
10.6.7 Rest of Middle East & Africa
11 Competitive Landscape (Page No. - 111)
11.1 Introduction
11.2 Competitive Situation and Trends
11.2.1 Growth Strategies in Composites Testing Market, 2012–2016
11.2.2 Developments in Composite Testing Market, 2012–2016
11.2.2.1 Maximum Developments in 2015
11.2.3 Market Share Analysis
11.2.4 Agreements
11.2.5 Investments & Expansions
11.2.6 Acquisitions
12 Company Profiles (Page No. - 117)
(Overview, Financial*, Products & Services, Strategy, and Developments)
12.1 Exova Group PLC.
12.2 Intertek Group PLC.
12.3 Henkel AG & Co. KGaA
12.4 Instron Corporation
12.5 Mistras Group, Inc.
12.6 Element Materials Technology
12.7 Westmoreland Mechanical Testing and Research, Inc.
12.8 Matrix Composites, Inc.
12.9 ETIM Composites
12.10 Composites Testing Laboratory Ltd.
*Details Might Not Be Captured in Case of Unlisted Companies.
13 Appendix (Page No. - 135)
13.1 Insights From Industry Experts
13.2 Discussion Guide
13.3 Knowledge Store: Marketsandmarkets Subscription Portal
13.4 Introducing RT: Real-Time Market Intelligence
13.5 Available Customizations
13.6 Related Reports
13.7 Author Details
List of Tables (75 Tables)
Table 1 Global Composites Testing Market, 2014-2026 (USD Million)
Table 2 Trends and Forecast of GDP, 2015–2021 (USD Billion)
Table 3 Per Capita GDP vs Per Capita Composite Materials Demand, 2015
Table 4 Number of New Airplane Deliveries, By Region
Table 5 Air Traffic Trends in the Aerospace Industry, By Region, 2011–2015, (Revenue Passenger Kilometers)
Table 6 Automotive Production, Million Units (2011–2015)
Table 7 Wind Energy Instalation, MW (2011–2015)
Table 8 Composites Testing Market Size, By Testing Type, 2014-2026 (USD Million)
Table 9 Non-Destructive Composites Testing Market Size, By Region, 2014-2026 (USD Million)
Table 10 Non-Destructive Composites Testing Standards for Composites
Table 11 Destructive Composites Testing Standards for Various Mechanical Properties of Composites
Table 12 Destructive Composites Testing Market Size, By Region, 2014-2026 (USD Million)
Table 13 Composites Testing Market Size, By Product Type, 2014-2026 (USD Million)
Table 14 Continuous Fiber Composites Testing Market Size, By Region, 2014-2026 (USD Million)
Table 15 Discontinuous Fiber Composites Testing Market Size, By Region, 2014-2026 (USD Million)
Table 16 Polymer Matrix Composites Testing Market Size, By Region, 2014-2026 (USD Million)
Table 17 Ceramic Matrix Composites Testing Market Size, By Region, 2014-2026 (USD Million)
Table 18 Other Composites Testing Market Size, By Region, 2014-2026 (USD Million)
Table 19 Composites Testing Market Size, By Application, 2014-2026 (USD Million)
Table 20 ASTM Published Standards for Composites Used in Aerospace & Defense
Table 21 Composites Testing Market Size in the Aerospace & Defense Application, By Region, 2014-2026 (USD Million)
Table 22 ASTM Published Standards for Composites Used in Transportation
Table 23 Composites Testing Market Size in the Transportation Application, By Region, 2014-2026 (USD Million)
Table 24 ASTM Published Standards for Composites Used in Wind Energy
Table 25 Composites Testing Market Size in the Wind Energy Application, By Region, 2014-2026 (USD Million)
Table 26 ASTM Published Standards for Composites Used in Building & Construction
Table 27 Composites Testing Market Size in Building & Construction Application, By Region, 2014-2026 (USD Million)
Table 28 Composites Testing Market Size in the Sporting Goods Application, By Region, 2014-2026 (USD Million)
Table 29 Market Size in the Electricals & Electronics Application, By Region, 2014-2026 (USD Million)
Table 30 Market Size in Other Application, By Region, 2014-2026 (USD Million)
Table 31 Market Size, By Region, 2014-2026 (USD Million)
Table 32 North America: Composites Testing Market Size, By Testing Method, 2014-2026 (USD Million)
Table 33 North America: Market Size, By Application, 2014-2026 (USD Million)
Table 34 North America: Market Size, By Country, 2014-2026 (USD Million)
Table 35 Canada: Market Size, By Testing Method, 2014-2026 (USD Million)
Table 36 Canada: Market Size, By Application, 2014–2026 (USD Million)
Table 37 U.S.: Market Size, By Testing Method, 2014–2026 (USD Million)
Table 38 U.S.: Composites Testing Market Size, By Application, 2014-2026 (USD Million)
Table 39 Europe: Composites Testing Market Size, By Testing Method, 2014-2026 (USD Million)
Table 40 Europe: Composites Testing Market Size, By Application, 2014-2026 (USD Million)
Table 41 Europe: Market Size, By Country, 2014-2026 (USD Million)
Table 42 France: Market Size, By Testing Method, 2014-2026 (USD Million)
Table 43 France: Market Size, By Application, 2014-2026 (USD Million)
Table 44 Germany: Market Size, By Testing Method, 2014-2026 (USD Million)
Table 45 Germany: Market Size, By Application, 2014-2026 (USD Million)
Table 46 U.K.: Market Size, By Testing Method, 2014-2026 (USD Million)
Table 47 U.K.: Market Size, By Application, 2014-2026 (USD Million)
Table 48 Italy: Market Size, By Testing Method, 2014-2026 (USD Million)
Table 49 Italy: Market Size, By Application, 2014-2026 (USD Million)
Table 50 Spain: Composites Testing Market Size, By Testing Method, 2014-2026 (USD Million)
Table 51 Spain: Composites Testing Market Size, By Application, 2014-2026 (USD Million)
Table 52 Asia-Pacific: Composites Testing Market Size, By Testing Method, 2014-2026 (USD Million)
Table 53 Asia-Pacific: Market Size, By Application, 2014-2026 (USD Million)
Table 54 Asia-Pacific: Market Size, By Country, 2014-2026 (USD Million)
Table 55 China: Market Size, By Testing Method, 2014-2026 (USD Million)
Table 56 China: Market Size, By Application, 2014-2026 (USD Million)
Table 57 Japan: Composites Testing Market Size, By Testing Method, 2014-2026 (USD Million)
Table 58 Japan: Market Size, By Application, 2014-2026 (USD Million)
Table 59 India: Market Size, By Testing Method, 2014-2026 (USD Million)
Table 60 India: Market Size, By Application, 2014-2026 (USD Million)
Table 61 Latin America: Composites Testing Market Size, By Testing Method, 2014-2026 (USD Million)
Table 62 Latin America: Market Size, By Application, 2014-2026 (USD Million)
Table 63 Latin America: Market Size, By Country, 2014-2026 (USD Million)
Table 64 Brazil: Market Size, By Testing Method, 2014-2026 (USD Million)
Table 65 Brazil: Market Size, By Application, 2014-2026 (USD Million)
Table 66 Middle East & Africa: Composites Testing Market Size, By Testing Method, 2014-2026 (USD Million)
Table 67 Middle East & Africa: Market Size, By Application, 2014-2026 (USD Million)
Table 68 Middle East & Africa: Composites Testing Market Size, By Country, 2014-2026 (USD Million)
Table 69 UAE: Market Size, By Testing Method, 2014-2026 (USD Million)
Table 70 UAE: Market Size, By Application, 2014-2026 (USD Million)
Table 71 South Africa: Market Size, By Testing Method, 2014-2026 (USD Million)
Table 72 South Africa: Composites Testing Market Size, By Application, 2014-2026 (USD Million)
Table 73 Agreements, 2012–2016
Table 74 Investments & Expansions, 2012–2016
Table 75 Acquisitions, 2012–2016
List of Figures (52 Figures)
Figure 1 Composites Testing Market Segmentation
Figure 2 Composites Testing Market: Research Methodology
Figure 3 Market Size Estimation Methodology: Bottom-Up Approach
Figure 4 Market Size Estimation Methodology: Top-Down Approach
Figure 5 Data Triangulation Methodology
Figure 6 Continuous Fiber Composites to Drive Composites Testing Market Between 2016 and 2021
Figure 7 Aerospace & Defense to Dominate Composites Testing Market, 2016–2021
Figure 8 Non-Destructive Testing to Dominate the Composites Testing Market, 2016-2021
Figure 9 Europe to Be the Largest and Fastest-Growing Composites Testing Market, 2016-2021
Figure 10 Attractive Opportunities in the Composites Testing Market, 2016 vs 2021
Figure 11 Continuous Fiber Composites to Drive the Composites Testing Market, 2016–2021
Figure 12 Europe Accounted for the Largest Share in the Composites Testing Market in 2015ss
Figure 13 China to Be the Fastest-Growing Composites Testing Market, 2016–2021
Figure 14 Aerospace & Defense to Have A Long-Term Impact on Composites Testing Market During the Forecast Period
Figure 15 Drivers, Restraints, Opportunities, and Challenges in the Composites Testing Market
Figure 16 Porter’s Five Forces: Intensity of Rivalry is High Due to Presence of Few Players
Figure 17 Trends and Forecast of GDP, 2016–2021 (USD Billion)
Figure 18 Per Capita GDP vs Per Capita Composite Materials Demand
Figure 19 New Airplane Deliveries, By Region, 2015–2034
Figure 20 Air Traffic Trends, By Region, 2011–2015
Figure 21 Automotive Production in Key Coutries, Million Units (2011 vs 2015)
Figure 22 Wind Energy Installed Capacity, MW (2014–2015)
Figure 23 Non-Destructive Testing to Dominate the Composites Testing Market, 2016 vs 2021
Figure 24 Europe to Dominate Non-Destructive Composites Testing Market During, 2016–2021
Figure 25 Asia-Pacific to Register the Highest CAGR in the Destructive Composites Testing Market, 2016–2021
Figure 26 Continuous Fiber Composites to Dominate the Composites Testing Market, 2016–2021
Figure 27 Europe to Dominate the Continuous Fiber Composites Testing Market During the Forecast Period
Figure 28 Aerospace & Defense to Outpace Other Applications, 2016 -2021
Figure 29 North America to Drive the Composites Testing Market in Aerospace & Defense Application, 2016-2021
Figure 30 Europe to Drive the Composites Testing Market in the Transportation Application, 2016–2021
Figure 31 Asia-Pacific to Drive the Composites Testing Market in the Wind Energy Application, 2016-2021
Figure 32 North America Dominates the Market in the Building & Construction Application, 2016-2021
Figure 33 Asia-Pacific to Dominate the Market in the Sporting Goods Application, 2016–2021
Figure 34 Asia-Pacific to Dominate the Market in the Electrical & Electronics Application, 2016–2021
Figure 35 North America to Dominate the Market in Others Application, 2016–2021
Figure 36 Asia-Pacific to Witness the Highest CAGR in the Composites Testing Market, 2016–2021
Figure 37 North America Composites Testing Market Snapshot: U.S. is the Most Lucrative Market
Figure 38 Europe Composites Testing Market Snapshot: France is the Most Lucrative Market
Figure 39 Asia-Pacific Composites Testing Market Snapshot: China is the Most Lucrative Market
Figure 40 Investments & Expansions and Mergers & Acquisitions to Be the Most Preferred Growth Strategies, 2012–2016
Figure 41 Investments & Expansions: Most Preferred Strategy Between 2012 and 2016
Figure 42 Number of Strategies Adopted By Key Players Between 2012 and 2016
Figure 43 Exova Group PLC.: Company Snapshot
Figure 44 Exova Group PLC.: SWOT Analysis
Figure 45 Intertek Group PLC.: Company Snapshot
Figure 46 Intertek Group PLC.: SWOT Analysis
Figure 47 Henkel AG & Co. KGaA: Company Snapshot
Figure 48 Henkel AG & Co.KGaA: SWOT Analysis
Figure 49 Instron Corporation: Company Snapshot
Figure 50 Instron Corporation: SWOT Analysis
Figure 51 Mistras Group, Inc.: Company Snapshot
Figure 52 Mistras Group, Inc.: SWOT Analysis


Growth opportunities and latent adjacency in Composites Testing Market