Data Center Automation Market by Solution (Server, Network, Storage Automation), by Services (Consulting, Installation and Support Services), & by End User (Enterprises, Cloud Service Providers, Colocation Service Providers) � Global Forecast to 2019


[174 Pages Report] The total data center automation market is expected to grow from $3.16 billion in 2014 to $7.53 billion by 2019, at an estimated Compound Annual Growth Rate (CAGR) of 18.97% from 2014 to 2019.
Increasing usage of internet and networking globally has significantly augmented the demand for more storage space, computing power and complex networking. This demand has given rise to scaling up of infrastructure in the existing data centers, thus increasing the capital expenditure and operating expenditure for data centers and the enterprises. This scaling up has also increased the complexity in networking, unification and pooling of resources in data centers. All these factors play crucial role in the growth in demand in the global data center automation market.
To overcome these issues of rising demand for resource pooling, simplification in networking and overall management of data centers; innovators have come up with the sophisticated concept of data center automation which is also known as Software Defined Data Centers (SDDCs). This concept helps traditional data center users to scale up their existing infrastructure seamlessly, thereby resulting in reduced overheads. This also helps in unification of server storage and networking, along with simplified management of all resources. Data center automation helps to overcome the obstacles of scalability, flexibility, manageability, and reduced costs, which is in turn helping enterprises and service providers in managing their existing data centers and networks.
Another major driver for data center automation market is its inherent capability of interoperability which enables solutions to get implemented on any hardware irrespective of the vendor or manufacturer, with an added advantage of multi tenancy support. The future adoption of automation technology is expected to be in heterogeneous environments and hybrid clouds, with more focus on software defined security. The market research report analyzes market dynamics, future roadmaps and global trends, and also provides competitive intelligence and forecasts over the next five years.
Some of the key vendors occupying the market are HP, IBM, Oracle, Dell, Brocade, Cisco, Microsoft, CA Technologies, VMware and BMC Software. The data center automation research report discusses the strategies and insights of the key vendors in the industry and also provides in-depth study of driving forces and challenges. The report also analyzes the global trends and future growth potentials across different regions.
MarketsandMarkets has segmented the global data center automation market by solution types, services, end-users, industry verticals and geographical region. The report also consists of MarketsandMarkets views of the key players and analysts insights on various developments that are taking place in the market space. The forecast period for market research report is 2014-2019, that considers 2013 as the base year. The research report covers complete market categorized into the following sub-markets:
On the basis of type of solution:
- Network automation
- Server automation
- Storage automation
On the basis of service:
- Consulting service
- Installation and support services
On the basis of end-user:
- Enterprises
- Cloud service providers
- Colocation service providers
On the basis of industry vertical:
- Telecom and Information Technology (IT)
- Banking, Financial Services and Insurance (BFSI)
- Media and Entertainment
- Public Sector
- Healthcare
- Manufacturing
- Retail
- Other vertical
On the basis of geographical region:
- North America (NA)
- Europe
- Asia-Pacific (APAC)
- Middle East and Africa (MEA)
- Latin America (LA)
The rising need for virtualized data centers and the incessantly increasing data traffic has posed as a threat to enterprises and infrastructure providers alike. This is considered as a strong driver for the global data center automation market. The increased cost overheads and complexities in the networking environment have given way to the adoption of data center automation, thereby aiding companies in cutting down their operational and capital expenditure (CAPEX).
Typically, the infrastructure cost of data centers rises while scaling up from their existing architectures. This often leads to several complexities and interoperability issues between different components, thereby increasing demand for a seamless software defined environment. The SDDC comprises software defined storage (SDS), software defined networking (SDN) and software defined server/compute, wherein all the three components of networking are empowered by specialized controllers, which abstract the controlling plane from the underlying physical equipment. This controller virtualizes the network, server and storage capabilities of a data center, thereby giving a better visibility into data traffic routing and server utilization. This, in turn results in a controller driven environment, which accentuates data center performance while ensuring significantly low operating expenses (OPEX).
This report gives detailed insights into the global data center automation market split across various regions, type of solution and type of end-users. While the solutions include Network automation, server automation and storage automation; by services: installation services, consulting services, and support services; by end users: SME, Large enterprise; by regions: North America (NA), Asia Pacific (APAC), Europe (EU), Middle East and Africa (MEA) and Latin America (LA). The report also emphasizes on key adoption trends, evolution of data centers, future opportunities and business cases in this innovative market.
MarketsandMarkets expects an increasing adoption of SDDC solutions, as major vendors are aggressively investing and rigorously working towards building cost effective data center solutions, in an effort to reduce the overall cost incurred by end-users. The total data center automation market is expected to grow from $3.16 billion in 2014 to $7.53 billion by 2019, at an estimated Compound Annual Growth Rate (CAGR) of 18.97% from 2014 to 2019.
Data Center Automation: Market Size, 2014 � 2019 ($Billion, Y-O-Y %)
Source: Expert Views, Primary Interviews, and MarketsandMarkets Analysis
The figure given below highlights the market size and Y-O-Y growth pattern of the market, for the forecast period from 2014 to 2019.
Data Center Automation: Market, 2014 � 2019, Y-O-Y (%)
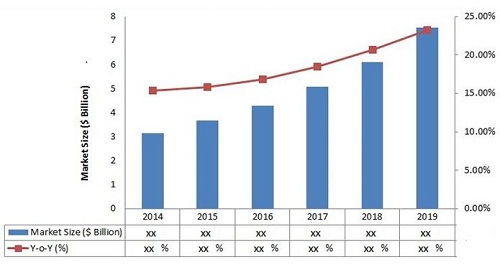
Source: Expert Views, Primary Interviews, and MarketsandMarkets Analysis
 Exclusive indicates content/data unique to MarketsandMarkets and not available with any competitors.
Table of Contents
1 Introduction (Page No. - 18)
1.1 Objectives of the Study
1.2 Market Overview
1.3 Markets Covered
1.4 Stakeholders
1.5 Market Scope
1.6 Currency
2 Research Methodology (Page No. - 22)
2.1 Description of the Demand-Side Analysis
2.1.1 Data Center Cooling
2.1.2 Emerging Data Center Cooling Technologies
2.1.2.1 Free Cooling
2.1.2.2 Liquid Cooling
2.1.2.3 Evaporative Cooling
2.1.3 Green Data Centers
2.2 Market Size Estimation
2.3 Market Breakdown and Data Triangulation
2.4 Market Share Estimation
2.4.1 Key Data Taken From Secondary Sources
2.4.2 Key Data From Primary Sources
2.4.2.1 Key Industry Insights
2.4.3 Assumptions
3 Executive Summary (Page No. - 32)
4 Premium Insights (Page No. - 33)
4.1 Attractive Market Opportunities in Data Center Automation
4.2 Data Center Automation Market�Top Three Solution
4.3 Data Center Automation Market Across Various Region
4.4 Life Cycle Analysis, By Region
4.5 Market Chasm Analysis
5 Market Overview (Page No. - 37)
5.1 Introduction
5.1.1 Storage Automation
5.1.2 Networking Automation
5.1.3 Server Automation
5.2 Evolution
5.3 Market Segmentation
5.3.1 Data Center Automation Market: By Solution
5.3.2 Data Center Automation Market: By Services
5.3.3 Data Center Automation Market: By End User
5.4 Market Dynamics
5.4.1 Drivers
5.4.1.1 Innovations in Processing Power and Memory
5.4.1.2 High Demand for Resource Pooling
5.4.1.3 Custom/Manual Networking Configuration
5.4.2 Restraint
5.4.2.1 Interoperability Issues
5.4.3 Opportunities
5.4.3.1 Heterogeneous Environment
5.4.3.2 Hybrid Clouds
6 Industry Trends (Page No. - 43)
6.1 Value Chain Analysis
6.2 Technology Trends and Standards
6.2.1 Introduction
6.2.2 Infrastructure Standards and Guidelines for Data Center Automation
6.2.2.1 American National Standards Institute (ANSI)
6.2.2.2 Telecommunication Industry Association (TIA)
6.2.2.3 National Electrical Manufacturers Association (NEMA)
6.2.2.4 Canadian Standards Association (CSA)
6.2.2.5 Underwriters Laboratory (UL)
6.2.2.6 Factory Mutual (FM) Approved
6.2.2.7 Health Insurance Portability and Accountability Act of 1996 (HIPAA)
6.2.2.8 Made in USA (for U.S. Region)
7 Data Center Automation Market Analysis, By Solution Type (Page No. - 45)
7.1 Introduction
7.2 Network Automation
7.2.1 Overview
7.3 Server Automation
7.3.1 Overview
7.4 Storage Automation
7.4.1 Overview
8 Data Center Automation Market Analysis, By Service (Page No. - 68)
8.1 Introduction
8.2 Consulting Services
8.2.1 Overview
8.3 Installation and Support Services
8.3.1 Overview
9 Data Center Automation Market Analysis, By End User (Page No. - 83)
9.1 Introduction
9.2 Enterprises
9.2.1 Overview
9.3 Cloud Services Provider
9.3.1 Overview
9.4 Colocation Services Provider
9.4.1 Overview
10 Data Center Automation Market Analysis, By Vertical (Page No. - 91)
10.1 Introduction
10.2 Banking, Financial Services, and Insurance (BFSI)
10.2.1 Overview
10.3 IT and Telecom
10.3.1 Overview
10.4 Media and Entertainment
10.4.1 Overview
10.5 Public Sector
10.5.1 Overview
10.6 Retail
10.6.1 Overview
10.7 Manufacturing
10.7.1 Overview
10.8 Healthcare
10.8.1 Overview
10.9 Other Verticals
10.9.1 Overview
11 Geographic Analysis (Page No. - 109)
11.1 Introduction
11.2 North America (NA)
11.2.1 Overview
11.3 Europe
11.3.1 Overview
11.4 Asia-Pacific (APAC)
11.4.1 Overview
11.5 Middle East and Africa (MEA)
11.5.1 Overview
11.6 Latin America (LA)
11.6.1 Overview
12 Competitive Landscape (Page No. - 122)
12.1 Overview
12.1.1 Ecosystem and Roles
12.2 End-User Landscape
12.2.1 Market Opportunity Analysis
12.2.2 End User Analysis
12.2.2.1 North American Colocation Market is Expected to Grow By 15% Annual Growth Rate
12.2.2.2 The Space Required for Data Center Will Surpass By 500,000 Ft2
12.2.2.3 Electricity Prices in the U.S. is Expected to Rise More Than 21.35% in the Coming 10 Years
12.2.2.4 Mega Data Center Market is Expected to Be Worth $20.55 Billion By 2019
12.3 Competitive Situation and Trends
12.4 New Product Launches
12.5 Agreements, Partnerships, Collaborations, and Joint Ventures
12.6 Partnerships, and Merger & Acquisitions
12.7 Expansions
13 Company Profiles (Page No. - 133)
(Business Overview, Products & Services, Key Insights, Recent Developments, SWOT Analysis, Mnm View)*
13.1 Introduction
13.2 Hewlett-Packard
13.3 IBM
13.4 Oracle
13.5 Dell, Inc.
13.6 Fujitsu
13.7 Brocade Communications Systems
13.8 CISCO
13.9 Microsoft Corporation
13.10 CA Technologies, Inc.
13.11 VMware, Inc.
13.12 BMC Software, Inc.
*Details on Business Overview, Products & Services, Key Insights, Recent Developments, SWOT Analysis, MnM View Might Not Be Captured in Case of Unlisted Companies.
14 Appendix (Page No. - 170)
14.1 Introducing RT: Real-Time Market Intelligence
14.2 Available Customizations
14.3 Related Reports
List of Tables (98 Tables)
Table 1 Global Data Center Automation Market: Assumptions
Table 2 High Demand of Resource Pooling is Propelling the Growth of Data Center Automation Market
Table 3 Interoperability issues is Restraining the Data Center Automation Market
Table 4 Heterogeneous Environment is Paving New Growth Avenues for Players in the Data Center Automation Market
Table 5 Global Data Center Automation Market Size, By Solution, 2012�2019 ($Billion)
Table 6 Network Automation Market Size, By End User, 2012�2019 ($Billion)
Table 7 Network Automation Market Size, By Region, 2012�2019 ($Billion)
Table 8 Network Automation Market Size for NA, By Country, 2012�2019 ($Billion)
Table 9 Network Automation Market Size for Europe, By Country, 2012�2019 ($Billion)
Table 10 Network Automation Market Size for APAC, By Country, 2012�2019 ($Billion)
Table 11 Network Automation Market Size for MEA, By Country, 2012�2019 ($Billion)
Table 12 Network Automation Market Size for LA, By Country, 2012�2019 ($Billion)
Table 13 Server Automation Market Size, By End User, 2012�2019 ($Billion)
Table 14 Server Automation Market Size, By Region, 2012�2019 ($Billion)
Table 15 Server Automation Market Size for NA, By Country, 2012�2019 ($Billion)
Table 16 Server Automation Market Size for Europe, By Country, 2012�2019 ($Billion)
Table 17 Server Automation Market Size for APAC, By Country, 2012�2019 ($Billion)
Table 18 Server Automation Market Size for MEA, By Country, 2012�2019 ($Billion)
Table 19 Server Automation Market Size for LA, By Country, 2012�2019 ($Billion)
Table 20 Storage Automation Market Size, By End User, 2012�2019 ($Billion)
Table 21 Storage Automation Market Size, By Region, 2012�2019 ($Billion)
Table 22 Storage Automation Market Size for NA, By Country, 2012�2019 ($Billion)
Table 23 Storage Automation Market Size for Europe, By Country, 2012�2019 ($Billion)
Table 24 Storage Automation Market Size for APAC, By Country, 2012�2019 ($Billion)
Table 25 Storage Automation Market Size for MEA, By Country, 2012�2019 ($Billion)
Table 26 Storage Automation Market Size for LA, By Country, 2012�2019 ($Billion)
Table 27 Global Data Center Automation Market Size, By Service, 2012�2019($Billion)
Table 28 Consulting Services Market Size, By Region, 2012�2019 ($Billion)
Table 29 Consulting Services Market Size for NA, By Country, 2012�2019 ($Billion)
Table 30 Consulting Services Market Size for Europe, By Country, 2012�2019 ($Billion)
Table 31 Consulting Services Market Size for APAC, By Country, 2012�2019 ($Billion)
Table 32 Consulting Services Market Size for MEA, By Country, 2012�2019 ($Billion)
Table 33 Consulting Services Market Size for LA, By Country, 2012�2019 ($Billion)
Table 34 Installation and Support Services Market Size, By Region, 2012�2019 ($Billion)
Table 35 Installation and Support Services Market Size for NA, By Country, 2012�2019 ($Billion)
Table 36 Installation and Support Services Market Size for Europe, By Country, 2012�2019 ($Billion)
Table 37 Installation and Support Services Market Size for APAC, By Country, 2012�2019 ($Billion)
Table 38 Installation and Support Services Market Size for MEA, By Country, 2012�2019 ($Billion)
Table 39 Installation and Support Services Market Size for LA, By Country, 2012�2019 ($Billion)
Table 40 Global Data Center Automation Market Size, By End User, 2012�2019 ($Billion)
Table 41 Enterprise Market Size, By Service, 2012�2019 ($Billion)
Table 42 Enterprise Market Size, By Vertical, 2012�2019 ($Billion)
Table 43 Cloud Services Provider Market Size, By Service, 2012�2019 ($Billion)
Table 44 Cloud Services Provider Market Size, By Vertical, 2012�2019 ($Billion)
Table 45 Colocation Services Provider Market Size, By Service, 2012�2019 ($Billion)
Table 46 Colocation Services Provider Market Size, By Vertical, 2012�2019 ($Billion)
Table 47 Global Data Center Automation Market Size, By Vertical, 2012�2019 ($Billion)
Table 48 BFSI Market Size, By Solution, 2012�2019 ($Billion)
Table 49 BFSI Market Size, By Service, 2012�2019 ($Billion)
Table 50 IT and Telecom Market Size, By Solution, 2012�2019 ($Billion)
Table 51 IT and Telecom Market Size, By Service, 2012�2019 ($Billion)
Table 52 Media and Entertainment Market Size, By Solution, 2012�2019 ($Billion)
Table 53 Media and Entertainment Market Size, By Service, 2012�2019 ($Billion)
Table 54 Public Sector Market Size, By Solution, 2012�2019 ($Billion)
Table 55 Public Sector Market Size, By Service, 2012�2019 ($Billion)
Table 56 Retail Market Size, By Solution, 2012�2019 ($Billion)
Table 57 Retail Market Size, By Service, 2012�2019 ($Billion)
Table 58 Manufacturing Market Size, By Solution, 2012�2019 ($Billion)
Table 59 Manufacturing Market Size, By Service, 2012�2019 ($Billion)
Table 60 Healthcare Market Size, By Solution, 2012�2019 ($Billion)
Table 61 Healthcare Market Size, By Service, 2012�2019 ($Billion)
Table 62 Other Verticals Market Size, By Solution, 2012�2019 ($Billion)
Table 63 Other Verticals Market Size, By Service, 2012�2019 ($Billion)
Table 64 Global Data Center Automation Market Size, By Region, 2012�2019 ($Billion)
Table 65 NA: Data Center Automation Market Size, By End User, 2012�2019 ($Billion)
Table 66 NA: Data Center Automation Market Size, By Country, 2012�2019 ($Billion)
Table 67 Europe: Data Center Automation Market Size, By End User, 2012�2019 ($Billion)
Table 68 Europe: Data Center Automation Market Size, By Country, 2012�2019 ($Billion)
Table 69 APAC: Data Center Automation Market Size, By End User, 2012�2019 ($Billion)
Table 70 APAC: Data Center Automation Market Size, By Country, 2012�2019 ($Billion)
Table 71 MEA: Data Center Automation Market Size, By End User, 2012�2019 ($Billion)
Table 72 MEA: Data Center Automation Market Size, By Country, 2012�2019 ($Billion)
Table 73 LA: Data Center Automation Market Size, By End User, 2012�2019 ($Billion)
Table 74 LA: Data Center Automation Market Size, By Country, 2012�2019 ($Billion)
Table 75 New Product Launches, 2011�2014
Table 76 Agreements, Collaborations, and Joint Venture, 2012�2014
Table 77 Partnerships, and Merger & Acquisitions, 2011�2014
Table 78 Expansions, 2012�2014
Table 79 Hewlett-Packard: Revenue, 2012 � 2013 ($Million)
Table 80 Hewlett-Packard: Revenue, By Segment, 2012 � 2013 ($Million)
Table 81 IBM: Revenue, 2012 � 2013 ($Million)
Table 82 IBM: Revenue, By Segment, 2012 � 2013 ($Million)
Table 83 Oracle: Revenue, 2012 � 2013 ($Million)
Table 84 Oracle: Revenue, By Segment, 2012 � 2013 ($Million)
Table 85 Dell, Inc: Revenue, 2012 � 2013 ($Million)
Table 86 Dell, Inc: Revenue, By Segment, 2012 � 2013 ($Million)
Table 87 Fujitsu: Revenue, 2012 � 2013 ($Million)
Table 88 Fujitsu: Revenue, By Geography, 2012 � 2013 ($Million)
Table 89 Brocade Communications Systems: Revenue, 2012 � 2013 ($Million)
Table 90 Brocade Communications Systems: Revenue, By Segment, 2012 � 2013 ($Million)
Table 91 Brocade Communications Systems: Revenue, By Geography, 2012 � 2013 ($Million)
Table 92 CISCO: Revenue, 2012 � 2013 ($Million)
Table 93 CISCO: Revenue, By Segment, 2012 � 2013 ($Million)
Table 94 CISCO: Revenue, By Geography, 2012 � 2013 ($Million)
Table 95 Microsoft Corp.: Revenue, 2012 � 2013 ($Million)
Table 96 CA Technologies, Inc.: Revenue, 2013 � 2014 ($Million)
Table 97 CA Technologies, Inc.: Revenue, By Segment, 2013 � 2014 ($Million)
Table 98 CA Technologies, Inc.: Revenue, By Geography, 2013 � 2014 ($Million)
List of Figures (111 Figures)
Figure 1 Research Design
Figure 2 Data Center Cooling � Parfait Chart
Figure 3 Market Size Estimation Methodology: Bottom-Up Approach
Figure 4 Market Size Estimation Methodology: top-Down Approach
Figure 5 Break Down of Primary Interviews: By Company Type, Designation, and Region
Figure 6 Global Data Center Automation Market, By Solution, 2014�2019
Figure 7 Attractive Market Opportunities in Data Center Automation
Figure 8 Storage Automation is Expected to Grow at the Fastest Rate Among the top Three Solution in the Data Center Automation Market
Figure 9 Global Data Center Automation Market Share 2014
Figure 10 Middle East and African Markets to Enter Growth Phase By 2019
Figure 11 Optimization and Automation With Fabric
Figure 12 Data Center Automation: Market Evolution
Figure 13 Data Center Automation Market Segmentation: By Solution
Figure 14 Data Center Automation Market Segmentation: By Services
Figure 15 Data Center Automation Market Segmentation: By End User
Figure 16 High Demand of Resource Pooling is Propelling the Growth of Data Center Automation Market
Figure 17 Data Center Automation Market: Drivers and Restraint
Figure 18 Value Chain Analysis (2014): Major Value is Added By Physical infrastructure Providers
Figure 19 More Than Half of the Market is Dominated By Network Automation
Figure 20 Cloud Services Providers Will Be the Lucrative User for Network Automation Throughout the forecast Period
Figure 21 NA Will Be the Lucrative Region for Network Automation Throughout the forecast Period
Figure 22 U.S. Will Be the Lucrative Country for Network Automation Throughout the forecast Period
Figure 23 U.K. Will Be the Lucrative Country for Network Automation Throughout the forecast Period
Figure 24 China Will Be the Lucrative Country for Network Automation Throughout the forecast Period
Figure 25 KSA Will Be the Lucrative Country for Network Automation Throughout the forecast Period
Figure 26 Brazil will Be the Lucrative Country for Network Automation Throughout the forecast Period
Figure 27 Colocation Services Providers Will Be the Lucrative User for Server Automation Throughout the forecast Period
Figure 28 NA Will Be the Lucrative Region for Server Automation Throughout the forecast Period
Figure 29 U.S. Will Be the Lucrative Country for Server Automation Throughout the forecast Period
Figure 30 U.K. Will Be the Lucrative Country for Server Automation Throughout the forecast Period
Figure 31 China Will Be the Lucrative Country for Server Automation Throughout the forecast Period
Figure 32 KSA Will Be the Lucrative Country for Server Automation Throughout the forecast Period
Figure 33 Brazil will Be the Lucrative Country for Server Automation Throughout the forecast Period
Figure 34 Cloud Services Providers Will Be the Lucrative User for Storage Automation Throughout the forecast Period
Figure 35 NA Will Be the Lucrative Region for Storage Automation Throughout the forecast Period
Figure 36 U.S. Will Be the Lucrative Country for Storage Automation Throughout the forecast Period
Figure 37 U.K. Will Be the Lucrative Country for Storage Automation Throughout the forecast Period
Figure 38 China Will Be the Lucrative Country for Storage Automation Throughout the forecast Period
Figure 39 KSA Will Be the Lucrative Country for Storage Automation Throughout the forecast Period
Figure 40 Brazil will Be the Lucrative Country for Storage Automation Throughout the forecast Period
Figure 41 More Than Half of the Market is Dominated By Consulting Services
Figure 42 Europe Will Be the Lucrative Region for Consulting Services Throughout the forecast Period
Figure 43 U.S. Will Be the Lucrative Country for Consulting Services Throughout the forecast Period
Figure 44 U.K. Will Be the Lucrative Country for Consulting Services Throughout the forecast Period
Figure 45 China Will Be the Lucrative Country for Consulting Services Throughout the forecast Period
Figure 46 KSA Will Be the Lucrative Country for Consulting Services Throughout the forecast Period
Figure 47 Brazil will Be the Lucrative Country for Consulting Services Throughout the forecast Period
Figure 48 Europe Will Be the Lucrative Region for Installation and Support Services Throughout the forecast Period
Figure 49 U.S. Will Be the Lucrative Country for Installation and Support Services Throughout the forecast Period
Figure 50 U.K. Will Be the Lucrative Country for Installation and Support Services Throughout the forecast Period
Figure 51 China Will Be the Lucrative Country for Installation and Support Services Throughout the forecast Period
Figure 52 KSA Will Be the Lucrative Country for Installation and Support Services Throughout the forecast Period
Figure 53 Brazil will Be the Lucrative Country for Installation and Support Services Throughout the forecast Period
Figure 54 More Than Half of the Market is Dominated By Cloud Services Provider
Figure 55 Consulting Services Will Be the Lucrative Vertical for Enterprises Throughout the forecast Period
Figure 56 IT and Telecom Will Be the Lucrative Vertical for Enterprises Throughout the forecast Period
Figure 57 Consulting Services Will Be the Lucrative Vertical for Cloud Services Providers Throughout the forecast Period
Figure 58 IT and Telecom Will Be the Lucrative Vertical for Cloud Services Providers Throughout the forecast Period
Figure 59 Consulting Services Will Be the Lucrative Vertical for Colocation Services Providers Throughout the forecast Period
Figure 60 IT and Telecom Will Be the Lucrative Vertical for Colocation Services Providers Throughout the forecast Period
Figure 61 IT and Telecom is Dominating the Data Center Automation Market
Figure 62 Network Automation Will Be the Lucrative Solution for BFSI Vertical Throughout the forecast Period
Figure 63 Consulting Services Will Be the Lucrative Service for BFSI Vertical Throughout the forecast Period
Figure 64 Network Automation Will Be the Lucrative Solution for IT and Telecom Vertical Throughout the forecast Period
Figure 65 Consulting Services Will Be the Lucrative Service for IT and Telecom Vertical Throughout the forecast Period
Figure 66 Network Automation Will Be the Lucrative Solution for Media and Entertainment Vertical Throughout the forecast Period
Figure 67 Consulting Services Will Be the Lucrative Service for Media and Entertainment Vertical Throughout the forecast Period
Figure 68 Network Automation Will Be the Lucrative Solution for Public Sector Vertical Throughout the forecast Period
Figure 69 Consulting Services Will Be the Lucrative Service for Public Sector Vertical Throughout the forecast Period
Figure 70 Network Automation Will Be the Lucrative Solution for Retail Vertical Throughout the forecast Period
Figure 71 Consulting Services Will Be the Lucrative Service for Retail Vertical Throughout the forecast Period
Figure 72 Network Automation Will Be the Lucrative Solution for Manufacturing Vertical Throughout the forecast Period
Figure 73 Consulting Services Will Be the Lucrative Service for Manufacturing Vertical Throughout the forecast Period
Figure 74 Network Automation Will Be the Lucrative Solution for Healthcare Vertical Throughout the forecast Period
Figure 75 Consulting Services Will Be the Lucrative Service for Healthcare Vertical Throughout the forecast Period
Figure 76 Network Automation Will Be the Lucrative Solution for Others Vertical Throughout the forecast Period
Figure 77 Consulting Services Will Be the Lucrative Service for Others Vertical Throughout the forecast Period
Figure 78 One-Third of the Market is Dominated By NA Region in 2014
Figure 79 Cloud Services Providers Will Be the Lucrative User for NA Region Throughout the forecast Period
Figure 80 U.S. Will Be the Lucrative Country for NA Region Throughout the forecast Period
Figure 81 Cloud Services Providers Will Be the Lucrative User for Europe Region Throughout the forecast Period
Figure 82 U.K. Will Be the Lucrative Country for Europe Region Throughout the forecast Period
Figure 83 Cloud Services Providers Will Be the Lucrative User for APAC Region Throughout the forecast Period
Figure 84 China Will Be the Lucrative Country for APAC Region Throughout the forecast Period
Figure 85 Cloud Services Providers Will Be the Lucrative User for MEA Region Throughout the forecast Period
Figure 86 KSA Will Be the Lucrative Country for MEA Region Throughout the forecast Period
Figure 87 Cloud Services Providers Will Be the Lucrative User for LA Region Throughout the forecast Period
Figure 88 Brazil Will Be the Lucrative Country for LA Region Throughout the forecast Period
Figure 89 Companies Adopted Acquisitions as the Key Growth Strategy Over the Last 4 Years
Figure 90 IBM and Oracle Grew at the Fastest Rate Between 2009 - 2013
Figure 91 Data Center Automation: Ecosystem
Figure 92 Data Center Automation: Market Opportunity Plot
Figure 93 Market Evaluation Framework- Significant Partnerships, Merger and Acquisitions Have Fueled Growth and Innovation in 2012 and 2013
Figure 94 Geographic Revenue Mix of Top 5 Market Players
Figure 95 Hewlett-Packard: Business Overview
Figure 96 Hewlett-Packard: SWOT Analysis
Figure 97 IBM: Business Overview
Figure 98 IBM: SWOT Analysis
Figure 99 Oracle: Business Overview
Figure 100 Oracle: SWOT Analysis
Figure 101 Dell, Inc.: Business Overview
Figure 102 Dell Inc: SWOT Analysis
Figure 103 Fujitsu: Business Overview
Figure 104 Fujitsu: SWOT Analysis
Figure 105 Brocade Communications Systems : Business Overview
Figure 106 Brocade Communications Systems : SWOT Analysis
Figure 107 CISCO: Business Overview
Figure 108 Microsoft Corp.: Business Overview
Figure 109 CA Technologies, Inc.: Business Overview
Figure 110 VMware, Inc.: Business Overview
Figure 111 BMC Software, Inc.: Business Overview


Growth opportunities and latent adjacency in Data Center Automation Market