Egg Processing Market by Product Type (Dried Egg Products, Liquid Egg Products, Frozen Egg Products), End-use Application (Food Processing & Manufacturing, Foodservice, Retail), Nature, and Region - Global Forecast to 2031

icon1
USD 43.90 BN
MARKET SIZE, 2031
icon2
CAGR 4.5%
(2026-2031)
icon3
330
REPORT PAGES
icon4
250
MARKET TABLES

OVERVIEW

egg-processing-equipment-market Overview

Source: Secondary Research, Interviews with Experts, MarketsandMarkets Analysis

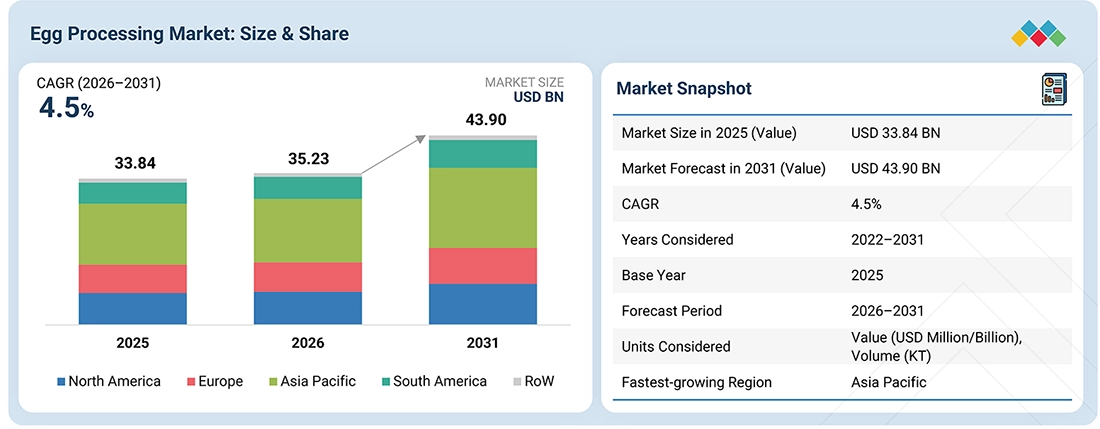
The egg processing market size is projected to grow from USD 35.23 billion in 2026 to USD 43.90 billion in 2031, at a CAGR of 4.5%. The market is driven by increasing demand for processed egg products that offer convenience, extended shelf life, consistent functionality, and ease of incorporation across food manufacturing, foodservice, and retail applications. Processed egg products are widely utilized in bakery and confectionery products, processed foods and ready meals, dietary supplements, and other food formulations due to their emulsification, foaming, binding, and coagulation properties. Growing consumption of convenience foods, increasing emphasis on food safety and quality standards, and rising demand for standardized ingredients in commercial food production are creating growth opportunities across the market. Additionally, manufacturers are expanding production capacities and investing in advanced processing technologies to improve product quality, operational efficiency, and product stability. Product innovation and advancements in egg breaking, pasteurization, drying, freezing, and packaging technologies are expected to support continued market development across diverse end-use applications.

Market Size and Forecast:

  • Market Size Value in 2025: USD 33.84 Billion
  • Market Size Value in 2026: USD 35.23 Billion
  • Revenue Forecast in 2031: USD 43.90 Billion
  • Growth Rate: CAGR of 4.5% from 2026 to 2031
  • Data available from 2022 to 2031
  • Base year: 2025
  • Forecast period: 2026–2031
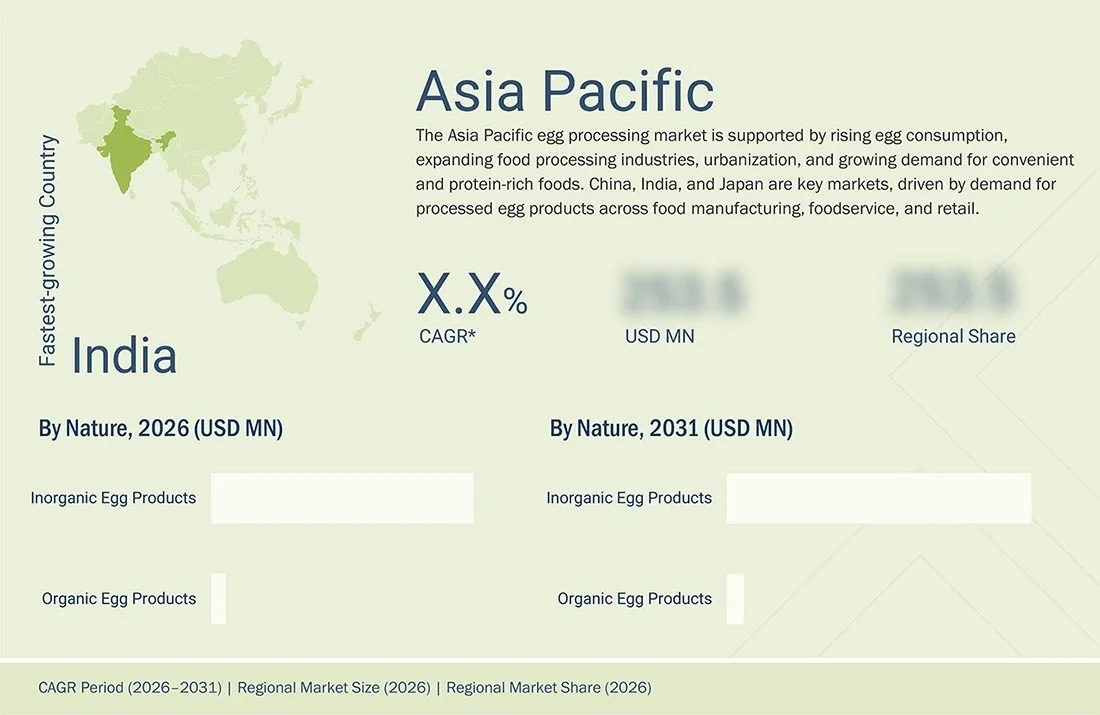
  • Asia Pacific is projected to be the largest and fastest-growing regional market, registering a CAGR of 4.8% during 2026–2031.
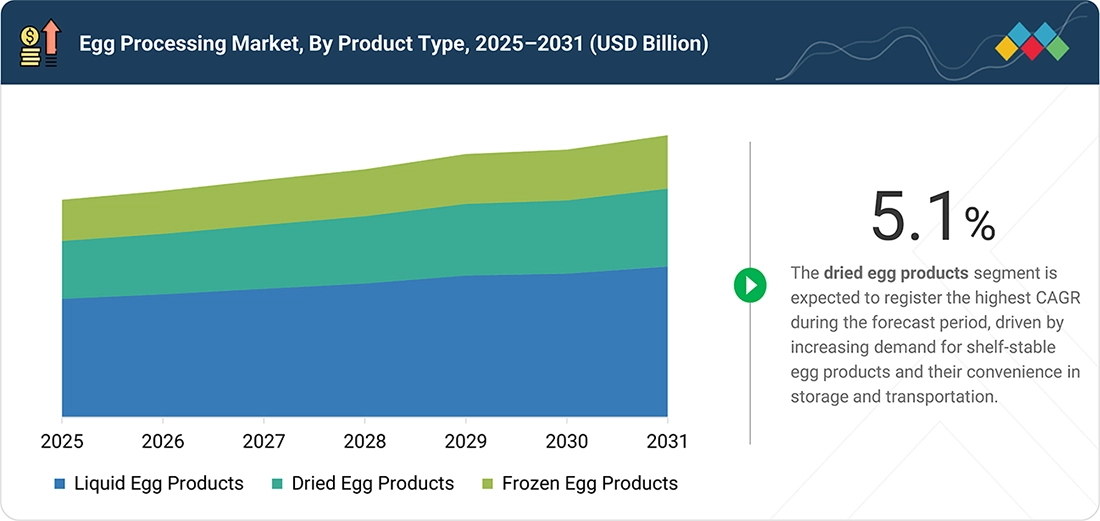
  • The dried egg products segment is projected to grow at the highest CAGR of 5.1% during the forecast period.

Key Market Trends and Insights

  • By Product Type: Dried egg products, liquid egg products, and frozen egg products are gaining traction across food manufacturing, foodservice, and retail applications due to their convenience, extended shelf life, and functional properties.
  • Growth Drivers: Increasing demand for protein-rich foods, convenience food products, and ready-to-use egg ingredients is driving market growth. The growing need for food safety, consistent product quality, and efficient large-scale food production is further supporting adoption.
  • Growing Trends: Advancements in egg processing technologies, including egg breaking, separation, pasteurization, drying, freezing, and packaging, are improving processing efficiency, product stability, and food safety. Rising demand for standardized egg ingredients in bakery, confectionery, processed foods, and ready meals is also shaping the market.
  • Growth Opportunities: Expanding foodservice operations, growing demand for shelf-stable egg products, increasing investments in processing infrastructure, and product innovation in value-added egg ingredients are creating significant opportunities for the egg processing market. The growing adoption of organic egg products and advanced processing technologies is also opening avenues for market expansion.

KEY TAKEAWAYS

  • By Product Type
    By product type, the dried egg products segment is expected to register the highest CAGR of 5.1% from 2026 to 2031.
  • By Nature
    By nature, the inorganic egg products segment held the largest share of the egg processing market in 2025, accounting for ~95% of the market.
  • By End-use Application
    By end-use application, the foodservice segment is projected to dominate the market during the forecast period.
  • By Region
    Asia Pacific is expected to be the largest and fastest-growing region in the egg processing market, registering a CAGR of 4.8% during the forecast period.
  • Competitive Landscape (Key Players)
    Cal-Maine Foods, Inc., Rose Acre Farms, and Rembrandt Foods are key players in the egg processing market due to their extensive egg processing capabilities, broad product portfolios, and established presence across multiple applications.
  • Competitive Landscape (Startups/SMEs)
    Ready Egg Products, OVOVITA, and Deb-El Food Products have established a presence among SMEs due to their focus on specialized processed egg products and customized solutions for foodservice and food manufacturing applications.

The egg processing market is driven by the growing need for safe, convenient, and value-added egg products across the food industry. Increasing production of processed and packaged foods, rising demand for ingredients that offer consistent quality and functionality, and expanding use of egg-based ingredients in commercial food applications are supporting market growth. The market also benefits from the increasing preference for products with extended shelf life and ease of handling, particularly in large-scale food production environments. Furthermore, advancements in egg processing technologies are improving product quality, operational efficiency, and production scalability, while ongoing investments in processing infrastructure and capacity expansion continue to strengthen market development across diverse end-use sectors.

TRENDS & DISRUPTIONS IMPACTING CUSTOMERS' CUSTOMERS

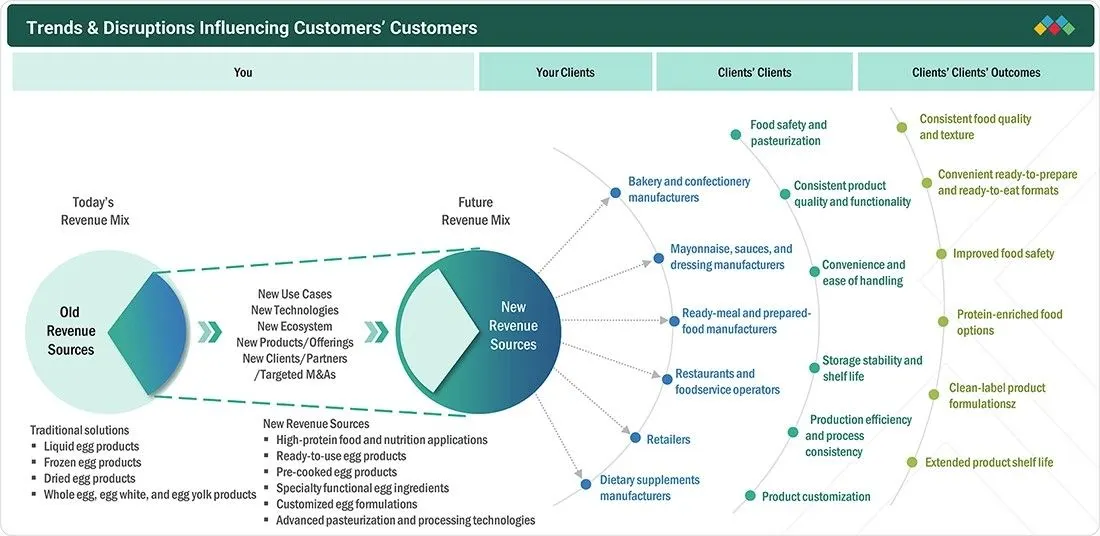
Customer business in the egg processing market is influenced by the demand for safe, convenient, functional, and easy-to-use egg products across food processing and manufacturing, foodservice, and retail applications. Traditional processed egg solutions include liquid, frozen, and dried whole egg, egg white, and egg yolk products, which are widely used for their functionality, convenience, storage benefits, and consistent performance. Demand is increasingly extending toward value-added solutions, including ready-to-use and pre-cooked egg products, specialty functional egg ingredients, customized formulations, and applications targeting high-protein food and nutrition products. Value-added formats such as pre-cooked egg patties, omelets, scrambled eggs, quiches, and hard-cooked eggs are used to simplify preparation and support consistency in foodservice and food manufacturing. These developments are influencing the revenues of egg processors, food manufacturers, foodservice operators, and retailers by supporting convenience, production efficiency, product consistency, and differentiated food formulations.

egg-processing-equipment-market Disruptions

Source: Secondary Research, Interviews with Experts, MarketsandMarkets Analysis

MARKET DYNAMICS

Drivers
Impact
Level
  • Rising health-consciousness among consumers
  • Widespread popularity of the multifunctionality of egg products
RESTRAINTS
Impact
Level
  • High costs and low consumer confidence
  • Increase in consumer demand for ethical sourcing and animal welfare practices
OPPORTUNITIES
Impact
Level
  • Egg producers’ sustainability efforts to attract eco-conscious consumers
  • Use of cutting-edge technology in egg processing
CHALLENGES
Impact
Level
  • Consumers’ misconceptions regarding risks associated with conventional and processed eggs
  • Rapid adoption of plant-based egg substitutes in diverse applications

Source: Secondary Research, Interviews with Experts, MarketsandMarkets Analysis

Driver: Rising Health-Consciousness Among Consumers

Growing consumer focus on health, wellness, and balanced nutrition is supporting demand for eggs and egg-based products as a source of high-quality protein and essential nutrients. Consumers are increasingly seeking foods that align with active lifestyles and health-conscious dietary preferences, encouraging the use of processed egg products across a range of food applications. Egg products are widely utilized in bakery and confectionery products, ready meals, dietary supplements, and other protein-focused food formulations due to their nutritional profile and functional properties. As awareness of protein intake, ingredient quality, and nutritional value continues to increase, demand for processed egg products is expected to support the growth of the egg processing market.

Restraint: High Costs and Low Consumer Confidence

The production of processed egg products involves investments in egg sourcing, pasteurization, drying, freezing, packaging, quality assurance, and cold-chain infrastructure, which can increase overall operating costs. In addition, fluctuations in feed prices, energy costs, and egg supply can affect production economics across the value chain. Consumer concerns regarding food processing, ingredient handling, and product freshness may also influence purchasing decisions in certain markets. These factors can limit the adoption of processed egg products among price-sensitive consumers and create challenges for market participants seeking to expand their customer base.

Opportunity: Egg Producers’ Sustainability Efforts to Attract Eco-Conscious Consumers

Sustainability initiatives across the egg industry are creating opportunities for growth in the egg processing market. Producers are increasingly investing in responsible sourcing practices, cage-free production systems, resource-efficiency measures, waste reduction programs, renewable energy adoption, and sustainable packaging solutions. These efforts are helping companies align with evolving consumer expectations regarding environmental responsibility and food production practices. As demand for sustainably produced food products continues to grow, egg processors have opportunities to differentiate their offerings and strengthen relationships with environmentally conscious consumers, retailers, and food manufacturers.

Challenge: Consumers’ Misconceptions Regarding Risks Associated with Conventional and Processed Eggs

Consumer misconceptions surrounding conventional and processed egg products remain a challenge for the egg processing market. Some consumers continue to associate processed egg products with reduced freshness, lower nutritional quality, or excessive processing compared with shell eggs. In addition, perceptions related to cholesterol content, production practices, and ingredient processing may influence purchasing behavior despite advancements in food safety and processing technologies. Addressing these concerns requires ongoing consumer education, transparent labeling, and effective communication regarding product quality, nutritional value, and processing standards. Failure to address such misconceptions may limit broader adoption of processed egg products across certain consumer segments.

EGG PROCESSING MARKET: COMMERCIAL USE CASES ACROSS INDUSTRIES

COMPANY USE CASE DESCRIPTION BENEFITS
company logo
McDonald’s uses liquid egg products across its breakfast menu, including pre-cooked and flash-frozen liquid eggs for folded eggs and sausage burritos. The product enables standardized egg preparation across restaurant operations while supporting convenient handling and preparation at individual locations.
company logo
Unilever Food Solutions uses pasteurized egg yolks in Knorr Professional Golden Salted Egg Powder, a ready-to-use powdered egg product for professional kitchens. The powder is used in applications including fried chicken and seafood, pasta, noodles, stir-fries, sauces, dips, fries, chips, and popcorn. The product provides one-step preparation, consistent taste and quality, and reduced preparation time compared with preparing salted eggs from scratch, and it has a 9-month shelf life.
company logo
NOW Foods uses pasteurized egg white powder in its Egg White Protein Unflavored Powder, a protein supplement containing 19.8 g of egg white powder and 15 g of protein per 20-g serving. The product provides a convenient egg-derived protein format for protein supplementation and sports nutrition, and the powder can also be reconstituted for use as an egg-white replacement in recipes.

Logos and trademarks shown above are the property of their respective owners. Their use here is for informational and illustrative purposes only.

MARKET ECOSYSTEM

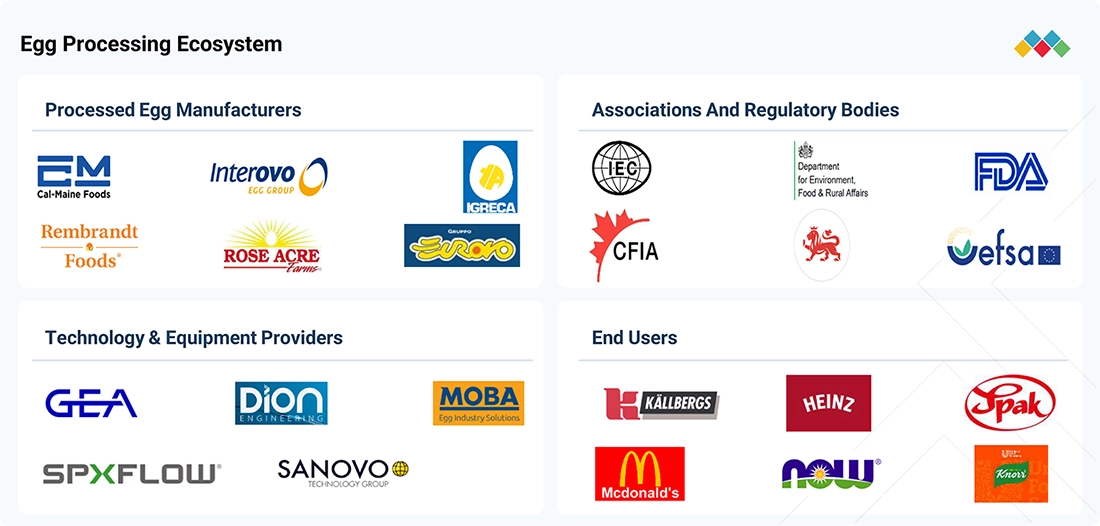
The egg processing ecosystem comprises processed egg manufacturers, technology and equipment providers, associations and regulatory bodies, and downstream end users. Processed egg manufacturers supply liquid, frozen, and dried egg products, including whole egg, egg white, and egg yolk products, for use across food manufacturing and foodservice applications. Technology and equipment providers support egg breaking and separation, pasteurization, processing, freezing, drying, and packaging. Associations and regulatory bodies support industry coordination, food safety, standards, scientific guidance, and regulatory compliance, while end users incorporate processed egg products into applications such as bakery and confectionery, sauces and dressings, prepared foods, dietary supplements, and foodservice products.

egg-processing-equipment-market Ecosystem

Logos and trademarks shown above are the property of their respective owners. Their use here is for informational and illustrative purposes only.

MARKET SEGMENTS

egg-processing-equipment-market Segments

Source: Secondary Research, Interviews with Experts, MarketsandMarkets Analysis

Egg Processing Market, By Product Type

Liquid egg products are expected to account for the largest share of the egg processing market by product type, supported by their widespread use across food manufacturing, foodservice, and retail applications. Liquid egg products offer convenience, consistency, and ease of handling while eliminating the need for egg breaking and reducing preparation time in commercial food production. They are widely incorporated into bakery and confectionery products, sauces, dressings, ready meals, and other food formulations due to their functional properties, including emulsification, foaming, binding, and coagulation. Demand is further supported by their suitability for large-scale processing operations, food safety advantages associated with pasteurization, and compatibility with automated production systems. In addition, the growing consumption of convenience foods and the expansion of foodservice establishments are contributing to increased adoption of liquid egg products. Their ability to provide operational efficiency and consistent product performance is expected to support their leading position in the egg processing market.

Egg Processing Market, By Nature

Inorganic egg products are expected to dominate the egg processing market, supported by their widespread availability, established supply chains, and extensive use across commercial food production. Inorganic egg products are commonly utilized by food manufacturers, foodservice operators, and retail-focused food producers due to their consistent supply, cost-effectiveness, and suitability for large-scale processing operations. These products are incorporated into a wide range of food formulations where functionality, product consistency, and production efficiency are important considerations. Demand is further supported by the well-developed conventional egg production industry, which enables processors to secure reliable raw material supplies and maintain competitive pricing. While interest in organic egg products continues to increase, the broader availability and lower production costs associated with inorganic egg products are expected to support their dominant position in the egg processing market during the forecast period.

Egg Processing Market, By End-use Application

The foodservice segment is expected to account for the largest share of the egg processing market, supported by the extensive use of processed egg products in restaurants, hotels, catering services, quick-service restaurants, bakeries, and institutional foodservice operations. Processed egg products help foodservice operators improve operational efficiency by reducing preparation time, minimizing product waste, and ensuring consistent quality across high-volume food preparation environments. Their convenience, food safety advantages, and compatibility with large-scale kitchen operations make them a preferred ingredient for a wide range of menu offerings. Demand is further supported by the continued expansion of organized foodservice establishments and increasing consumer consumption of breakfast foods, bakery products, and ready-to-eat meals. The ability of processed egg products to deliver consistency, convenience, and reliable supply is expected to support the leading position of the foodservice segment in the egg processing market.

REGION

Asia Pacific is expected to exhibit the highest CAGR in the Egg Processing Market during the forecast period

The Asia Pacific region is estimated to dominate the egg processing market during the forecast period. The significant market share is primarily attributed to the region's large egg production base, expanding food processing industry, rising consumption of packaged and convenience foods, and increasing demand for processed egg products across food manufacturing and foodservice applications. Countries such as China, India, Japan, South Korea, and Australia are witnessing growing utilization of processed egg products as manufacturers seek ingredients that offer consistent quality, functionality, and food safety compliance. The region also benefits from increasing urbanization, changing dietary preferences, and the growing presence of domestic and international food manufacturers. Additionally, ongoing investments in egg processing infrastructure, production capacity expansion, and advanced processing technologies are further strengthening the region's position in the global egg processing market.

egg-processing-equipment-market Region

EGG PROCESSING MARKET: COMPANY EVALUATION MATRIX

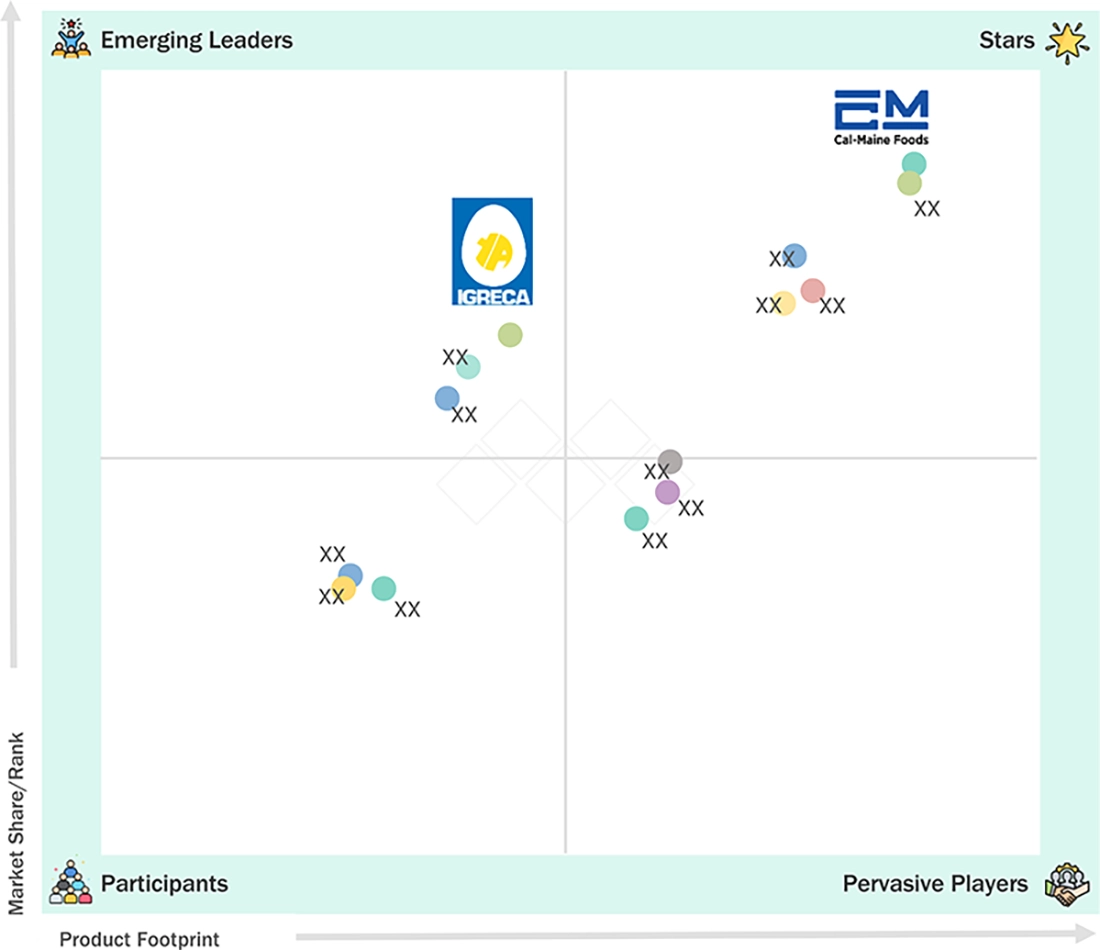
In the egg processing market matrix, Cal-Maine Foods, Inc. (Star) holds a strong position supported by its extensive egg production and processing capabilities, broad portfolio of shell eggs and value-added egg products, and established presence across retail, foodservice, and food manufacturing markets. IGRECA (Emerging Leader) has established a strong position through its specialized portfolio of liquid, frozen, and dried egg products, serving a wide range of food industry applications across Europe and international markets. While Cal-Maine Foods, Inc. benefits from a broader market presence and larger production scale, IGRECA is strengthening its position through its focus on processed egg products, application-specific solutions, and expertise in egg ingredient manufacturing for industrial food customers.

egg-processing-equipment-market Evaluation Metrics

Source: Secondary Research, Interviews with Experts, MarketsandMarkets Analysis

KEY MARKET PLAYERS

MARKET SCOPE

REPORT METRIC DETAILS
Market Size in 2025 (Value) USD 33.84 billion
Market Forecast in 2026 (Value) USD 35.23 billion
Market Forecast in 2031 (Value) USD 43.90 billion
Growth Rate CAGR of 4.5% from 2026–2031
Years Considered 2022–2031
Base Year 2025
Forecast Period 2026–2031
Units Considered Value (USD Million/Billion), Volume (KT)
Report Coverage Revenue forecast, company ranking, competitive landscape, growth factors, and trends
Segments Covered
  • By Product Type:
    • Dried Egg Products
    • Liquid Egg Products
    • Frozen Egg Products
  • By Nature:
    • Organic Egg Products
    • Inorganic Egg Products
  • By End-use Application:
    • Food Processing and Manufacturing (Processed Foods and Ready Meals
    • Bakery and Confectionery
    • Dietary Supplements
    • Others)
    • Foodservice
    • Retail
Regions Covered North America, Asia Pacific, Europe, South America, Rest of the World (RoW)

WHAT IS IN IT FOR YOU: EGG PROCESSING MARKET REPORT CONTENT GUIDE

egg-processing-equipment-market Content Guide

DELIVERED CUSTOMIZATIONS

We have successfully delivered the following deep-dive customizations:

CLIENT REQUEST CUSTOMIZATION DELIVERED VALUE ADDS
Asia Pacific Egg Processing Market Opportunity Assessment
  • Evaluated demand across China, India, Japan, South Korea, Australia and New Zealand, and other Asian countries
  • Analyzed egg production trends, food processing industry growth, consumption patterns, and competitive landscape
  • Identified high-growth countries and investment hotspots
  • Provided insights into regional expansion strategies, processing infrastructure requirements, and customer demand trends
Egg Processor Evaluating Expansion into Organic Egg Products
  • Assessed organic egg product demand across North America, Europe, and Asia Pacific
  • Evaluated consumer preferences, pricing premiums, certification requirements, and competitive landscape
  • Analyzed investment attractiveness by region
  • Identified high-growth markets for organic egg products
  • Estimated premiumization opportunities and market-entry risks
  • Supported capacity expansion strategy
Processed Egg Supplier Evaluating Value-Added Product Opportunities
  • Analyzed demand for pre-cooked eggs, egg bites, protein-enriched egg products, specialty yolk ingredients, and clean-label egg solutions
  • Assessed customer requirements across food manufacturing and foodservice sectors
  • Identified white-space opportunities for new product development
  • Supported innovation roadmap and portfolio diversification strategy

RECENT DEVELOPMENTS

  • May 2025: Ovobel Foods Limited announced the commencement of operations at its Koppal facility in India. The company also reported progress on expanding its production infrastructure through the acquisition of land and the planned purchase of plant and machinery related to egg powder and egg product manufacturing, strengthening its processing capabilities and supporting future capacity expansion.
  • April 2025: Eurovo S.r.l. expanded its international presence through the acquisition of Granja Pinilla in Spain and a stake in Two Chicks in the UK. The acquisitions strengthened Eurovo’s egg production and processing capabilities in Spain while expanding its footprint in the UK retail egg products market, supporting the company’s growth strategy and strengthening its position in the European egg products industry.
  • April 2025: Cal-Maine Foods, Inc. announced a definitive agreement to acquire Echo Lake Foods, Inc., a manufacturer of ready-to-eat egg products and breakfast foods serving foodservice and retail customers. The acquisition expands Cal-Maine Foods’ value-added egg product portfolio and strengthens its capabilities in prepared egg products, supporting the company’s strategy to diversify beyond shell eggs and enhance its presence in foodservice and retail markets.


Table of Contents

checkmarkExclusive indicates content/data unique to MarketsandMarkets and not available with any competitors.

TITLE
PAGE NO
1
INTRODUCTION


27
2
EXECUTIVE SUMMARY


32
3
PREMIUM INSIGHTS


37
4
MARKET OVERVIEW
Explore booming demand for multifunctional egg products amid rising health trends and processing innovations.


41
 
4.1
INTRODUCTION


4.2
MARKET DYNAMICS


4.2.1
DRIVERS


4.2.1.1
RISING HEALTH-CONSCIOUSNESS AND DEMAND FOR PROTEIN-RICH FOODS


4.2.1.2
WIDESPREAD USE OF EGG PRODUCTS DUE TO THEIR MULTIFUNCTIONALITY


4.2.1.3
INCREASING DEMAND FOR CONVENIENT AND TIME-SAVING FOOD SOLUTIONS


4.2.2
RESTRAINTS


4.2.2.1
VOLATILITY IN SHELL EGG PRICES AND RAW MATERIAL COSTS


4.2.2.2
HIGHER COSTS ASSOCIATED WITH CAGE-FREE PRODUCTION AND ANIMAL WELFARE COMPLIANCE


4.2.3
OPPORTUNITIES


4.2.3.1
INCREASING DEMAND FOR VALUE-ADDED AND SPECIALTY EGG PRODUCTS


4.2.3.2
ADOPTION OF ADVANCED AUTOMATION AND PROCESSING TECHNOLOGIES


4.2.4
CHALLENGES


4.2.4.1
MAINTAINING PRODUCT QUALITY AND FOOD SAFETY ACROSS THE SUPPLY CHAIN


4.2.4.2
MAINTAINING FUNCTIONAL PROPERTIES DURING PROCESSING


4.3
UNMET NEEDS AND WHITE SPACES


4.3.1
UNMET NEEDS IN EGG PROCESSING MARKET


4.3.2
WHITE SPACE OPPORTUNITIES


4.4
INTERCONNECTED MARKETS AND CROSS-SECTOR OPPORTUNITIES


4.4.1
INTERCONNECTED MARKETS


4.4.2
CROSS-SECTOR OPPORTUNITIES


4.5
STRATEGIC MOVES BY TIER-1/2/3 PLAYERS


4.5.1
KEY MOVES AND STRATEGIC FOCUS


5
INDUSTRY TRENDS
Navigate competitive dynamics and capitalize on rising demand in the hen egg industry.


56
 
5.1
INTRODUCTION


5.2
PORTER’S FIVE FORCES ANALYSIS


5.2.1
THREAT OF NEW ENTRANTS


5.2.2
THREAT OF SUBSTITUTES


5.2.3
BARGAINING POWER OF SUPPLIERS


5.2.4
BARGAINING POWER OF BUYERS


5.2.5
INTENSITY OF COMPETITIVE RIVALRY


5.3
MACROECONOMIC INDICATORS


5.3.1
GLOBAL HEN EGG PRODUCTION


5.3.2
INCREASE IN RETAIL & FOODSERVICE SALES


5.3.3
REAL HOUSEHOLD INCOME


5.4
VALUE CHAIN ANALYSIS


5.4.1
RESEARCH & DEVELOPMENT


5.4.2
RAW MATERIAL SOURCING


5.4.3
EGG BREAKING & SEPARATION


5.4.4
PROCESSING & MANUFACTURING


5.4.5
DISTRIBUTION


5.4.6
MARKETING & SALES


5.5
ECOSYSTEM ANALYSIS


5.5.1
DEMAND SIDE


5.5.2
SUPPLY SIDE


5.5.3
PRICING ANALYSIS


5.5.4
INDICATIVE PRICE TREND AMONG MARKET PLAYERS


5.5.5
AVERAGE SELLING PRICE TREND, BY PRODUCT TYPE


5.5.6
AVERAGE SELLING PRICE TREND, BY REGION


5.6
TRADE ANALYSIS


5.7
KEY CONFERENCES & EVENTS


5.8
TRENDS/DISRUPTIONS IMPACTING CUSTOMERS’ BUSINESSES


5.9
INVESTMENT AND FUNDING SCENARIO


5.10
CASE STUDY ANALYSIS


5.10.1
COOKADOO PROVIDES PRECISION EGG INGREDIENTS FOR COMMERCIAL BAKING


5.10.2
APPLICATION OF PROCESSED EGG PRODUCTS IN MCDONALD’S BREAKFAST MENU


5.11
IMPACT OF US TARIFF – EGG PROCESSING MARKET


5.11.1
INTRODUCTION


5.11.2
PRICE IMPACT ANALYSIS


5.11.3
IMPACT ON COUNTRY/REGION


5.11.3.1
US


5.11.3.2
EUROPE


5.11.3.3
ASIA PACIFIC


5.11.4
IMPACT ON END-USE INDUSTRIES


6
CUSTOMER LANDSCAPE AND BUYER BEHAVIOR
Unlock market profitability by addressing unmet needs and overcoming adoption barriers in buyer decisions.


78
 
6.1
INTRODUCTION


6.2
DECISION-MAKING PROCESS


6.3
BUYER STAKEHOLDERS AND BUYING EVALUATION CRITERIA


6.3.1
KEY STAKEHOLDERS IN BUYING PROCESS


6.3.2
BUYING CRITERIA


6.4
ADOPTION BARRIERS AND INTERNAL CHALLENGES


6.5
UNMET NEEDS OF VARIOUS END-USE INDUSTRIES


6.6
MARKET PROFITABILITY


7
SUSTAINABILITY AND REGULATORY LANDSCAPE
Navigate evolving regulations and sustainability demands to enhance egg processing compliance and efficiency.


85
 
7.1
INTRODUCTION


7.2
REGIONAL REGULATIONS AND COMPLIANCE


7.2.1
REGULATORY BODIES, GOVERNMENT AGENCIES, AND OTHER ORGANIZATIONS


7.2.2
INDUSTRY STANDARDS


7.2.3
LABELING REQUIREMENTS AND CLAIMS


7.2.4
ANTICIPATED REGULATORY CHANGES IN NEXT 5-10 YEARS


7.2.4.1
ENHANCED TRACEABILITY AND SUPPLY CHAIN DOCUMENTATION


7.2.4.2
STRICTER MICROBIOLOGICAL CONTROLS AND PROCESS VALIDATION


7.2.4.3
GREATER SCRUTINY OF IMPORTED EGG PRODUCTS AND FOOD-SAFETY COMPLIANCE


7.2.4.4
INCREASED REQUIREMENTS FOR LABEL AND CLAIM SUBSTANTIATION


7.3
SUSTAINABILITY INITIATIVES


7.3.1
CIRCULAR ECONOMY AND VALORIZATION OF EGG-PROCESSING BY-PRODUCTS


7.3.2
RESOURCE-EFFICIENT PROCESSING AND SANITATION OPERATIONS


7.3.3
WATER AND WASTEWATER MANAGEMENT IN EGG PROCESSING


7.4
SUSTAINABILITY IMPACT AND REGULATORY POLICY INITIATIVES


7.5
CERTIFICATIONS, LABELING, ECO-STANDARDS


8
TECHNOLOGICAL ADVANCEMENTS, AI-DRIVEN IMPACT, PATENTS, INNOVATIONS, AND FUTURE APPLICATIONS
AI-driven innovations redefine egg processing with advanced automation, nonthermal methods, and future biotech applications.


98
 
8.1
INTRODUCTION


8.2
TECHNOLOGY ANALYSIS


8.2.1
KEY TECHNOLOGIES


8.2.1.1
EGG BREAKING AND SEPARATION TECHNOLOGY


8.2.1.2
PASTEURIZATION AND LETHALITY TREATMENT TECHNOLOGIES


8.2.1.3
DRYING TECHNOLOGY


8.2.1.4
FREEZING TECHNOLOGY


8.2.2
COMPLEMENTARY TECHNOLOGIES


8.2.2.1
NON-THERMAL PROCESSING TECHNOLOGIES


8.2.2.2
MEMBRANE FILTRATION AND SEPARATION TECHNOLOGIES


8.2.2.3
ENZYMATIC MODIFICATION AND HYDROLYSIS TECHNOLOGIES


8.2.2.4
ADVANCED PACKAGING AND SHELF-LIFE EXTENSION TECHNOLOGIES


8.2.3
ADJACENT TECHNOLOGIES


8.2.3.1
AUTOMATED INSPECTION, SORTING, AND ROBOTIC HANDLING TECHNOLOGIES


8.2.3.2
DIGITAL TRACEABILITY AND PROCESS MONITORING TECHNOLOGIES


8.2.3.3
EGGSHELL AND EGG BY-PRODUCT VALORIZATION TECHNOLOGIES


8.3
TECHNOLOGY/PRODUCT ROADMAP


8.3.1
SHORT-TERM | AUTOMATION, PROCESS CONTROL & PROCESSING EFFICIENCY


8.3.2
MID-TERM | DIGITALIZATION, ADVANCED PROCESSING & FUNCTIONAL EGG INGREDIENTS


8.3.3
LONG-TERM | ADVANCED NONTHERMAL PROCESSING, INTELLIGENT MANUFACTURING & VALUE-ADDED EGG INGREDIENTS


8.4
PATENT ANALYSIS


8.4.1
LIST OF MAJOR PATENTS


8.5
FUTURE APPLICATIONS


8.5.1
PROCESSED EGG PROTEINS IN CULTURED MEAT MEDIA AND SCAFFOLD SYSTEMS


8.5.2
PROCESSED EGG PROTEINS IN 3D-BIOPRINTED BIOMATERIALS


8.5.3
EGG PROTEIN-BASED NUTRIENT DELIVERY SYSTEMS


8.6
IMPACT OF GENERATIVE AI ON EGG PROCESSING MARKET


8.6.1
INTRODUCTION


8.6.2
TOP USE CASES AND MARKET POTENTIAL


8.6.3
BEST PRACTICES IN EGG PROCESSING INDUSTRY


8.6.4
CASE STUDIES OF AI IMPLEMENTATION IN EGG PROCESSING MARKET


8.6.5
INTERCONNECTED ADJACENT ECOSYSTEM AND IMPACT ON MARKET PLAYERS


8.6.6
CLIENTS’ READINESS TO ADOPT GENERATIVE AI IN THE EGG PROCESSING MARKET


8.7
SUCCESS STORIES AND REAL-WORLD APPLICATIONS


9
EGG PROCESSING MARKET, BY NATURE
Market Size & Growth Rate Forecast Analysis to 2031 in USD Million | 6 Data Tables


113
 
9.1
INTRODUCTION


9.2
ORGANIC EGG PRODUCTS


9.2.1
SUSTAINABLE FARMING PRACTICES AND CLEAN-LABEL APPEAL ARE DRIVING ORGANIC EGG PRODUCT ADOPTION


9.3
CONVENTIONAL EGG PRODUCTS


9.3.1
CONSISTENT SUPPLY AND BROAD AVAILABILITY ARE DRIVING CONVENTIONAL EGG PRODUCT UTILIZATION


10
EGG PROCESSING MARKET, BY PRODUCT TYPE
Market Size & Growth Rate Forecast Analysis to 2031 in USD Million and Kilotons | 16 Data Tables


118
 
10.1
INTRODUCTION


10.2
DRIED EGG PRODUCTS


10.2.1
GROWING DEMAND FOR SHELF-STABLE AND EASILY TRANSPORTABLE FOOD INGREDIENTS TO DRIVE MARKET GROWTH


10.3
LIQUID EGG PRODUCTS


10.3.1
EASE OF INCORPORATION INTO FOOD PRODUCTION IS DRIVING LIQUID EGG PRODUCT ADOPTION


10.4
FROZEN EGG PRODUCTS


10.4.1
EXTENDED SHELF LIFE AND READY-TO-USE CONVENIENCE ARE DRIVING ADOPTION OF FROZEN EGG PRODUCTS


11
EGG PROCESSING MARKET, BY END USE
Market Size & Growth Rate Forecast Analysis to 2031 in USD Million | 18 Data Tables


127
 
11.1
INTRODUCTION


11.2
FOOD PROCESSING & NUTRITION APPLICATIONS


11.2.1
CONVENIENCE FOOD & READY MEALS


11.2.1.1
RISING DEMAND FOR CONVENIENT, READY-TO-USE MEALS TO EXPAND APPLICATIONS FOR PROCESSED EGG PRODUCTS


11.2.2
BAKERY & CONFECTIONERY


11.2.2.1
EXPANSION OF INDUSTRIAL BAKERY PRODUCTION AND DEMAND FOR CONSISTENT INGREDIENT INPUTS TO DRIVE ADOPTION OF PROCESSED EGG PRODUCTS


11.2.3
DIETARY SUPPLEMENTS


11.2.3.1
GROWING DEMAND FOR HIGH-QUALITY, NUTRIENT-RICH SUPPLEMENTS TO DRIVE MARKET GROWTH


11.2.4
OTHERS


11.3
FOODSERVICE


11.3.1
INCREASING DEMAND FOR CONVENIENT AND STANDARDIZED FOOD PREPARATION TO DRIVE MARKET GROWTH


11.4
RETAIL


11.4.1
GROWING PREFERENCE FOR CONVENIENT AND EASY-TO-PREPARE FOOD PRODUCTS TO DRIVE MARKET GROWTH


12
EGG PROCESSING MARKET, BY REGION
Comprehensive coverage of 9 Regions with country-level deep-dive of 17 Countries | 150 Data Tables.


139
 
12.1
INTRODUCTION


12.2
NORTH AMERICA


12.2.1
US


12.2.1.1
CONSUMER INCLINATION TOWARD PROTEIN-RICH FOODS DUE TO RISING PREVALENCE OF HEALTH DISEASES TO PROPEL MARKET GROWTH


12.2.2
CANADA


12.2.2.1
CONSUMER PREFERENCES FOR CONVENIENCE, SAFETY, AND NUTRITION TO BOOST EGG PROCESSING MARKET


12.2.3
MEXICO


12.2.3.1
GROWING FOODSERVICE INDUSTRY TO CREATE HIGH DEMAND FOR PRE-PREPARED EGG PRODUCTS, THEREBY BOOSTING MARKET


12.3
EUROPE


12.3.1
GERMANY


12.3.1.1
FREE-RANGE FARMING AND DIVERSIFICATION OF EGG PRODUCTION IN GERMANY LEADING TO GROWTH IN EGG PROCESSING MARKET


12.3.2
FRANCE


12.3.2.1
INCREASING ADOPTION OF CAGE-FREE METHODS IN RESPONSE TO CHANGING CONSUMER PREFERENCES TO FUEL MARKET GROWTH


12.3.3
UK


12.3.3.1
UK'S EGG PROCESSING MARKET TO THRIVE, DEMONSTRATING IMPRESSIVE GROWTH AND RESILIENCE


12.3.4
ITALY


12.3.4.1
INVESTMENTS IN ADVANCED PROCESSING TECHNOLOGY TO ENHANCE EFFICIENCY, SAFETY, AND PRODUCT QUALITY


12.3.5
SPAIN


12.3.5.1
STRONG DOMESTIC EGG PRODUCTION AND CONSUMPTION ARE SUPPORTING GROWTH IN SPAIN'S EGG PROCESSING MARKET


12.3.6
REST OF EUROPE


12.4
ASIA PACIFIC


12.4.1
CHINA


12.4.1.1
EXPANSION OF EGG PRODUCTION VARIETY IN CHINA TO ENHANCE GROWTH OUTLOOK FOR EGG PROCESSING MARKET


12.4.2
JAPAN


12.4.2.1
IMPACT OF IMPORT-EXPORT DYNAMICS ON JAPAN'S EGG PROCESSING MARKET TO FUEL MARKET GROWTH


12.4.3
INDIA


12.4.3.1
EGG PRODUCTION CAPACITY AND EXPORT DOMINANCE FUELING EGG PROCESSING INDUSTRY GROWTH


12.4.4
AUSTRALIA & NEW ZEALAND


12.4.4.1
SCALING OPERATIONS AND REGIONAL RESEARCH IN AUSTRALIA AND NEW ZEALAND TO PROMOTE EGG INDUSTRY


12.4.5
REST OF ASIA PACIFIC


12.5
SOUTH AMERICA


12.5.1
BRAZIL


12.5.1.1
EXPANDING EXPORTS TO OPEN UP NEW REVENUE STREAMS FOR PROCESSORS IN BRAZIL


12.5.2
ARGENTINA


12.5.2.1
CAPITALIZING ON HEALTH TRENDS: GROWING OPPORTUNITIES IN ARGENTINA’S EGG PROCESSING MARKET


12.5.3
REST OF SOUTH AMERICA


12.6
REST OF THE WORLD (ROW)


12.6.1
AFRICA


12.6.1.1
FAO TO INVEST IN SUSTAINABLE SOLUTIONS FOR RWANDA’S EGG MARKET


12.6.1.2
SOUTH AFRICA


12.6.1.3
NIGERIA


12.6.2
MIDDLE EAST


12.6.2.1
DIVERSIFYING US EGG PRODUCT EXPORTS TO MEET GROWING DEMAND IN MIDDLE EAST


12.6.2.2
UAE


12.6.2.3
SAUDI ARABIA


12.6.2.4
REST OF MIDDLE EAST


13
COMPETITIVE LANDSCAPE
Discover which strategies propel key players to dominate the egg processing market.


196
 
13.1
OVERVIEW


13.2
KEY PLAYER STRATEGIES/RIGHT TO WIN, 2021–2026


13.3
REVENUE ANALYSIS, 2023–2025


13.4
MARKET SHARE ANALYSIS, 2025


13.5
EGG PROCESSING MARKET COMPANY EVALUATION MATRIX: KEY PLAYERS, 2025


13.5.1
STARS


13.5.2
EMERGING LEADERS


13.5.3
PERVASIVE PLAYERS


13.5.4
PARTICIPANTS


13.5.5
COMPANY FOOTPRINT: KEY PLAYERS, 2025


13.5.5.1
COMPANY FOOTPRINT


13.5.5.2
REGION FOOTPRINT


13.5.5.3
PRODUCT TYPE FOOTPRINT


13.5.5.4
NATURE FOOTPRINT


13.5.5.5
END-USE APPLICATION FOOTPRINT


13.6
COMPANY EVALUATION MATRIX: STARTUPS/SMES, 2025


13.6.1
PROGRESSIVE COMPANIES


13.6.2
RESPONSIVE COMPANIES


13.6.3
DYNAMIC COMPANIES


13.6.4
STARTING BLOCKS


13.6.5
COMPETITIVE BENCHMARKING: STARTUPS/SMES, 2025


13.6.5.1
KEY STARTUPS/SMES


13.6.5.2
COMPETITIVE BENCHMARKING OF KEY STARTUPS/SMES


13.7
COMPANY VALUATION AND FINANCIAL METRICS


13.7.1
COMPANY VALUATION


13.7.2
EV/EBITDA


13.8
BRAND/PRODUCT COMPARISON


13.9
COMPETITIVE SCENARIO


13.9.1
PRODUCT LAUNCHES


13.9.2
DEALS


13.9.3
EXPANSIONS


14
COMPANY PROFILES
In-depth Company Profiles of Leading Market Players with detailed Business Overview, Product and Service Portfolio, Recent Developments, and Unique Analyst Perspective (MnM View)


219
 
14.1
KEY PLAYERS


14.1.1
CAL-MAINE FOODS, INC.


14.1.1.1
BUSINESS OVERVIEW


14.1.1.2
PRODUCTS OFFERED


14.1.1.2.1
DEALS


14.1.1.2.2
EXPANSIONS


14.1.1.3
MNM VIEW


14.1.1.3.1
RIGHT TO WIN


14.1.1.3.2
STRATEGIC CHOICES


14.1.1.3.3
WEAKNESSES AND COMPETITIVE THREATS


14.1.2
ROSE ACRE FARMS


14.1.3
IGRECA


14.1.4
OVOBEL


14.1.5
SKMEGG.COM


14.1.6
REMBRANDT FOODS


14.1.7
INTEROVO EGG GROUP BV


14.1.8
VENKY’S INDIA


14.1.9
EUROVO S.R.L.


14.1.10
OVOSTAR UNION


14.1.11
WABASH VALLEY


14.1.12
OVOBEST EIPRODUKTE GMBH & CO. KG


14.1.13
KEWPIE EGG CORPORATION


14.1.14
BOUWHUIS ENTHOVEN


14.1.15
FARM PRIDE


14.2
OTHER PLAYERS


14.2.1
READY EGG PRODUCTS


14.2.2
TAIYO KAGAKU CO., LTD.


14.2.3
OVOVITA


14.2.4
TAJ AGRO INTERNATIONAL (TAJ PHARMA GROUP)


14.2.5
MICHAEL FOODS, INC.


14.2.6
DEB EL FOOD PRODUCTS


14.2.7
DEROVO - DERIVADOS DE OVOS S.A.


14.2.8
JIANGSU TIANCHENG EGG INDUSTRY CO., LTD


14.2.9
OVOBRAND S.A.


14.2.10
VERSOVA


15
RESEARCH METHODOLOGY


277
 
15.1
RESEARCH DATA


15.1.1
SECONDARY DATA


15.1.1.1
KEY DATA FROM SECONDARY SOURCES


15.1.2
PRIMARY DATA


15.1.2.1
KEY DATA FROM PRIMARY SOURCES


15.1.2.2
KEY INDUSTRY INSIGHTS


15.1.2.3
BREAKDOWN OF PRIMARIES


15.2
MARKET SIZE ESTIMATION


15.2.1
TOP-DOWN APPROACH


15.2.2
SUPPLY-SIDE ANALYSIS


15.2.3
BOTTOM-UP APPROACH (DEMAND SIDE)


15.3
DATA TRIANGULATION


15.4
RESEARCH ASSUMPTIONS


15.5
RESEARCH LIMITATIONS AND RISK ASSESSMENT


16
ADJACENT & RELATED MARKETS


287
 
16.1
INTRODUCTION


16.2
LIMITATIONS


16.3
PROTEIN INGREDIENTS MARKET


16.3.1
MARKET DEFINITION


16.3.2
MARKET OVERVIEW


16.4
EGG REPLACERS MARKET


16.4.1
MARKET DEFINITION


16.4.2
MARKET OVERVIEW


17
APPENDIX


291
 
17.1
DISCUSSION GUIDE


17.2
KNOWLEDGESTORE: MARKETSANDMARKETS’ SUBSCRIPTION PORTAL


17.3
CUSTOMIZATION OPTIONS


17.4
RELATED REPORTS


17.5
AUTHOR DETAILS


LIST OF TABLES


TABLE 1
USD EXCHANGE RATES, 2021–2025


TABLE 2
EGG PROCESSING MARKET: PORTER’S FIVE FORCES ANALYSIS


TABLE 3
EGG PROCESSING MARKET: SUPPLY CHAIN (ECOSYSTEM)


TABLE 4
AVERAGE SELLING PRICE (ASP), BY PRODUCT TYPE, 2021–2025 (USD/KG)


TABLE 5
AVERAGE SELLING PRICE (ASP), BY REGION, 2021–2025 (USD/KG)


TABLE 6
TOP 10 EXPORTERS OF HS CODE 0408, 2021–2025 (USD MILLION)


TABLE 7
TOP 10 EXPORTERS OF HS CODE 0408, 2021–2025 (K TONS)


TABLE 8
TOP 10 IMPORTERS OF HS CODE 0408, 2021–2025 (USD MILLION)


TABLE 9
TOP 10 IMPORTERS OF HS CODE 0408, 2021–2025 (K TONS)


TABLE 10
EGG PROCESSING MARKET: DETAILED LIST OF CONFERENCES & EVENTS, 2026–2027


TABLE 11
INFLUENCE OF STAKEHOLDERS ON BUYING PROCESS, BY PRODUCT TYPE


TABLE 12
KEY BUYING CRITERIA, BY PRODUCT TYPE


TABLE 13
UNMET NEEDS IN EGG PROCESSING MARKET, BY END USER


TABLE 14
NORTH AMERICA: REGULATORY BODIES, GOVERNMENT AGENCIES, AND OTHER ORGANIZATIONS


TABLE 15
EUROPE: REGULATORY BODIES, GOVERNMENT AGENCIES, AND OTHER ORGANIZATIONS


TABLE 16
ASIA PACIFIC: REGULATORY BODIES, GOVERNMENT AGENCIES, AND OTHER ORGANIZATIONS


TABLE 17
SOUTH AMERICA: REGULATORY BODIES, GOVERNMENT AGENCIES, AND OTHER ORGANIZATIONS


TABLE 18
INTERNATIONAL: REGULATORY BODIES, GOVERNMENT AGENCIES, AND OTHER ORGANIZATIONS


TABLE 19
GLOBAL INDUSTRY STANDARDS IN EGG PROCESSING MARKET


TABLE 20
LABELING REQUIREMENTS AND CLAIMS IN EGG PROCESSING MARKET


TABLE 21
SUSTAINABILITY INITIATIVES IN EGG PROCESSING MARKET


TABLE 22
CERTIFICATIONS, LABELING, AND ECO-STANDARDS IN EGG PROCESSING MARKET


TABLE 23
LIST OF MAJOR PATENTS IN EGG PROCESSING MARKET, 2021–2026


TABLE 24
TOP USE CASES AND MARKET POTENTIAL


TABLE 25
BEST PRACTICES: COMPANIES IMPLEMENTING USE CASES


TABLE 26
EGG PROCESSING MARKET: CASE STUDIES RELATED TO GEN AI IMPLEMENTATION


TABLE 27
INTERCONNECTED ADJACENT ECOSYSTEM AND IMPACT ON MARKET PLAYERS


TABLE 28
EGG PROCESSING MARKET, BY NATURE, 2021–2025 (USD MILLION)


TABLE 29
EGG PROCESSING MARKET, BY NATURE, 2026–2031 (USD MILLION)


TABLE 30
ORGANIC EGG PRODUCTS: EGG PROCESSING MARKET, BY REGION, 2021–2025 (USD MILLION)


TABLE 31
ORGANIC EGG PRODUCTS: EGG PROCESSING MARKET, BY REGION, 2026–2031 (USD MILLION)


TABLE 32
CONVENTIONAL EGG PRODUCTS: EGG PROCESSING MARKET, BY REGION, 2021–2025 (USD MILLION)


TABLE 33
CONVENTIONAL EGG PRODUCTS: EGG PROCESSING MARKET, BY REGION, 2026–2031 (USD MILLION)


TABLE 34
EGG PROCESSING MARKET, BY PRODUCT TYPE, 2021–2025 (USD MILLION)


TABLE 35
EGG PROCESSING MARKET, BY PRODUCT TYPE, 2026–2031 (USD MILLION)


TABLE 36
EGG PROCESSING MARKET, BY PRODUCT TYPE, 2021–2025 (KT)


TABLE 37
EGG PROCESSING MARKET, BY PRODUCT TYPE, 2026–2031 (KT)


TABLE 38
DRIED EGG PRODUCTS: EGG PROCESSING MARKET, BY REGION, 2021–2025 (USD MILLION)


TABLE 39
DRIED EGG PRODUCTS: EGG PROCESSING MARKET, BY REGION, 2026–2031 (USD MILLION)


TABLE 40
DRIED EGG PRODUCTS: EGG PROCESSING MARKET, BY REGION, 2021–2025 (KT)


TABLE 41
DRIED EGG PRODUCTS: EGG PROCESSING MARKET, BY REGION, 2026–2031 (KT)


TABLE 42
LIQUID EGG PRODUCTS: EGG PROCESSING MARKET, BY REGION, 2021–2025 (USD MILLION)


TABLE 43
LIQUID EGG PRODUCTS: EGG PROCESSING MARKET, BY REGION, 2026–2031 (USD MILLION)


TABLE 44
LIQUID EGG PRODUCTS: EGG PROCESSING MARKET, BY REGION, 2021–2025 (KT)


TABLE 45
LIQUID EGG PRODUCTS: EGG PROCESSING MARKET, BY REGION, 2026–2031 (KT)


TABLE 46
FROZEN EGG PRODUCTS: EGG PROCESSING MARKET, BY REGION, 2021–2025 (USD MILLION)


TABLE 47
FROZEN EGG PRODUCTS: EGG PROCESSING MARKET, BY REGION, 2026–2031 (USD MILLION)


TABLE 48
FROZEN EGG PRODUCTS: EGG PROCESSING MARKET, BY REGION, 2021–2025 (KT)


TABLE 49
FROZEN EGG PRODUCTS: EGG PROCESSING MARKET, BY REGION, 2026–2031 (KT)


TABLE 50
EGG PROCESSING MARKET, BY END USE, 2021–2025 (USD MILLION)


TABLE 51
EGG PROCESSING MARKET, BY END USE, 2026–2031 (USD MILLION)


TABLE 52
FOOD PROCESSING & NUTRITION APPLICATIONS: EGG PROCESSING MARKET, BY REGION, 2021–2025 (USD MILLION)


TABLE 53
FOOD PROCESSING & NUTRITION APPLICATIONS: EGG PROCESSING MARKET, BY REGION, 2026–2031 (USD MILLION)


TABLE 54
EGG PROCESSING MARKET, BY FOOD PROCESSING & NUTRITION APPLICATIONS, 2021–2025 (USD MILLION)


TABLE 55
EGG PROCESSING MARKET, BY FOOD PROCESSING & NUTRITION APPLICATIONS, 2026–2031 (USD MILLION)


TABLE 56
CONVENIENCE FOOD & READY MEALS: EGG PROCESSING MARKET, BY REGION, 2021–2025 (USD MILLION)


TABLE 57
CONVENIENCE FOOD & READY MEALS: EGG PROCESSING MARKET, BY REGION, 2026–2031 (USD MILLION)


TABLE 58
BAKERY & CONFECTIONERY: EGG PROCESSING MARKET, BY REGION, 2021–2025 (USD MILLION)


TABLE 59
BAKERY & CONFECTIONERY: EGG PROCESSING MARKET, BY REGION, 2026–2031 (USD MILLION)


TABLE 60
DIETARY SUPPLEMENTS: EGG PROCESSING MARKET, BY REGION, 2021–2025 (USD MILLION)


TABLE 61
DIETARY SUPPLEMENTS: EGG PROCESSING MARKET, BY REGION, 2026–2031 (USD MILLION)


TABLE 62
OTHERS: EGG PROCESSING MARKET, BY REGION, 2021–2025 (USD MILLION)


TABLE 63
OTHERS: EGG PROCESSING MARKET, BY REGION, 2026–2031 (USD MILLION)


TABLE 64
FOODSERVICE: EGG PROCESSING MARKET, BY REGION, 2021–2025 (USD MILLION)


TABLE 65
FOODSERVICE: EGG PROCESSING MARKET, BY REGION, 2026–2031 (USD MILLION)


TABLE 66
RETAIL: EGG PROCESSING MARKET, BY REGION, 2021–2025 (USD MILLION)


TABLE 67
RETAIL: EGG PROCESSING MARKET, BY REGION, 2026–2031 (USD MILLION)


TABLE 68
EGG PROCESSING MARKET, BY REGION, 2021–2025 (USD MILLION)


TABLE 69
EGG PROCESSING MARKET, BY REGION, 2026–2031 (USD MILLION)


TABLE 70
EGG PROCESSING MARKET, BY REGION, 2021–2025 (KT)


TABLE 71
EGG PROCESSING MARKET, BY REGION, 2026–2031 (KT)


TABLE 72
NORTH AMERICA: EGG PROCESSING MARKET, BY COUNTRY, 2021–2025 (USD MILLION)


TABLE 73
NORTH AMERICA: EGG PROCESSING MARKET, BY COUNTRY, 2026–2031 (USD MILLION)


TABLE 74
NORTH AMERICA: EGG PROCESSING MARKET, BY COUNTRY, 2021–2025 (KT)


TABLE 75
NORTH AMERICA: EGG PROCESSING MARKET, BY COUNTRY, 2026–2031 (KT)


TABLE 76
NORTH AMERICA: EGG PROCESSING MARKET, BY PRODUCT TYPE, 2021–2025 (USD MILLION)


TABLE 77
NORTH AMERICA: EGG PROCESSING MARKET, BY PRODUCT TYPE, 2026–2031 (USD MILLION)


TABLE 78
NORTH AMERICA: EGG PROCESSING MARKET, BY PRODUCT TYPE, 2021–2025 (KT)


TABLE 79
NORTH AMERICA: EGG PROCESSING MARKET, BY PRODUCT TYPE, 2026–2031 (KT)


TABLE 80
NORTH AMERICA: EGG PROCESSING MARKET, BY END USE, 2021–2025 (USD MILLION)


TABLE 81
NORTH AMERICA: EGG PROCESSING MARKET, BY END USE, 2026–2031 (USD MILLION)


TABLE 82
NORTH AMERICA: EGG PROCESSING MARKET, BY FOOD PROCESSING & NUTRITION APPLICATIONS, 2021–2025 (USD MILLION)


TABLE 83
NORTH AMERICA: EGG PROCESSING MARKET, BY FOOD PROCESSING & NUTRITION APPLICATIONS, 2026–2031 (USD MILLION)


TABLE 84
NORTH AMERICA: EGG PROCESSING MARKET, BY NATURE, 2021–2025 (USD MILLION)


TABLE 85
NORTH AMERICA: EGG PROCESSING MARKET, BY NATURE, 2026–2031 (USD MILLION)


TABLE 86
US: EGG PROCESSING MARKET, BY PRODUCT TYPE, 2021–2025 (USD MILLION)


TABLE 87
US: EGG PROCESSING MARKET, BY PRODUCT TYPE, 2026–2031 (USD MILLION)


TABLE 88
US: EGG PROCESSING MARKET, BY PRODUCT TYPE, 2021–2025 (KT)


TABLE 89
US: EGG PROCESSING MARKET, BY PRODUCT TYPE, 2026–2031 (KT)


TABLE 90
CANADA: EGG PROCESSING MARKET, BY PRODUCT TYPE, 2021–2025 (USD MILLION)


TABLE 91
CANADA: EGG PROCESSING MARKET, BY PRODUCT TYPE, 2026–2031 (USD MILLION)


TABLE 92
CANADA: EGG PROCESSING MARKET, BY PRODUCT TYPE, 2021–2025 (KT)


TABLE 93
CANADA: EGG PROCESSING MARKET, BY PRODUCT TYPE, 2026–2031 (KT)


TABLE 94
MEXICO: EGG PROCESSING MARKET, BY PRODUCT TYPE, 2021–2025 (USD MILLION)


TABLE 95
MEXICO: EGG PROCESSING MARKET, BY PRODUCT TYPE, 2026–2031 (USD MILLION)


TABLE 96
MEXICO: EGG PROCESSING MARKET, BY PRODUCT TYPE, 2021–2025 (KT)


TABLE 97
MEXICO: EGG PROCESSING MARKET, BY PRODUCT TYPE, 2026–2031 (KT)


TABLE 98
EUROPE: EGG PROCESSING MARKET, BY COUNTRY, 2021–2025 (USD MILLION)


TABLE 99
EUROPE: EGG PROCESSING MARKET, BY COUNTRY, 2026–2031 (USD MILLION)


TABLE 100
EUROPE: EGG PROCESSING MARKET, BY COUNTRY, 2021–2025 (KT)


TABLE 101
EUROPE: EGG PROCESSING MARKET, BY COUNTRY, 2026–2031 (KT)


TABLE 102
EUROPE: EGG PROCESSING MARKET, BY PRODUCT TYPE, 2021–2025 (USD MILLION)


TABLE 103
EUROPE: EGG PROCESSING MARKET, BY PRODUCT TYPE, 2026–2031 (USD MILLION)


TABLE 104
EUROPE: EGG PROCESSING MARKET, BY PRODUCT TYPE, 2021–2025 (KT)


TABLE 105
EUROPE: EGG PROCESSING MARKET, BY PRODUCT TYPE, 2026–2031 (KT)


TABLE 106
EUROPE: EGG PROCESSING MARKET, BY END USE, 2021–2025 (USD MILLION)


TABLE 107
EUROPE: EGG PROCESSING MARKET, BY END USE, 2026–2031 (USD MILLION)


TABLE 108
EUROPE: EGG PROCESSING MARKET, BY FOOD PROCESSING & NUTRITION APPLICATIONS, 2021–2025 (USD MILLION)


TABLE 109
EUROPE: EGG PROCESSING MARKET, BY FOOD PROCESSING & NUTRITION APPLICATIONS, 2026–2031 (USD MILLION)


TABLE 110
EUROPE: EGG PROCESSING MARKET, BY NATURE, 2021–2025 (USD MILLION)


TABLE 111
EUROPE: EGG PROCESSING MARKET, BY NATURE, 2026–2031 (USD MILLION)


TABLE 112
GERMANY: EGG PROCESSING MARKET, BY PRODUCT TYPE, 2021–2025 (USD MILLION)


TABLE 113
GERMANY: EGG PROCESSING MARKET, BY PRODUCT TYPE, 2026–2031 (USD MILLION)


TABLE 114
GERMANY: EGG PROCESSING MARKET, BY PRODUCT TYPE, 2021–2025 (KT)


TABLE 115
GERMANY: EGG PROCESSING MARKET, BY PRODUCT TYPE, 2026–2031 (KT)


TABLE 116
FRANCE: EGG PROCESSING MARKET, BY PRODUCT TYPE, 2021–2025 (USD MILLION)


TABLE 117
FRANCE: EGG PROCESSING MARKET, BY PRODUCT TYPE, 2026–2031 (USD MILLION)


TABLE 118
FRANCE: EGG PROCESSING MARKET, BY PRODUCT TYPE, 2021–2025 (KT)


TABLE 119
FRANCE: EGG PROCESSING MARKET, BY PRODUCT TYPE, 2026–2031 (KT)


TABLE 120
UK: EGG PROCESSING MARKET, BY PRODUCT TYPE, 2021–2025 (USD MILLION)


TABLE 121
UK: EGG PROCESSING MARKET, BY PRODUCT TYPE, 2026–2031 (USD MILLION)


TABLE 122
UK: EGG PROCESSING MARKET, BY PRODUCT TYPE, 2021–2025 (KT)


TABLE 123
UK: EGG PROCESSING MARKET, BY PRODUCT TYPE, 2026–2031 (KT)


TABLE 124
ITALY: EGG PROCESSING MARKET, BY PRODUCT TYPE, 2021–2025 (USD MILLION)


TABLE 125
ITALY: EGG PROCESSING MARKET, BY PRODUCT TYPE, 2026–2031 (USD MILLION)


TABLE 126
ITALY: EGG PROCESSING MARKET, BY PRODUCT TYPE, 2021–2025 (KT)


TABLE 127
ITALY: EGG PROCESSING MARKET, BY PRODUCT TYPE, 2026–2031 (KT)


TABLE 128
SPAIN: EGG PROCESSING MARKET, BY PRODUCT TYPE, 2021–2025 (USD MILLION)


TABLE 129
SPAIN: EGG PROCESSING MARKET, BY PRODUCT TYPE, 2026–2031 (USD MILLION)


TABLE 130
SPAIN: EGG PROCESSING MARKET, BY PRODUCT TYPE, 2021–2025 (KT)


TABLE 131
SPAIN: EGG PROCESSING MARKET, BY PRODUCT TYPE, 2026–2031 (KT)


TABLE 132
REST OF EUROPE: EGG PROCESSING MARKET, BY PRODUCT TYPE, 2021–2025 (USD MILLION)


TABLE 133
REST OF EUROPE: EGG PROCESSING MARKET, BY PRODUCT TYPE, 2026–2031 (USD MILLION)


TABLE 134
REST OF EUROPE: EGG PROCESSING MARKET, BY PRODUCT TYPE, 2021–2025 (KT)


TABLE 135
REST OF EUROPE: EGG PROCESSING MARKET, BY PRODUCT TYPE, 2026–2031 (KT)


TABLE 136
ASIA PACIFIC: EGG PROCESSING MARKET, BY COUNTRY, 2021–2025 (USD MILLION)


TABLE 137
ASIA PACIFIC: EGG PROCESSING MARKET, BY COUNTRY, 2026–2031 (USD MILLION)


TABLE 138
ASIA PACIFIC: EGG PROCESSING MARKET, BY COUNTRY, 2021–2025 (KT)


TABLE 139
ASIA PACIFIC: EGG PROCESSING MARKET, BY COUNTRY, 2026–2031 (KT)


TABLE 140
ASIA PACIFIC: EGG PROCESSING MARKET, BY PRODUCT TYPE, 2021–2025 (USD MILLION)


TABLE 141
ASIA PACIFIC: EGG PROCESSING MARKET, BY PRODUCT TYPE, 2026–2031 (USD MILLION)


TABLE 142
ASIA PACIFIC: EGG PROCESSING MARKET, BY PRODUCT TYPE, 2021–2025 (KT)


TABLE 143
ASIA PACIFIC: EGG PROCESSING MARKET, BY PRODUCT TYPE, 2026–2031 (KT)


TABLE 144
ASIA PACIFIC: EGG PROCESSING MARKET, BY END USE, 2021–2025 (USD MILLION)


TABLE 145
ASIA PACIFIC: EGG PROCESSING MARKET, BY END USE, 2026–2031 (USD MILLION)


TABLE 146
ASIA PACIFIC: EGG PROCESSING MARKET, BY FOOD PROCESSING & NUTRITION APPLICATIONS, 2021–2025 (USD MILLION)


TABLE 147
ASIA PACIFIC: EGG PROCESSING MARKET, BY FOOD PROCESSING & NUTRITION APPLICATIONS, 2026–2031 (USD MILLION)


TABLE 148
ASIA PACIFIC: EGG PROCESSING MARKET, BY NATURE, 2021–2025 (USD MILLION)


TABLE 149
ASIA PACIFIC: EGG PROCESSING MARKET, BY NATURE, 2026–2031 (USD MILLION)


TABLE 150
CHINA: EGG PROCESSING MARKET, BY PRODUCT TYPE, 2021–2025 (USD MILLION)


TABLE 151
CHINA: EGG PROCESSING MARKET, BY PRODUCT TYPE, 2026–2031 (USD MILLION)


TABLE 152
CHINA: EGG PROCESSING MARKET, BY PRODUCT TYPE, 2021–2025 (KT)


TABLE 153
CHINA: EGG PROCESSING MARKET, BY PRODUCT TYPE, 2026–2031 (KT)


TABLE 154
JAPAN: EGG PROCESSING MARKET, BY PRODUCT TYPE, 2021–2025 (USD MILLION)


TABLE 155
JAPAN: EGG PROCESSING MARKET, BY PRODUCT TYPE, 2026–2031 (USD MILLION)


TABLE 156
JAPAN: EGG PROCESSING MARKET, BY PRODUCT TYPE, 2021–2025 (KT)


TABLE 157
JAPAN: EGG PROCESSING MARKET, BY PRODUCT TYPE, 2026–2031 (KT)


TABLE 158
INDIA: EGG PROCESSING MARKET, BY PRODUCT TYPE, 2021–2025 (USD MILLION)


TABLE 159
INDIA: EGG PROCESSING MARKET, BY PRODUCT TYPE, 2026–2031 (USD MILLION)


TABLE 160
INDIA: EGG PROCESSING MARKET, BY PRODUCT TYPE, 2021–2025 (KT)


TABLE 161
INDIA: EGG PROCESSING MARKET, BY PRODUCT TYPE, 2026–2031 (KT)


TABLE 162
AUSTRALIA & NEW ZEALAND: EGG PROCESSING MARKET, BY PRODUCT TYPE, 2021–2025 (USD MILLION)


TABLE 163
AUSTRALIA & NEW ZEALAND: EGG PROCESSING MARKET, BY PRODUCT TYPE, 2026–2031 (USD MILLION)


TABLE 164
AUSTRALIA & NEW ZEALAND: EGG PROCESSING MARKET, BY PRODUCT TYPE, 2021–2025 (KT)


TABLE 165
AUSTRALIA & NEW ZEALAND: EGG PROCESSING MARKET, BY PRODUCT TYPE, 2026–2031 (KT)


TABLE 166
REST OF ASIA PACIFIC: EGG PROCESSING MARKET, BY PRODUCT TYPE, 2021–2025 (USD MILLION)


TABLE 167
REST OF ASIA PACIFIC: EGG PROCESSING MARKET, BY PRODUCT TYPE, 2026–2031 (USD MILLION)


TABLE 168
REST OF ASIA PACIFIC: EGG PROCESSING MARKET, BY PRODUCT TYPE, 2021–2025 (KT)


TABLE 169
REST OF ASIA PACIFIC: EGG PROCESSING MARKET, BY PRODUCT TYPE, 2026–2031 (KT)


TABLE 170
SOUTH AMERICA: EGG PROCESSING MARKET, BY COUNTRY, 2021–2025 (USD MILLION)


TABLE 171
SOUTH AMERICA: EGG PROCESSING MARKET, BY COUNTRY, 2026–2031 (USD MILLION)


TABLE 172
SOUTH AMERICA: EGG PROCESSING MARKET, BY COUNTRY, 2021–2025 (KT)


TABLE 173
SOUTH AMERICA: EGG PROCESSING MARKET, BY COUNTRY, 2026–2031 (KT)


TABLE 174
SOUTH AMERICA: EGG PROCESSING MARKET, BY PRODUCT TYPE, 2021–2025 (USD MILLION)


TABLE 175
SOUTH AMERICA: EGG PROCESSING MARKET, BY PRODUCT TYPE, 2026–2031 (USD MILLION)


TABLE 176
SOUTH AMERICA: EGG PROCESSING MARKET, BY PRODUCT TYPE, 2021–2025 (KT)


TABLE 177
SOUTH AMERICA: EGG PROCESSING MARKET, BY PRODUCT TYPE, 2026–2031 (KT)


TABLE 178
SOUTH AMERICA: EGG PROCESSING MARKET, BY END USE, 2021–2025 (USD MILLION)


TABLE 179
SOUTH AMERICA: EGG PROCESSING MARKET, BY END USE, 2026–2031 (USD MILLION)


TABLE 180
SOUTH AMERICA: EGG PROCESSING MARKET, BY FOOD PROCESSING & NUTRITION APPLICATIONS, 2021–2025 (USD MILLION)


TABLE 181
SOUTH AMERICA: EGG PROCESSING MARKET, BY FOOD PROCESSING & NUTRITION APPLICATIONS, 2026–2031 (USD MILLION)


TABLE 182
SOUTH AMERICA: EGG PROCESSING MARKET, BY NATURE, 2021–2025 (USD MILLION)


TABLE 183
SOUTH AMERICA: EGG PROCESSING MARKET, BY NATURE, 2026–2031 (USD MILLION)


TABLE 184
BRAZIL: EGG PROCESSING MARKET, BY PRODUCT TYPE, 2021–2025 (USD MILLION)


TABLE 185
BRAZIL: EGG PROCESSING MARKET, BY PRODUCT TYPE, 2026–2031 (USD MILLION)


TABLE 186
BRAZIL: EGG PROCESSING MARKET, BY PRODUCT TYPE, 2021–2025 (KT)


TABLE 187
BRAZIL: EGG PROCESSING MARKET, BY PRODUCT TYPE, 2026–2031 (KT)


TABLE 188
ARGENTINA: EGG PROCESSING MARKET, BY PRODUCT TYPE, 2021–2025 (USD MILLION)


TABLE 189
ARGENTINA: EGG PROCESSING MARKET, BY PRODUCT TYPE, 2026–2031 (USD MILLION)


TABLE 190
ARGENTINA: EGG PROCESSING MARKET, BY PRODUCT TYPE, 2021–2025 (KT)


TABLE 191
ARGENTINA: EGG PROCESSING MARKET, BY PRODUCT TYPE, 2026–2031 (KT)


TABLE 192
REST OF SOUTH AMERICA: EGG PROCESSING MARKET, BY PRODUCT TYPE, 2021–2025 (USD MILLION)


TABLE 193
REST OF SOUTH AMERICA: EGG PROCESSING MARKET, BY PRODUCT TYPE, 2026–2031 (USD MILLION)


TABLE 194
REST OF SOUTH AMERICA: EGG PROCESSING MARKET, BY PRODUCT TYPE, 2021–2025 (KT)


TABLE 195
REST OF SOUTH AMERICA: EGG PROCESSING MARKET, BY PRODUCT TYPE, 2026–2031 (KT)


TABLE 196
ROW: EGG PROCESSING MARKET, BY REGION, 2021–2025 (USD MILLION)


TABLE 197
ROW: EGG PROCESSING MARKET, BY REGION, 2026–2031 (USD MILLION)


TABLE 198
ROW: EGG PROCESSING MARKET, BY REGION, 2021–2025 (KT)


TABLE 199
ROW: EGG PROCESSING MARKET, BY REGION, 2026–2031 (KT)


TABLE 200
ROW: EGG PROCESSING MARKET, BY PRODUCT TYPE, 2021–2025 (USD MILLION)


TABLE 201
ROW: EGG PROCESSING MARKET, BY PRODUCT TYPE, 2026–2031 (USD MILLION)


TABLE 202
ROW: EGG PROCESSING MARKET, BY PRODUCT TYPE, 2021–2025 (KT)


TABLE 203
ROW: EGG PROCESSING MARKET, BY PRODUCT TYPE, 2026–2031 (KT)


TABLE 204
ROW: EGG PROCESSING MARKET, BY END USE, 2021–2025 (USD MILLION)


TABLE 205
ROW: EGG PROCESSING MARKET, BY END USE, 2026–2031 (USD MILLION)


TABLE 206
ROW: EGG PROCESSING MARKET, BY FOOD PROCESSING & NUTRITION APPLICATIONS, 2021–2025 (USD MILLION)


TABLE 207
ROW: EGG PROCESSING MARKET, BY FOOD PROCESSING & NUTRITION APPLICATIONS, 2026–2031 (USD MILLION)


TABLE 208
ROW: EGG PROCESSING MARKET, BY NATURE, 2021–2025 (USD MILLION)


TABLE 209
ROW: EGG PROCESSING MARKET, BY NATURE, 2026–2031 (USD MILLION)


TABLE 210
AFRICA: EGG PROCESSING MARKET, BY PRODUCT TYPE, 2021–2025 (USD MILLION)


TABLE 211
AFRICA: EGG PROCESSING MARKET, BY PRODUCT TYPE, 2026–2031 (USD MILLION)


TABLE 212
AFRICA: EGG PROCESSING MARKET, BY PRODUCT TYPE, 2021–2025 (KT)


TABLE 213
AFRICA: EGG PROCESSING MARKET, BY PRODUCT TYPE, 2026–2031 (KT)


TABLE 214
MIDDLE EAST: EGG PROCESSING MARKET, BY PRODUCT TYPE, 2021–2025 (USD MILLION)


TABLE 215
MIDDLE EAST: EGG PROCESSING MARKET, BY PRODUCT TYPE, 2026–2031 (USD MILLION)


TABLE 216
MIDDLE EAST: EGG PROCESSING MARKET, BY PRODUCT TYPE, 2021–2025 (KT)


TABLE 217
MIDDLE EAST: EGG PROCESSING MARKET, BY PRODUCT TYPE, 2026–2031 (KT)


TABLE 218
COMPETITIVE STRATEGIES INITIATIVES: EGG PROCESSING MARKET


TABLE 219
EGG PROCESSING MARKET: DEGREE OF COMPETITION


TABLE 220
EGG PROCESSING MARKET: REGION FOOTPRINT


TABLE 221
EGG PROCESSING MARKET: PRODUCT TYPE FOOTPRINT


TABLE 222
EGG PROCESSING MARKET: NATURE FOOTPRINT


TABLE 223
EGG PROCESSING MARKET: END USE FOOTPRINT


TABLE 224
EGG PROCESSING MARKET: KEY STARTUPS/SMES


TABLE 225
EGG PROCESSING MARKET: COMPETITIVE BENCHMARKING OF KEY STARTUPS/SMES, 2025


TABLE 226
EGG PROCESSING MARKET: PRODUCT LAUNCHES, 2021–AUGUST 2026


TABLE 227
EGG PROCESSING MARKET: DEALS, 2021–AUGUST 2026


TABLE 228
EGG PROCESSING MARKET: EXPANSIONS, 2021–AUGUST 2026


TABLE 229
CAL-MAINE FOODS, INC.: COMPANY OVERVIEW


TABLE 230
CAL-MAINE FOODS, INC.: PRODUCTS OFFERED


TABLE 231
CAL-MAINE FOODS, INC.: DEALS


TABLE 232
CAL-MAINE FOODS, INC.: EXPANSIONS


TABLE 233
ROSE ACRE FARMS: COMPANY OVERVIEW


TABLE 234
ROSE ACRE FARMS: PRODUCTS OFFERED


TABLE 235
ROSE ACRE FARMS: EXPANSIONS


TABLE 236
IGRECA: COMPANY OVERVIEW


TABLE 237
IGRECA: PRODUCTS OFFERED


TABLE 238
IGRECA: DEALS


TABLE 239
OVOBEL: COMPANY OVERVIEW


TABLE 240
OVOBEL: PRODUCTS OFFERED


TABLE 241
OVOBEL: DEALS


TABLE 242
SKMEGG.COM: COMPANY OVERVIEW


TABLE 243
SKMEGG.COM: PRODUCTS OFFERED


TABLE 244
SKMEGG.COM: EXPANSIONS


TABLE 245
REMBRANDT FOODS: COMPANY OVERVIEW


TABLE 246
REMBRANDT FOODS: PRODUCTS OFFERED


TABLE 247
REMBRANDT FOODS: DEALS


TABLE 248
INTEROVO EGG GROUP BV: COMPANY OVERVIEW


TABLE 249
INTEROVO EGG GROUP BV: PRODUCTS OFFERED


TABLE 250
INTEROVO EGG GROUP BV: DEALS


TABLE 251
VENKY’S INDIA: COMPANY OVERVIEW


TABLE 252
VENKY’S INDIA: PRODUCTS OFFERED


TABLE 253
EUROVO S.R.L.: COMPANY OVERVIEW


TABLE 254
EUROVO S.R.L.: PRODUCTS OFFERED


TABLE 255
EUROVO S.R.L.: PRODUCT LAUNCHES


TABLE 256
EUROVO S.R.L.: DEALS


TABLE 257
OVOSTAR UNION: COMPANY OVERVIEW


TABLE 258
OVOSTAR UNION: PRODUCTS OFFERED


TABLE 259
OVOSTAR UNION: PRODUCT LAUNCHES


TABLE 260
WABASH VALLEY: COMPANY OVERVIEW


TABLE 261
WABASH VALLEY: PRODUCTS OFFERED


TABLE 262
WABASH VALLEY: DEALS


TABLE 263
OVOBEST EIPRODUKTE GMBH & CO. KG: COMPANY OVERVIEW


TABLE 264
OVOBEST EIPRODUKTE GMBH & CO. KG: PRODUCTS OFFERED


TABLE 265
KEWPIE EGG CORPORATION: COMPANY OVERVIEW


TABLE 266
KEWPIE EGG CORPORATION: PRODUCTS OFFERED


TABLE 267
KEWPIE EGG CORPORATION: DEALS


TABLE 268
BOUWHUIS ENTHOVEN: COMPANY OVERVIEW


TABLE 269
BOUWHUIS ENTHOVEN: PRODUCTS OFFERED


TABLE 270
BOUWHUIS ENTHOVEN: DEALS


TABLE 271
FARM PRIDE: COMPANY OVERVIEW


TABLE 272
FARM PRIDE: PRODUCTS OFFERED


TABLE 273
FARM PRIDE: DEALS


TABLE 274
FARM PRIDE: EXPANSIONS


TABLE 275
READY EGG PRODUCTS: COMPANY OVERVIEW


TABLE 276
TAIYO KAGAKU CO., LTD.: COMPANY OVERVIEW


TABLE 277
OVOVITA: COMPANY OVERVIEW


TABLE 278
TAJ AGRO INTERNATIONAL (TAJ PHARMA GROUP): COMPANY OVERVIEW


TABLE 279
MICHAEL FOODS, INC.: COMPANY OVERVIEW


TABLE 280
DEB EL FOOD PRODUCTS: COMPANY OVERVIEW


TABLE 281
DEROVO - DERIVADOS DE OVOS S.A.: COMPANY OVERVIEW


TABLE 282
JIANGSU TIANCHENG EGG INDUSTRY CO., LTD: COMPANY OVERVIEW


TABLE 283
OVOBRAND S.A.: COMPANY OVERVIEW


TABLE 284
VERSOVA: COMPANY OVERVIEW


TABLE 285
ADJACENT MARKETS TO EGG PROCESSING MARKET


TABLE 286
PROTEIN INGREDIENTS MARKET, BY REGION, 2022–2025 (USD MILLION)


TABLE 287
PROTEIN INGREDIENTS MARKET, BY REGION, 2026–2031 (USD MILLION)


TABLE 288
PROTEIN INGREDIENTS MARKET, BY REGION, 2022–2025 (KT)


TABLE 289
PROTEIN INGREDIENTS MARKET, BY REGION, 2026–2031 (KT)


TABLE 290
EGG REPLACERS MARKET, BY REGION, 2019–2023 (USD MILLION)


TABLE 291
EGG REPLACERS MARKET, BY REGION, 2024–2029 (USD MILLION)


LIST OF FIGURES


FIGURE 1
MARKET SEGMENTATION


FIGURE 2
MARKET SCENARIO


FIGURE 3
EGG PROCESSING MARKET, 2021–2031


FIGURE 4
MAJOR STRATEGIES ADOPTED BY KEY PLAYERS IN EGG PROCESSING MARKET, 2022–JUNE 2026


FIGURE 5
DISRUPTIONS INFLUENCING GROWTH OF EGG PROCESSING MARKET


FIGURE 6
EGG PROCESSING MARKET: HIGH-GROWTH SEGMENTS, 2026–2031


FIGURE 7
ASIA PACIFIC TO REGISTER HIGHEST CAGR DURING FORECAST PERIOD


FIGURE 8
RISING DEMAND FOR SHELF-STABLE AND VALUE-ADDED EGG PRODUCTS TO DRIVE MARKET GROWTH


FIGURE 9
LIQUID EGG PRODUCTS SEGMENT AND ASIA PACIFIC TO ACCOUNT FOR LARGEST MARKET SHARES IN 2026


FIGURE 10
LIQUID EGG PRODUCTS SEGMENT TO LEAD MARKET IN 2026


FIGURE 11
CONVENTIONAL EGG PRODUCTS SEGMENT TO ACCOUNT FOR LARGEST MARKET SHARE IN 2026


FIGURE 12
FOODSERVICE SEGMENT TO DOMINATE MARKET IN 2026


FIGURE 13
CHINA TO ACCOUNT FOR LARGEST MARKET SHARE IN 2026


FIGURE 14
EGG PROCESSING MARKET: DRIVERS, RESTRAINTS, OPPORTUNITIES, AND CHALLENGES


FIGURE 15
EGG PROCESSING MARKET: PORTER’S FIVE FORCES ANALYSIS


FIGURE 16
GLOBAL PRODUCTION OF HEN EGGS IN SHELL, FRESH, 2020-2024


FIGURE 17
RETAIL AND FOOD SERVICES SALES IN US, 2016–2025 (USD BILLION)


FIGURE 18
REAL HOUSEHOLD INCOME PER CAPITA GROWTH IN OECD, Q1 2023–Q2 2025 (%)


FIGURE 19
VALUE CHAIN ANALYSIS: EGG PROCESSING MARKET


FIGURE 20
EGG PROCESSING MARKET: MARKET MAP


FIGURE 21
AVERAGE SELLING PRICE TREND, BY PRODUCT TYPE (USD/KG)


FIGURE 22
AVERAGE SELLING PRICE TREND, BY REGION (USD/KG)


FIGURE 23
EXPORT VALUE OF HS CODE 0408, BY KEY COUNTRY, 2021–2025 (USD MILLION)


FIGURE 24
IMPORT VALUE OF HS CODE 0408, BY KEY COUNTRY, 2021–2025 (USD MILLION)


FIGURE 25
TRENDS/DISRUPTIONS IMPACTING CUSTOMERS’ BUSINESS


FIGURE 26
INVESTMENT AND FUNDING SCENARIO, 2021–2026 (USD MILLION)


FIGURE 27
INFLUENCE OF STAKEHOLDERS ON BUYING PROCESS, BY PRODUCT TYPE


FIGURE 28
KEY BUYING CRITERIA FOR PRODUCT TYPES


FIGURE 29
ADOPTION BARRIERS AND INTERNAL CHALLENGES


FIGURE 30
NUMBER OF PATENTS GRANTED FOR EGG PROCESSING MARKET, 2016–2026


FIGURE 31
REGIONAL ANALYSIS OF PATENTS GRANTED FOR EGG PROCESSING MARKET, 2016–2026


FIGURE 32
FUTURE APPLICATIONS


FIGURE 33
EGG PROCESSING MARKET, BY NATURE, 2026 VS. 2031 (USD MILLION)


FIGURE 34
EGG PROCESSING MARKET, BY PRODUCT TYPE, 2026 VS. 2031 (USD MILLION)


FIGURE 35
EGG PROCESSING MARKET, BY END USE, 2026 VS. 2031 (USD MILLION)


FIGURE 36
INDIA TO BE FASTEST-GROWING COUNTRY IN EGG PROCESSING MARKET


FIGURE 37
NORTH AMERICA: EGG PROCESSING MARKET SNAPSHOT


FIGURE 38
ASIA PACIFIC: EGG PROCESSING MARKET SNAPSHOT


FIGURE 39
AUSTRALIA: EGG CONSUMPTION PER CAPITA, PER PERSON, 2018–2023


FIGURE 40
EGG PROCESSING MARKET: REVENUE ANALYSIS FOR FIVE KEY PLAYERS, 2023–2025 (USD BILLION)


FIGURE 41
SHARE OF LEADING COMPANIES IN EGG PROCESSING MARKET, 2025


FIGURE 42
EGG PROCESSING MARKET: COMPANY EVALUATION MATRIX (KEY PLAYERS), 2025


FIGURE 43
EGG PROCESSING MARKET: COMPANY FOOTPRINT


FIGURE 44
EGG PROCESSING MARKET: COMPANY EVALUATION MATRIX (STARTUPS/SMES), 2025


FIGURE 45
COMPANY VALUATION OF EGG PROCESSING PLAYERS


FIGURE 46
EV/EBITDA OF KEY COMPANIES


FIGURE 47
BRAND/PRODUCT COMPARISON


FIGURE 48
CAL-MAINE FOODS, INC.: COMPANY SNAPSHOT


FIGURE 49
OVOBEL: COMPANY SNAPSHOT


FIGURE 50
SKMEGG.COM: COMPANY SNAPSHOT


FIGURE 51
VENKY’S INDIA: COMPANY SNAPSHOT


FIGURE 52
FARM PRIDE: COMPANY SNAPSHOT


FIGURE 53
EGG PROCESSING MARKET: RESEARCH DESIGN


FIGURE 54
KEY DATA FROM SECONDARY SOURCES


FIGURE 55
KEY DATA FROM PRIMARY SOURCES


FIGURE 56
INSIGHTS FROM INDUSTRY EXPERTS


FIGURE 57
BREAKDOWN OF PRIMARIES, BY COMPANY TYPE, DESIGNATION, AND REGION


FIGURE 58
MARKET SIZE ESTIMATION METHODOLOGY: TOP-DOWN APPROACH


FIGURE 59
SUPPLY-SIDE ANALYSIS: SOURCES OF INFORMATION AT EVERY STEP


FIGURE 60
EGG PROCESSING MARKET SIZE ESTIMATION: BOTTOM-UP APPROACH


FIGURE 61
DATA TRIANGULATION


Methodology

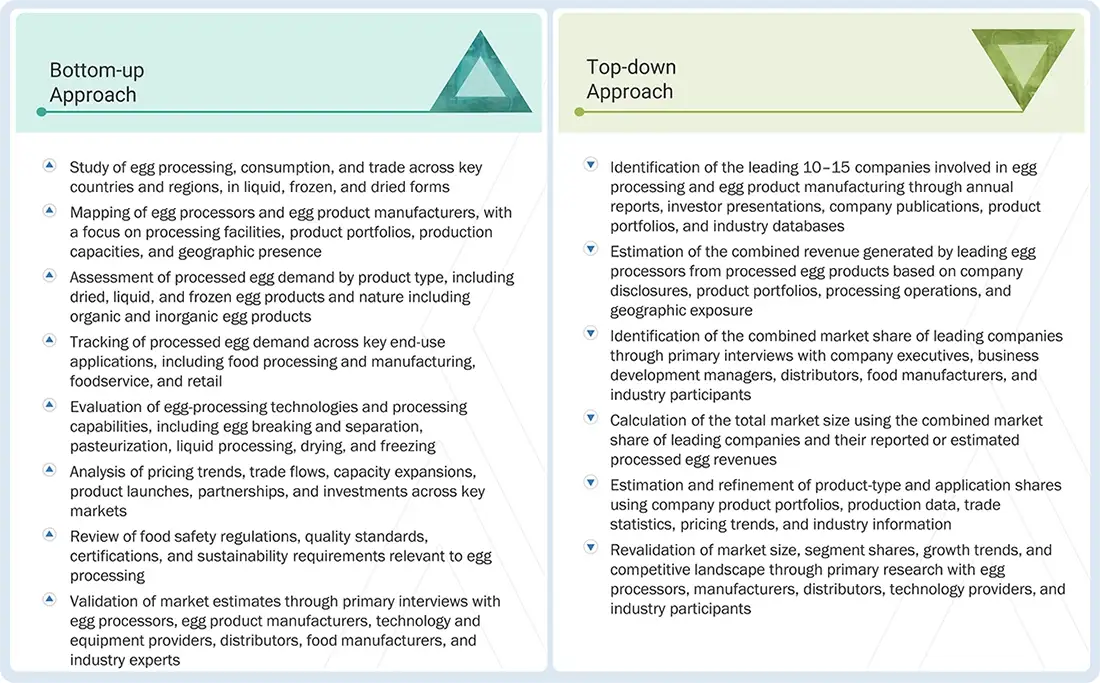
This study employed two primary approaches to estimate the current size of the egg processing market. Exhaustive secondary research was carried out to collect information on product type, nature, end-use application, and regions for the market. The next step involved validating these findings, assumptions, and sizing with industry experts across the value chain through primary research. The top-down and bottom-up approaches were employed to estimate the complete market size. Thereafter, data triangulation was used to estimate the market size of segments and subsegments.

Secondary Research

This research study used extensive secondary sources—directories and databases such as Bloomberg Businessweek and Factiva—to identify and collect information for a technical, market-oriented, and commercial market study. In the secondary research process, sources such as annual reports, press releases and investor presentations of companies, white papers, egg processing-related journals, certified publications, articles from recognized authors, directories, and databases were consulted to identify and collect information. Secondary research was mainly used to obtain key information about the industry’s supply chain, the pool of key players, and market classification and segmentation based on the industry trends to the bottom-most level, regional markets, and key developments from market- and technology-oriented perspectives.

Primary Research

Extensive primary research was conducted after assessing the egg processing market scenario through secondary research. Several primary interviews were conducted with market experts from the demand and supply sides. Primary data was collected through questionnaires, emails, and telephone interviews. The primary sources from the supply side included various industry experts, such as C-level executives (CXOs); vice presidents (VPs); directors from business development, marketing, and research and development (R&D) teams; and related key executives from distributors and key opinion leaders.

Primary interviews were conducted to gather insights, including market statistics, revenue data from products and services, market breakdowns, market size estimations, market forecasting, and data triangulation. Primary research helped in understanding various trends related to product type, nature, end-use application, and regions.

Stakeholders from the demand side, including food processing and manufacturing companies, foodservice operators, retail food product manufacturers, bakery and confectionery producers, processed food manufacturers, and dietary supplement companies, were interviewed to understand buyers’ perspectives on egg product suppliers, purchasing trends, quality and functionality requirements, sourcing preferences, and the outlook for the egg processing market.

Breakdown of Primary Interviews

Egg Processing Market 
 Size, and Share

Notes:

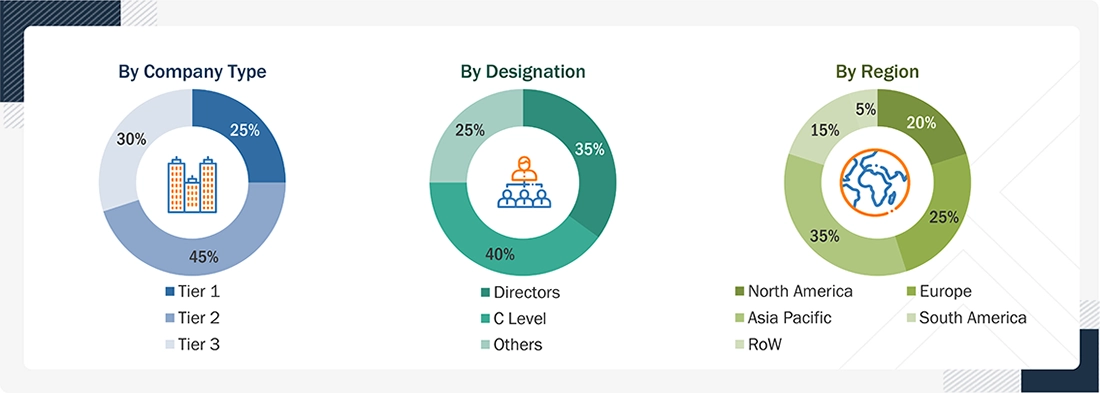
  • The three tiers of companies are defined by their total revenues in 2025, subject to the availability of financial data.
  • Tier 1: Revenue > USD 1 billion; Tier 2: USD 100 million ≤ Revenue ≤ USD 1 billion; Tier 3: Revenue < USD 100 million
  • Others include product managers, R&D managers, technical managers, production managers, procurement managers, sales and marketing managers, business development managers, application specialists, and quality assurance managers.

COMPANY

DESIGNATION

Cal-Maine Foods, Inc. (US)

Plant Manager

Kewpie Egg Corporation (Japan)

R&D Team Leader

Rose Acre Farms (US)

Production Manager

IGRECA (France)

Senior Commercial Director

Venkys India (India)

Business Development Executive

To know about the assumptions considered for the study, download the pdf brochure

Market Size Estimation

The top-down and bottom-up approaches were used to estimate and validate the total size of the egg processing market. These approaches were also used extensively to determine the size of various subsegments in the market.

The research methodology used to estimate the market size includes the following details:

  • The key players in the industry and the overall market were identified through extensive secondary research.
  • All shares, splits, and breakdowns were determined using secondary sources and verified through primary sources.
  • All possible parameters that affect the market covered in this research study were accounted for, viewed in extensive detail, verified through primary research, and analyzed to obtain final quantitative and qualitative data.
  • The research included the study of reports, reviews, and newsletters of top market players, along with extensive interviews with industry leaders, such as CEOs, directors, and marketing executives.

Egg Processing Market: Bottom-up and Top-down Approaches

Egg Processing Market Top Down and Bottom Up Approach

Data Triangulation

After determining the overall market size from the estimation process explained above, the total market was split into several segments and subsegments. The data triangulation procedure was employed, wherever applicable, to estimate the overall egg processing market and obtain precise statistics for all segments and subsegments. The data was triangulated by studying various factors and trends from the demand and supply sides. The market size was also validated using the top-down and bottom-up approaches.

Market Definition

According to the United States Department of Agriculture (USDA), egg processing refers to a series of mechanical, thermal, and chemical treatments that eggs undergo to meet specific quality, safety, and market requirements. The process involves cleaning, sorting, packaging, and sometimes cooking or pasteurizing eggs for various applications. The scope of this study focuses primarily on the market evaluation of processed eggs, including dried eggs, liquid eggs, and frozen eggs.

Key Stakeholders

  • Egg producers and suppliers
  • Egg product suppliers and manufacturers
  • Egg processing equipment manufacturers
  • Foodservice companies
  • Food safety agencies
  • Importers and exporters of egg products
  • Intermediary suppliers, such as traders and distributors of processed egg products
  • Government and research organizations
  • Associations and industry bodies
    • Food and Drug Administration (FDA)
    • European Food Safety Authority (EFSA)
    • Animal welfare organizations
    • United Egg Producers (UEP)
    • United States Department of Agriculture (USDA), Food Safety and Inspection Service (FSIS)
    • Canadian Food Inspection Agency (CFIA)
    • Environmental Protection Agency (EPA)
    • Directorate-General for Health and Food Safety (DG SANTE)
    • Occupational Safety and Health Administration (OSHA)
    • Ministry of Agriculture or Department of Animal Husbandry
    • Department of Animal Husbandry and Dairying (DAHD)
    • Food Safety and Standards Authority of India (FSSAI)
  • Certification, testing, and standards organizations
    • NSF
    • USP
    • ISO
    • Codex Alimentarius Commission
    • BRCGS
    • International Featured Standards (IFS)
    • SQF Institute (SQFI)
    • Global Food Safety Initiative (GFSI)

Report Objectives

  • To determine and project the size of the egg processing market based on product type, nature, end-use application, and region over the forecast period
  • To identify key growth opportunities by analyzing the largest and fastest-growing segments across regions  
  • To provide detailed insights into factors influencing market growth, including drivers, restraints, opportunities, and challenges
  • To evaluate market opportunities for stakeholders and present the competitive landscape of leading players
  • To analyze micro-markets with respect to individual growth trends, future potential, and their contribution to the overall market
  • To identify and profile key companies operating in the egg processing market
  • To assess the competitive environment and highlight key strategies adopted by major players across regions

Available customizations:

With the given market data, MarketsandMarkets offers customizations according to company-specific scientific needs. The following customization options are available for the report:

PRODUCT ANALYSIS

  • Product matrix, which gives a detailed comparison of the product portfolio of each company.

GEOGRAPHIC ANALYSIS

  • Further breakdown of Rest of Europe egg processing by key countries
  • Further breakdown of Rest of Asia Pacific egg processing by key countries
  • Further breakdown of Rest of South America egg processing by key countries

COMPANY INFORMATION

  • Detailed analyses and profiling of additional market players (up to five)


Key Questions Addressed by the Report

What is the global egg processing market size?

The global egg processing market is projected to grow from USD 35.23 billion in 2026 to USD 43.90 billion by 2031, registering a compound annual growth rate (CAGR) of 4.5% during the forecast period.

What are the key factors driving the growth of the egg processing market?

The egg processing market is driven by rising demand for convenient and value-added egg products, growing health consciousness, increasing consumption of processed and packaged foods, and the need for consistent ingredient quality. Advancements in egg breaking, pasteurization, drying, freezing, and packaging technologies are also supporting market growth.

Which segment is expected to grow the fastest in the egg processing market?

The dried egg products segment is expected to register the highest CAGR of 5.1% from 2026 to 2031. Demand is supported by the convenience, storage benefits, and versatility of dried egg ingredients across food manufacturing and other applications.

What are the key applications of processed egg products?

Processed egg products are used in food processing and manufacturing, foodservice, and retail. Major applications include bakery and confectionery products, processed foods, ready meals, sauces, dressings, dietary supplements, and prepared egg products.

Which region is expected to grow the fastest in the egg processing market?

Asia Pacific is expected to be the largest and fastest-growing regional market, registering a CAGR of 4.8% during the forecast period. Growth is supported by a large egg production base, an expanding food processing industry, rising consumption of convenience foods, and investments in egg processing infrastructure.

What are the key trends shaping the egg processing market?

Key trends include growing demand for ready-to-use and pre-cooked egg products, increasing adoption of advanced processing technologies, expansion of production capacities, and rising interest in specialty functional egg ingredients. Manufacturers are also focusing on customized formulations, sustainable sourcing, waste reduction, and improved packaging solutions.

What opportunities exist in the egg processing market?

Growth opportunities include investments in advanced egg processing technologies, development of value-added products, and sustainability initiatives. Manufacturers can explore opportunities in pre-cooked eggs, egg bites, protein-enriched egg products, specialty yolk ingredients, and customized solutions for food manufacturing and foodservice.

Who are the key players in the egg processing market?

Key companies operating in the egg processing market include Cal-Maine Foods, Inc., Rose Acre Farms, IGRECA, Rembrandt Foods, Ovobel, EUROVO S.r.l., Interovo Egg Group BV, Burnbrae Farms Ltd., Ovostar Union, and Kewpie Egg Corporation. These companies participate in the market through egg production, processing capabilities, and portfolios of processed egg products.

Personalize This Research

  • Triangulate with your Own Data
  • Get Data as per your Format and Definition
  • Gain a Deeper Dive on a Specific Application, Geography, Customer or Competitor
  • Any level of Personalization
Request A Free Customisation

Let Us Help You

  • What are the Known and Unknown Adjacencies Impacting the Egg Processing Market
  • What will your New Revenue Sources be?
  • Who will be your Top Customer; what will make them switch?
  • Defend your Market Share or Win Competitors
  • Get a Scorecard for Target Partners
Customized Workshop Request

Custom Market Research Services

We Will Customise The Research For You, In Case The Report Listed Above Does Not Meet With Your Requirements

Get 10% Free Customisation

TESTIMONIALS

Growth opportunities and latent adjacency in Egg Processing Market

DMCA.com Protection Status
popup img