Electronics Ceramics & Electrical Ceramics Market by Material (Alumina, Silica, Zirconia), Product (Monolithic Ceramics, Ceramic Matrix Composites), End-Use Industry (Home Appliances, Power Grids, Medical Devices), and Region - Global Forecast to 2021


[166 Pages Report] The global market size of electronics ceramics & electrical ceramics is estimated to reach USD 11.98 Billion by 2021 at a CAGR of 4.89%, in terms of value. The base year considered for the study is 2015 while the forecast period is between 2016 and 2021. The global electronics ceramics & electrical ceramics market is driven by the growing demand for light-weight, corrosion resistant, and advanced ceramic components. The report includes an analysis of the global electronics ceramics & electrical ceramics market by region, namely, Asia-Pacific, Europe, North America, the Middle East & South Africa, and South America.
Objectives of the study:
- To define, describe, and forecast the electronics ceramics & electrical ceramics market on the basis of material type, product type, end-use industry, and region
- To provide detailed information about the key factors influencing the growth of the market (drivers, restraints, opportunities, and challenges)
- To strategically analyze micromarkets1 with respect to individual growth trends, future prospects, and contribution to the total market
- To analyze the opportunities in the market for stakeholders and provide a competitive landscape for market leaders
- To strategically profile key players and comprehensively analyze their market shares and core competencies2
Note1: Micromarkets are the subsegments of the electronics ceramics & electrical ceramics market included in the report
Note2: Core competencies of companies are determined in terms of their key developments, SWOT analysis, and key strategies adopted by them to sustain in the market
Both, top-down and bottom-up approaches have been used to estimate and validate the size of the global electronics ceramics & electrical ceramics market and to estimate the size of various other dependent submarkets. The research study involved the use of extensive secondary sources, directories, and databases such as Hoovers, Bloomberg, Chemical Weekly, Factiva, Commonwealth Scientific and Industrial Research Organization (CSIRO), Securities And Exchange Commission (SEC), American National Standards Institute (ANSI), Organization for Economic Co-operation and Development (OECD), and other government and private websites to identify and collect information useful for a technical, market-oriented, and commercial study of the global electronics ceramics & electrical ceramics market.
To know about the assumptions considered for the study, download the pdf brochure
Electronics ceramics & electrical ceramics are manufactured from various raw materials such as alumina, silica, titanate, and zirconia materials. Some of the raw material suppliers are BAAN Industrial Raw Materials (Italy), AdValue Technology (U.S.), and Advanced Glass & Ceramics (U.S.). The raw materials are supplied to major manufacturers of electronics ceramics & electrical ceramics such Coors Tek, Inc. (U.S.), Ceram Tec GmbH (Germany), Kyocera Corporation (Japan), Morgan Advanced Materials (U.K.), and Murata Manufacturing Co., Ltd. (Japan). Electronics ceramics & electrical ceramics are used in various end-use industries such as home appliances, power grids, medical devices, mobile phones, and others.
Key Target Audience:
- Manufacturers of electronics ceramics & electrical ceramics
- Traders, distributors, and suppliers of electronics ceramics & electrical ceramics
- Regional manufacturers� associations and general electronics ceramics & electrical ceramics associations
- Government and regional agencies and research organizations
- Investment research firms
�This Study answers several questions for the stakeholders, primarily the market segments that they need to focus upon during the next two to five years to prioritize their efforts and investments�.
Scope of the Report:
This research report categorizes the global electronics ceramics & electrical ceramics market on the basis of material type, product type, end-use industry, and region.
On the basis of Material Type:
- Alumina ceramics
- Titanate ceramics
- Zirconia ceramics
- Silica ceramics
- Others
On the basis of Product Type:
- Monolithic ceramics
- Ceramic matrix composites
- Ceramic coatings
- Others
On the basis of End-Use Industry:
- Home appliances
- Power grids
- Medical devices
- Mobile phones
- Others
On the basis of Region:
- Asia-Pacific
- Europe
- North America
- Middle East & Africa
- South America
The market is further analyzed for key countries in each of these regions
Available Customizations:
Using the given market data, MarketsandMarkets offers customizations according to the company�s specific needs. The following customization options are available for the report:
Regional Analysis:
- Country-level analysis of the global electronics ceramics & electrical ceramics market by end-use industries.
Company Information:
- Detailed analysis and profiles of additional market players.
The global electronics ceramics & electrical ceramics market size is estimated to reach USD 11.98 Billion by 2021 at a CAGR of 4.89%.
The global electronics ceramics & electrical ceramics market has witnessed significant growth in the recent years, and this growth is projected to persist in future. Electronics ceramics & electrical ceramics, due to their characteristic such as high-temperature stability, durability, and low thermal expansion properties, are used in a wide range of end-use industries such as home appliances, medical devices, power grids, and mobile phone applications.
Different material types of electronics ceramics & electrical ceramics are also included in the report. The main material types are alumina, silica, zirconia, titanate, and other ceramics. Alumina ceramics accounted for the largest-market share due to their suitability in a number of application areas. It is also fastest-growing type of electronics ceramics & electrical ceramics due to the increasing acceptance in various end-use industries such as home appliances and medical devices. Titanate ceramics are the second largest ceramics and the market is projected to grow with a significant CAGR between 2016 and 2021.
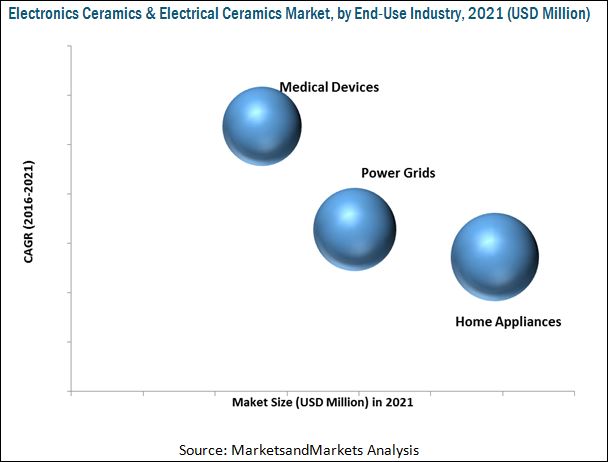
Electronics ceramics & electrical ceramics are used in various end-use industries including home appliances, power grids, medical devices, and mobile phones. Medical devices is the fastest growing end-use industry due to the growing need for advanced medical devices such as endoscope forceps, heart pacemakers, defibrillators, neurostimulators, blood vessel sealers & high-frequency devices, equipment for diagnostic X-rays, CTs and PET scans, and radiation treatment devices.
The Asia-Pacific region, North America, Europe, the Middle East & South Africa, and South America are considered the main regions of the global electronics ceramics & electrical ceramics market in the report. The Asia-Pacific region is dominant in the global electronics ceramics & electrical ceramics market. The rising demand for electronics ceramics & electrical ceramics in this region is mainly driven by the increased use in home appliances and medical devices industries. North America is the second-largest consumer and manufacturer of electronics ceramics & electrical ceramics, globally. The market in this region is mainly driven by the growing opportunities from the medical devices industry and also from the growing industrial end-use industry. Home appliances and power grids are the top two end-use industries contributing to the growing demand for electronics ceramics & electrical ceramics in Europe. The Middle East & South Africa is the second fastest-growing region after the Asia-Pacific region due to the growing power grids industry in the region.
Though the global electronics ceramics & electrical ceramics market is growing at a significant rate, a few factors such as high price of raw materials, shift of the end-use market from developed countries to the emerging countries, and the increasing cost of production hinder the growth of the market, globally.
Coors Tek, Inc. (U.S.), ENrG Inc. (U.S.), Ceradyne, Inc. (U.S.), McDanel Advanced Ceramic Technologies (U.S.), and so on are the leading companies, with an excellent foothold in the U.S. These companies are expected to account for a significant market share in the near future. Entering into related industries and targeting new markets will enable the electronics ceramics & electrical ceramics manufacturers to overcome the effects of challenging economic conditions leading to diversified business portfolios and increase in revenue. Other major manufacturers of electronics ceramics & electrical ceramics are Ceram Tec GmbH (Germany), Kyocera Corporation (Japan), Morgan Advanced Materials (U.K.), Rauschert Steinbach GmbH (Germany), Mantec Technical Ceramics Ltd. (U.K.), and NGK Spark Plug Co., Ltd. (Japan).
To speak to our analyst for a discussion on the above findings, click Speak to Analyst
 Exclusive indicates content/data unique to MarketsandMarkets and not available with any competitors.
Table of Contents
1 Introduction (Page No. - 16)
1.1 Objectives of the Study
1.2 Market Definition
1.3 Market Scope
1.3.1 Years Considered for the Study
1.3.2 Currency
1.3.3 Package Size
1.4 Stakeholders
1.5 Research Limitations
2 Research Methodology (Page No. - 21)
2.1 Research Data
2.1.1 Secondary Data
2.1.1.1 Key Data From Secondary Sources
2.1.2 Primary Data
2.1.2.1 Key Data From Primary Sources
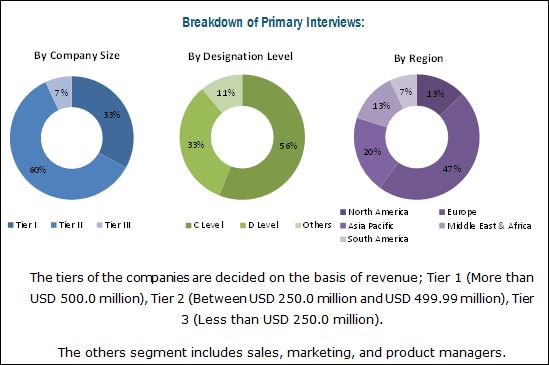
2.1.2.2 Breakdown of Primary Interviews
2.2 Market Size Estimation
2.2.1 Bottom-Up Approach
2.2.2 Top-Down Approach
2.3 Data Triangulation
2.4 Research Assumptions
3 Executive Summary (Page No. - 29)
4 Premium Insights (Page No. - 33)
4.1 Significant Opportunities in the Global Electronics Ceramics & Electrical Ceramics Market
4.2 Electronics Ceramics & Electrical Ceramics Market, By End-Use Industry
4.3 Electronics Ceramics & Electrical Ceramics Market in Asia-Pacific, 2015
4.4 Electronics Ceramics & Electrical Ceramics Market Share, By Region
4.5 Electronics Ceramics & Electrical Ceramics Market, By Material Type
4.6 Lifecycle Analysis, By Region
5 Market Overview (Page No. - 39)
5.1 Introduction
5.2 Market Segmentation
5.3 Market Dynamics
5.3.1 Drivers
5.3.1.1 Increasing Standard of Living in Asia-Pacific
5.3.1.2 Replacement of Conventional Metals and Alloys By Electronics Ceramics & Electrical Ceramics Materials
5.3.1.3 Growing Applications of Electronics Ceramics & Electrical Ceramics in Medical Devices
5.3.2 Restraints
5.3.2.1 High Cost of Raw Materials in Comparison to Other Metals and Alloys
5.3.3 Opportunities
5.3.3.1 Increasing R&D Activities and Mass Production of Ceramic Fibers
5.3.3.2 Incorporation of Low-Cost Production Technologies
5.3.4 Challenges
5.3.4.1 Issues Related to Recyclability and Reparability
6 Industry Trends (Page No. - 46)
6.1 Introduction
6.2 Value Chain Analysis
6.2.1 R&D of Products
6.2.2 Manufacturers (Manufacturing and Assembling)
6.2.3 Distribution
6.2.4 Marketing and Sales
6.2.5 Post-Sale Services
6.3 Porter�s Five Forces Analysis
6.3.1 Threat of New Entrants
6.3.2 Threat of Substitutes
6.3.3 Bargaining Power of Buyers
6.3.4 Bargaining Power of Suppliers
6.3.5 Intensity of Competitive Rivalry
6.4 Patent Analysis
7 Electronics Ceramics & Electrical Ceramics Market, By Material Type (Page No. - 53)
7.1 Introduction
7.2 Raw Material Analysis
7.3 Alumina Ceramics
7.3.1 Alumina Nitride
7.3.2 Alumina Oxide
7.4 Zirconia Ceramics
7.5 Silica
7.5.1 Silicon Carbide
7.5.2 Silicon Nitride
7.6 Titanate
7.7 Pricing Analysis
8 Electronics Ceramics & Electrical Ceramics Market, By Product (Page No. - 64)
8.1 Introduction
8.2 Monolithic Ceramics
8.3 Ceramic Matrix Composites
8.4 Ceramic Coatings
8.5 Others
9 Electronics Ceramics & Electrical Ceramics Market, By End-Use Industry (Page No. - 73)
9.1 Introduction
9.2 Home Appliances
9.3 Power Grid
9.4 Medical Devices
9.5 Mobile Phones
9.6 Others
10 Electronics Ceramics & Electrical Ceramics Market, By Region (Page No. - 84)
10.1 Introduction
10.2 North America
10.2.1 U.S.
10.2.1.1 U.S.: Economic Outlook (2015)
10.2.2 Canada
10.2.2.1 Canada: Economic Outlook (2015)
10.2.3 Mexico
10.2.3.1 Mexico: Economic Outlook (2015)
10.3 Asia-Pacific
10.3.1 China
10.3.1.1 China: Economic Outlook (2015)
10.3.2 India
10.3.2.1 India: Economic Outlook (2015)
10.3.3 Japan
10.3.3.1 Japan: Economic Outlook (2015)
10.3.4 South Korea
10.3.4.1 South Korea: Economic Outlook (2015)
10.4 Europe
10.4.1 Germany
10.4.1.1 Germany:Economic Outlook (2015)
10.4.2 France
10.4.2.1 France: Economic Outlook (2014)
10.4.3 Netherlands
10.4.3.1 Netherlands: Economic Outlook (2014)
10.4.4 Russia
10.4.5 U.K.
10.4.5.1 U.K.: Economic Outlook (2015)
10.5 Middle East & South Africa
10.5.1 Middle East and South Africa: Economic Outlook (2014)
10.5.2 Saudi Arabia
10.5.3 South Africa
10.6 South America
10.6.1 Brazil
11 Competitive Landscape (Page No. - 132)
11.1 Overview
11.2 Market Share Analysis
11.3 Competitive Situation and Trends
11.4 Key Growth Strategies in the Electronics Ceramics & Electrical Ceramics Market, 2011�2016
11.5 Expansions, Investments, & Agreements
11.6 New Product Launches
11.7 Mergers & Acquisitions
12 Company Profile (Page No. - 138)
(Overview, Financial*, Products & Services, Strategy, and Developments)
12.1 Coorstek Inc.
12.2 Ceramtec GmbH
12.3 Kyocera Corporation
12.4 Morgan Advanced Materials
12.5 Ceradyne Inc. (3M Company)
12.6 NGK Spark Plug Co., Ltd.
12.7 Rauschert Steinbach GmbH
12.8 Murata Manufacturing Co., Ltd.
12.9 ENRG Inc.
12.10 Mantec Technical Ceramics Ltd.
12.11 Other Key Players
12.12 List of Customers
*Details Might Not Be Captured in Case of Unlisted Companies
13 Appendix (Page No. - 159)
13.1 Insights From Industry Experts
13.2 Discussion Guide
13.3 Knowledge Store: Marketsandmarkets� Subscription Portal
13.4 Introducing RT: Real-Time Market Intelligence
13.5 Available Customizations
13.6 Related Reports
List of Tables (112 Tables)
Table 1 Electronics Ceramics & Electrical Ceramics Market, By Material Type
Table 2 Electronics Ceramics & Electrical Ceramics Market, By Product
Table 3 Electronics Ceramics & Electrical Ceramics Market, By End-Use Industry
Table 4 Electronics Ceramics & Electrical Ceramics Market Size, By Material Type, 2014�2021 (Kiloton)
Table 5 Electronics Ceramics & Electrical Ceramics Market Size, By Material Type, 2014�2021 (USD Million)
Table 6 Alumina Ceramics Market Size, By Region, 2014�2021 (Kiloton)
Table 7 Alumina Ceramics Market Size, By Region, 2014�2021 (USD Million)
Table 8 Zirconia Ceramics Market Size, By Region, 2014�2021 (Kiloton)
Table 9 Zirconia Ceramics Market Size, By Region, 2014�2021 (USD Million),
Table 10 Silica Ceramics Market Size, By Region, 2014�2021 (Kiloton)
Table 11 Silica Ceramics Market Size, By Region, 2014�2021(USD Million)
Table 12 Titanate Ceramics Market Size, By Region, 2014�2021 (Kiloton)
Table 13 Titanate Ceramics Market Size, By Region, 2014�2021 (USD Million)
Table 14 Pricing Analysis By Material Type, 2014�2021 (USD/Kiloton)
Table 15 Electronics Ceramics & Electrical Ceramics Market Size, By Product, 2014�2021 (Kiloton)
Table 16 Electronics Ceramics & Electrical Ceramics Market Size, By Product, 2014�2021 (USD Million)
Table 17 Monolithic Ceramics Market Size, 2014�2021, (Kiloton)
Table 18 Monolithic Ceramics Market Size, 2014�2021, (USD Million)
Table 19 Ceramic Matrix Composites Market Size, By Region, 2014�2021 (Kiloton)
Table 20 Ceramic Matrix Composites Market Size, By Region, 2014�2021 (USD Million)
Table 21 Ceramic Coatings Market Size, By Region, 2014�2021 (Kiloton)
Table 22 Ceramic Coatings Market Size, By Region, 2014�2021 (USD Million)
Table 23 Others Market Size, By Region, 2014�2021 (Kiloton)
Table 24 Others Market Size, By Region, 2014�2021 (USD Million)
Table 25 Electronics Ceramics & Electrical Ceramics Market Size, By End-Use Industry, 2014�2021 (Kiloton)
Table 26 Electronics Ceramics & Electrical Ceramics Market Size, By End-Use Industry, 2014�2021 (USD Million)
Table 27 Electronics Ceramics & Electrical Ceramics Market Size in Home Appliances Segment, By Region, 2014�2021 (Kiloton)
Table 28 Electronics Ceramics & Electrical Ceramics Market Size in Home Appliances Segment, By Region, 2014�2021 (USD Million)
Table 29 Electronics Ceramics & Electrical Ceramics Market Size in Power Grid Segment, By Region, 2014�2021 (Kiloton)
Table 30 Electronics Ceramics & Electrical Ceramics Market Size in Power Grid Segment, By Region, 2014�2021 (USD Million)
Table 31 Electronics Ceramics & Electrical Ceramics Market Size in Medical Devices Segment, By Region, 2014�2021 (Kiloton)
Table 32 Electronics Ceramics & Electrical Ceramics Market Size in Medical Devices Segment, By Region, 2014�2021 (USD Million)
Table 33 Electronics Ceramics & Electrical Ceramics Market Size in Mobile Phones Segment, By Region, 2014�2021 (Kiloton)
Table 34 Electronics Ceramics & Electrical Ceramics Market Size in Mobile Phones Segment, By Region, 2014�2021 (USD Million)
Table 35 Electronics Ceramics & Electrical Ceramics Market Size in Others Segment, By Region, 2014�2021 (Kiloton)
Table 36 Electronics Ceramics & Electrical Ceramics Market Size in Others Segment, By Region, 2014�2021 (USD Million)
Table 37 Electronics Ceramics & Electrical Ceramics Market, By Region, 2014�2021 (Kiloton)
Table 38 Electronics Ceramics & Electrical Ceramics Market, By Region, 2014�2021 (USD Million)
Table 39 North America: Electronics Ceramics & Electrical Ceramics Market Size, By Country, 2014�2021 (Kiloton)
Table 40 North America: Electronics Ceramics & Electrical Ceramics Market Size, By Country, 2014�2021 (USD Million)
Table 41 North America: Electronics Ceramics & Electrical Ceramics Market Size, By Material Type, 2014�2021 (Kiloton)
Table 42 North America: Electronics Ceramics & Electrical Ceramics Market Size, By Material Type, 2014�2021 (USD Million)
Table 43 North America: Electronics Ceramics & Electrical Ceramics Market Size, By Product, 2014�2021 (Kiloton)
Table 44 North America: Electronics Ceramics & Electrical Ceramics Market Size, By Product, 2014�2021 (USD Million)
Table 45 North America: Electronics Ceramics & Electrical Ceramics Market Size, By End-Use Industry, 2014�2021 (Kiloton)
Table 46 North America: Electronics Ceramics & Electrical Ceramics Market Size, By End-Use Industry, 2014�2021 (USD Million)
Table 47 U.S.: Electronics Ceramics & Electrical Ceramics Market Size, By End-Use Industry, 2014�2021 (Kiloton)
Table 48 U.S.: Electronics Ceramics & Electrical Ceramics Market Size, By End-Use Industry, 2014�2021 (USD Million)
Table 49 Canada: Electronics Ceramics & Electrical Ceramics Market Size, By End-Use Industry, 2014�2021 (Kiloton)
Table 50 Canada: Electronics Ceramics & Electrical Ceramics Market Size, By End-Use Industry, 2014�2021 (USD Million)
Table 51 Mexico: Electronics Ceramics & Electrical Ceramics Market Size, By End-Use Industry, 2014�2021 (Kiloton)
Table 52 Mexico: Electronics Ceramics & Electrical Ceramics Market Size, By End-Use Industry, 2014�2021 (USD Million)
Table 53 Asia-Pacific: Electronics Ceramics & Electrical Ceramics Market Size, By Country, 2014�2021 (Kiloton)
Table 54 Asia-Pacific: Electronics Ceramics & Electrical Ceramics Market Size, By Country, 2014�2021 (USD Million)
Table 55 Asia-Pacific: Electronics Ceramics & Electrical Ceramics Market Size, By Material Type, 2014�2021 (Kiloton)
Table 56 Asia-Pacific: Electronics Ceramics & Electrical Ceramics Market Size, By Material Type, 2014�2021 (USD Million)
Table 57 Asia-Pacific: Electronics Ceramics & Electrical Ceramics Market Size, By Product, 2014�2021 (Kiloton)
Table 58 Asia-Pacific: Electronics Ceramics & Electrical Ceramics Market Size, By Product, 2014�2021 (USD Million)
Table 59 Asia-Pacific: Electronics Ceramics & Electrical Ceramics Market Size, By End-Use Industry, 2014�2021 (Kiloton)
Table 60 Asia-Pacific: Electronics Ceramics & Electrical Ceramics Market Size, By End-Use Industry, 2014�2021 (USD Million)
Table 61 China: Electronics Ceramics & Electrical Ceramics Market Size, By End-Use Industry, 2014�2021 (Kiloton)
Table 62 China: Electronics Ceramics & Electrical Ceramics Market Size, By End-Use Industry, 2014�2021 (USD Million)
Table 63 India: Electronics Ceramics & Electrical Ceramics Market Size, By End-Use Industry, 2014�2021 (Kiloton)
Table 64 India: Electronics Ceramics & Electrical Ceramics Market Size, By End-Use Industry, 2014�2021 (USD Million)
Table 65 Japan: Electronics Ceramics & Electrical Ceramics Market Size, By End-Use Industry, 2014�2021 (Kiloton)
Table 66 Japan: Electronics Ceramics & Electrical Ceramics Market Size, By End-Use Industry, 2014�2021 (USD Million)
Table 67 South Korea: Electronics Ceramics & Electrical Ceramics Market Size, By End-Use Industry, 2014�2021 (Kiloton)
Table 68 South Korea: Electronics Ceramics & Electrical Ceramics Market Size, By End-Use Industry, 2014�2021 (USD Million)
Table 69 Europe: Electronics Ceramics & Electrical Ceramics Market Size, By Country, 2014�2021 (Kiloton)
Table 70 Europe: Electronics Ceramics & Electrical Ceramics Market Size, By Country, 2014�2021 (USD Million)
Table 71 Europe: Electronics Ceramics & Electrical Ceramics Market Size, By Material Type, 2014�2021 (Kiloton)
Table 72 Europe: Electronics Ceramics & Electrical Ceramics Market Size, By Material Type, 2014�2021 (USD Million)
Table 73 Europe: Electronics Ceramics & Electrical Ceramics Market Size, By Product, 2014�2021 (Kiloton)
Table 74 Europe: Electronics Ceramics & Electrical Ceramics Market Size, By Product, 2014�2021 (USD Million)
Table 75 Europe: Electronics Ceramics & Electrical Ceramics Market Size, By End-Use Industry, 2014�2021 (Kiloton)
Table 76 Europe: Electronics Ceramics & Electrical Ceramics Market Size, By End-Use Industry, 2014�2021 (USD Million)
Table 77 Germany: Electronics Ceramics & Electrical Ceramics Market Size, By End-Use Industry, 2014�2021 (Kiloton)
Table 78 Germany: Electronics Ceramics & Electrical Ceramics Market Size, By End-Use Industry, 2014�2021 (USD Million)
Table 79 France: Electronics Ceramics & Electrical Ceramics Market Size, By End-Use Industry, 2014�2021 (Kiloton)
Table 80 France: Electronics Ceramics & Electrical Ceramics Market Size, By End-Use Industry, 2014�2021 (USD Million)
Table 81 Netherlands: Electronics Ceramics & Electrical Ceramics Market Size, By End-Use Industry, 2014�2021 (Kiloton)
Table 82 Netherlands: Electronics Ceramics & Electrical Ceramics Market Size, By End-Use Industry, 2014�2021 (USD Million)
Table 83 Russia : Economic Outlook (2015)
Table 84 Russia: Electronics Ceramics & Electrical Ceramics Market Size, By End-Use Industry, 2014�2021 (Kiloton)
Table 85 Russia: Electronics Ceramics & Electrical Ceramics Market Size, By End-Use Industry, 2014�2021 (USD Million)
Table 86 U.K.: Electronics Ceramics & Electrical Ceramics Market Size, By End-Use Industry, 2014�2021 (Kiloton)
Table 87 U.K.: Electronics Ceramics & Electrical Ceramics Market Size, By End-Use Industry, 2014�2021 (USD Million)
Table 88 Middle East & South Africa: Electronics Ceramics & Electrical Ceramics Market Size, By Country, 2014�2021 (Kiloton)
Table 89 Middle East & South Africa: Electronics Ceramics & Electrical Ceramics Market Size, By Country, 2014�2021 (USD Million)
Table 90 Middle East & South Africa: Electronics Ceramics & Electrical Ceramics Market Size, By Material Type, 2014�2021 (Kiloton)
Table 91 Middle East & South Africa: Electronics Ceramics & Electrical Ceramics Market Size, By Material Type, 2014�2021 (USD Million)
Table 92 Middle East & South Africa: Electronics Ceramics & Electrical Ceramics Market Size, By Product, 2014�2021 (Kiloton)
Table 93 Middle East & South Africa: Electronics Ceramics & Electrical Ceramics Market Size, By Product, 2014�2021 (USD Million)
Table 94 Middle East & South Africa: Electronics Ceramics & Electrical Ceramics Market Size, By End-Use Industry, 2014�2021 (Kiloton)
Table 95 Middle East & South Africa: Electronics Ceramics & Electrical Ceramics Market Size, By End-Use Industry, 2014�2021 (USD Million)
Table 96 Saudi Arabia: Electronics Ceramics & Electrical Ceramics Market Size, By End-Use Industry, 2014�2021 (Kiloton)
Table 97 Saudi Arabia: Electronics Ceramics & Electrical Ceramics Market Size, By End-Use Industry, 2014�2021 (USD Million)
Table 98 South Africa: Electronics Ceramics & Electrical Ceramics Market Size, By End-Use Industry, 2014�2021 (Kiloton)
Table 99 South Africa: Electronics Ceramics & Electrical Ceramics Market Size, By End-Use Industry, 2014�2021 (USD Million)
Table 100 South America: Electronics Ceramics & Electrical Ceramics Market Size, By Country, 2014�2021 (Kiloton)
Table 101 South America: Electronics Ceramics & Electrical Ceramics Market Size, By Country, 2014�2021 (USD Million)
Table 102 South America: Electronics Ceramics & Electrical Ceramics Market Size, By Material Type, 2014�2021 (Kiloton)
Table 103 South America: Electronics Ceramics & Electrical Ceramics Market Size, By Material Type, 2014�2021 (USD Million)
Table 104 South America: Electronics Ceramics & Electrical Ceramics Market Size, By Product, 2014�2021 (Kiloton)
Table 105 South America: Electronics Ceramics & Electrical Ceramics Market Size, By Product, 2014�2021 (USD Million)
Table 106 South America: Electronics Ceramics & Electrical Ceramics Market Size, By End-Use Industry, 2014�2021 (Kiloton)
Table 107 South America: Electronics Ceramics & Electrical Ceramics Market Size, By End-Use Industry, 2014�2021 (USD Million)
Table 108 Brazil: Electronics Ceramics & Electrical Ceramics Market Size, By End-Use Industry, 2014�2021 (Kiloton)
Table 109 Brazil: Electronics Ceramics & Electrical Ceramics Market Size, By End-Use Industry, 2014�2021 (USD Million)
Table 110 Expansions, Investments, & Agreements, 2011�2016
Table 111 New Product Launches, 2011�2016
Table 112 Mergers & Acquisitions, 2011�2016
List of Figures (51 Figures)
Figure 1 Electronics Ceramics & Electrical Ceramics: Market Segmentation
Figure 2 Electronics Ceramics & Electrical Ceramics Market: Research Methodology
Figure 3 Market Size Estimation: Bottom-Up Approach
Figure 4 Market Size Estimation: Top-Down Approach
Figure 5 Electronics Ceramics & Electrical Ceramics: Data Triangulation
Figure 6 Electronics Ceramics & Electrical Ceramics Market Snapshot: Medical Devices End-Use Industry to Register the Highest CAGR, 2016�2021
Figure 7 Monolithic Ceramics Estimated to Be the Largest Market Share By 2021
Figure 8 U.S. Dominates the Electronics Ceramics & Electrical Ceramics Market
Figure 9 Asia-Pacific is the Largest Electronics Ceramics & Electrical Ceramics Market
Figure 10 Attractive Opportunities in the Electronics Ceramics & Electrical Ceramics Market, 2016�2021
Figure 11 Medical Devices Estimated to Be the Fastest Growing End-Use Industry Between 2016 and 2021
Figure 12 China to Be the Largest Market in Asia-Pacific
Figure 13 Asia-Pacific Accounted for the Largest Share of the Electronics Ceramics & Electrical Ceramics Market, 2015
Figure 14 Alumina to Account for the Largest Market Share During the Forecast Period
Figure 15 Electronics Ceramics & Electrical Ceramics Market in Asia-Pacific is in the Growth Phase
Figure 16 Electronics Ceramics & Electrical Ceramics Market, By Region
Figure 17 Drivers, Restraints, Opportunities, and Challenges in Electronics Ceramics & Electrical Ceramics Market
Figure 18 Electronics Ceramics & Electrical Ceramics: Value Chain Analysis
Figure 19 Porter�s Five Forces Analysis: Electronics Ceramics & Electrical Ceramics Market
Figure 20 Electronics Ceramics & Electrical Ceramics Market, By Material Type
Figure 21 Asia-Pacific to Register the Highest CAGR Between 2016 and 2021
Figure 22 North America is the Second-Largest Market for Zirconia Ceramics
Figure 23 Asia-Pacific is the Largest Silica Ceramics Market
Figure 24 South America is the Second-Fastest Growing Titanate Market
Figure 25 Raw Materials Pricing Trend Between 2016 and 2021
Figure 26 Electronics Ceramics & Electrical Ceramics Market, By Product
Figure 27 Asia-Pacific Dominates the Monolithic Ceramics Market (2016�2021)
Figure 28 Asia-Pacific is the Largest Ceramic Matrix Composites Market (2016�2021)
Figure 29 North America is the Second-Largest Ceramic Coatings Market (2016�2021)
Figure 30 Asia-Pacific is the Fastest-Growing Market Followed By South-America (2016�2021)
Figure 31 The Electronics Ceramics & Electrical Ceramics Market in Medical Devices Segment to Grow Rapidly During the Forecast Period
Figure 32 Asia-Pacific is the Fastest-Growing Electronics Ceramics & Electrical Ceramics Market in the Home Appliances Segment, 2016�2021
Figure 33 Asia-Pacific to Be the Largest Market in Power Grid Segment, 2016�2021
Figure 34 The Market in Medical Devices Segment to Be the Fastest-Growing in Asia-Pacific, 2016�2021
Figure 35 Electronics Ceramics & Electrical Ceramics Market in Mobile Phones Segment to Be the Fastest-Growing in Asia-Pacific, 2016�2021
Figure 36 India, China, Japan, and Brazil are Emerging as the New Hotspots in Global Electronics Ceramics & Electrical Ceramics Market, 2016�2021
Figure 37 U.S. Was the Key Electronics Ceramics & Electrical Ceramics Market in North America, 2015
Figure 38 The U.S. to Remain the Leading Player in the Electronics Ceramics & Electrical Ceramics Market in North America, 2016�2021
Figure 39 Regional Snapshot (2015): Asia-Pacific to Be the Largest Market for Electronics Ceramics & Electrical Ceramics
Figure 40 China to Remain the Leading Player in the Electronics Ceramics & Electrical Ceramics Market in Asia-Pacific, 2016�2021
Figure 41 Europe Electronics Ceramics & Electrical Ceramics Market: Regional Snapshot (2015)
Figure 42 Brazil is the Largest Electronics Ceramics & Electrical Ceramics Market in South America
Figure 43 Companies Adopted New Product Launches as the Key Growth Strategy, 2011�2016
Figure 44 Market Share Analysis: Top 10 Market Players
Figure 45 New Product Launches Was the Most Adopted Strategy, 2011�2016
Figure 46 Kyocera Corporation: Company Snapshot
Figure 47 Kyocera Corporation: SWOT Analysis
Figure 48 Morgan Advanced Materials: Company Snapshot
Figure 49 Morgan Advanced Materials: SWOT Analysis
Figure 50 NGK Spark Plug Co., Ltd.: Company Snapshot
Figure 51 Murata Manufacturing Co., Ltd.: Company Snapshot


Growth opportunities and latent adjacency in Electronics Ceramics & Electrical Ceramics Market