Energy and Utilities Analytics Market by Component (Solutions and Services), Deployment Mode, Organization Size, Application (Upstream, Midstream, and Downstream), Vertical (Energy and Utilities), and Region - Global Forecast to 2025


Energy and Utilities Analytics Market - Industry Trends and Forecast
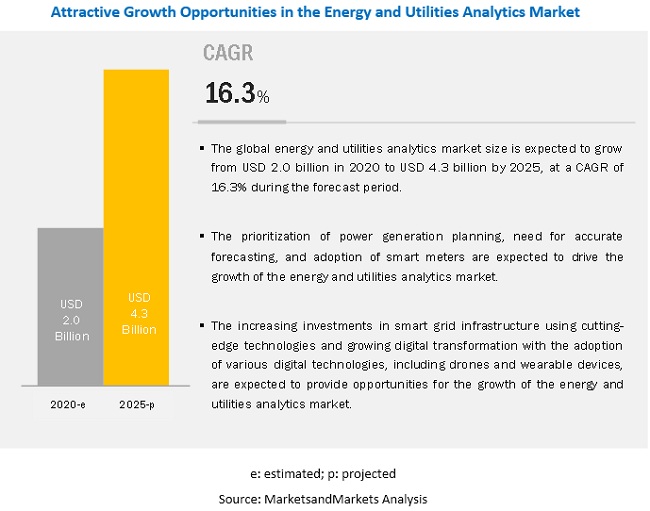
The global Energy and Utilities Analytics Market is projected to expand at a CAGR of 16.3% during the forecast period to reach USD 4.3 billion by 2026, size was valued USD 2.0 billion in 2020. The major growth factor of the energy and utilities analytics industry is the mounting adoption of smart meters for enabling two-way communication between companies and customers. The prioritization of power generation planning and the need for accurate forecasting, and the investments in digital channels to improve customer processes, experience, and perceived customer value are also expected to drive the market growth.
Software segment to grow at a higher CAGR during the forecast period
In the solutions segment, the software segment is expected to grow at a higher CAGR during the forecast period. Energy and utilities analytics software is becoming prevalent among utility organizations to transform their underlying infrastructure for adapting to ever-changing market dynamics and customers' shifting requirements. The proliferation of analytics amounting to big data has enforced vendors to deliver end-to-end benefits across utilities' value chain. These benefits include improved customer experience, reduced cost to serve, increased up-sell or cross-sell opportunities, and improved brand loyalty. Some of the vendors such as Microsoft, IBM, Oracle, Siemens, GE, AWS, Google, Cisco, and Intel offer software in the energy and utilities analytics market. A North American energy company, TC Energy, has partnered with AWS to automate workflows, unlock data, and improve efficiency for its pipeline and power generation businesses.
Cloud deployment mode to grow at a rapid pace during the forecast period
Most vendors in the energy and utilities analytics market offer cloud-based energy and utilities analytics solutions to maximize profits and automate the equipment maintenance process effectively. The adoption of cloud-based energy and utilities analytics solutions is expected to grow, due to benefits such as the easy maintenance of image data generated, cost-effectiveness, agility, flexibility, scalability, and the effective management of these solutions. Companies prefer to adopt cloud-based energy and utilities analytics solutions, as these solutions support their regional, cross-regional, or cross-country data recovery strategies. This enables them to ensure resilience in case of disasters.
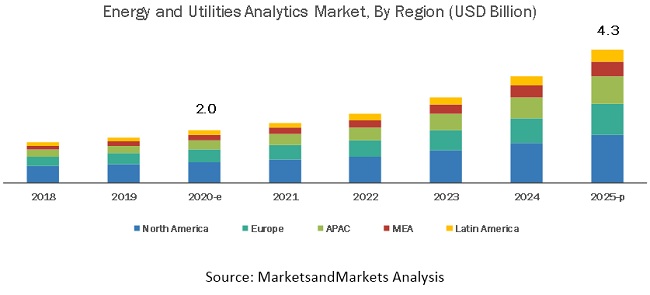
North America to hold the highest market share during the forecast period
North America is expected to hold the highest share in the global energy and utilities analytics market, while Asia Pacific (APAC) is expected to grow at the highest CAGR during the forecast period. The North America region is witnessing significant developments in the market. North America is also projected to hold the largest market size during the forecast period. Key factors favoring the growth of the market in North America include the increasing investments in the development of various technologies and growing application of energy and utilities analytics solutions. The growing number of energy and utilities analytics players across regions is also expected to drive the market growth. Major North American vendors in the market are Microsoft (US), IBM (US), Intel (US), GE (US), Cisco (US), Google (US), Oracle (US), SAS Institute (US), Salesforce (US), Teradata (US), AWS (US), MicroStrategy (US), Alteryx (US), TIBCO Software (US), Qlik (US), and Infor (US).
Key Companies & Market Share Insights
Major vendors in the global energy and utilities analytics market include Microsoft (US), Eaton (Ireland), IBM (US), SAP (Germany), Intel (US), GE (US), Schneider Electric (France), Siemens (Germany), Cisco (US), Google (US), Oracle (US), SAS Institute (US), Salesforce (US), OpenText (Canada), Teradata (US), AWS (US), Atos (France), MicroStrategy (US), Alteryx (US), TIBCO Software (US), Qlik (US), Yellowfin (Australia), Board International (Switzerland), and Infor (US). These vendors have adopted various organic and inorganic growth strategies, including new product launches, partnerships and collaborations, and mergers and acquisitions, to expand their presence in the global market.
AWS (US) is a subsidiary of Amazon and primarily offers cloud computing services in the form of web services. It also offers a wide range of products and services to customers present in 190 countries. AWS product portfolio comprises segments, such as compute, storage, database, migration, network and content delivery, developer tools, management tools, media services, Machine Learning (ML), and analytics. The solutions segment of the company offers websites and web apps, mobile services, back-up, storage and archive, financial services, and digital media. AWS offers power and utilities analytics solutions, which include asset management, customer engagement, IT transformation, and Operational Technology Transformation and services such as Amazon Athena, Amazon Kinesis, Amazon Elasticsearch Service, and Amazon SageMaker.
The company provides power and utility companies the foundation to realize operational and cost efficiencies and meet the growing demand reliably, and the flexibility to evolve their business models in a rapidly changing industry. It always caters to the evolving needs of enterprises and their clients. The primary aim of the company is to provide customers with advanced products that cater to their specific needs. The company has the capability to provide highly customized solutions related to energy and utilities verticals. It has adopted organic and inorganic growth strategies to increase its footprint globally and to cater to the needs of its customers at a rapid pace. Its inorganic growth strategies also help it expand its presence in numerous market segments.
Scope of the Report
|
Report Metric |
Details |
|
Market size value in 2020 |
USD 2.0 billion |
|
Revenue forecast for 2025 |
USD 4.3 billion |
|
Growth Rate |
16.3% CAGR |
|
Forecast units |
USD Billion |
|
Segments covered |
Component, deployment mode, organization size, application, vertical, and region |
|
Geographies covered |
North America, Europe, APAC, Latin America, and MEA |
|
Companies covered |
Microsoft (US), Eaton (Ireland), IBM (US), SAP (Germany), Intel (US), GE (US), Schneider Electric (France), Siemens (Germany), Cisco (US), Google (US), Oracle (US), SAS Institute (US), Salesforce (US), OpenText (Canada), Teradata (US), AWS (US), Atos (France), MicroStrategy (US), Alteryx (US), TIBCO Software (US), Qlik (US), Yellowfin (Australia), Board International (Switzerland), and Infor (US) |
This research report categorizes the energy and utilities analytics market based on components, deployment modes, organization size, applications, verticals, and regions.
By component, the energy and utilities analytics market is divided into the following segments:
-
Solutions
- Platform
- Software
-
Services
- Managed Services
-
Professional Services
- Consulting
- Deployment and Integration
- Support and Maintenance
By deployment mode, the energy and utilities analytics market is divided into the following segments:
- Cloud
- On-premises
By cloud type, the energy and utilities analytics market is divided into the following segments:
- Public Cloud
- Private Cloud
- Hybrid Cloud
By organization size, the energy and utilities analytics market is divided into the following segments:
- Large Enterprises
- Small and Medium-sized Enterprises (SMEs)
By application, the energy and utilities analytics market is divided into the following segments:
- Upstream
- Midstream
- Downstream
By upstream application, the energy and utilities analytics market is divided into the following segments:
- Exploration and Drilling Analytics
- Production Planning and Forecasting Analytics
- Field Surveillance Analytics
- Workforce Management Analytics
- Predictive Asset Analytics
By midstream application, the energy and utilities analytics market is divided into the following segments:
- Logistics and supply chain Analytics
- Grid Analytics
- Storage Optimization Analytics
By downstream application, the energy and utilities analytics market is divided into the following segments:
- Pricing Analytics
- Advanced Infrastructure Analytics
- Customer Analytics
- Call Center Optimization
By vertical, the energy and utilities analytics market is divided into the following segments:
- Energy
- Utilities
By energy vertical, the energy and utilities analytics market is divided into the following segments:
- Oil and Gas
- Mining
- Renewable Energy
- Others (coal and nuclear power)
By utilities vertical, the energy and utilities analytics market is divided into the following segments:
- Electricity
- Water
- Waste
By region, the energy and utilities analytics market is divided into the following segments:
-
North America
- US
- Canada
-
Europe
- UK
- Germany
- Rest of Europe
-
APAC
- China
- Japan
- India
- Rest of APAC
-
MEA
- Kingdom of Saudi Arabia (KSA)
- United Arab Emirates (UAE)
- South Africa
- Rest of MEA
-
Latin America
- Brazil
- Mexico
- Rest of Latin America
Recent Developments
- In April 2020, Eaton upgraded its intelligent power solutions with the launch of its redesigned PredictPulse remote monitoring and management service in the US. The new version of PredictPulse offers a completely redesigned user interface for both browsers and mobile devices. The new mobile portal interface gives users a view into real-time data, trends, events, service history, and alarms from any mobile or tablet device, along with PulseScore, a new feature, to communicate the overall health of users uninterruptible power system.
- In March 2020, SAP launched a co-developed solution for upstream oil and gas companies with Accenture. Based on SAP S/4HANA Cloud, the solution helps upstream oil and gas companies increase visibility into operations and cash flows.
- In February 2020, Microsoft opened a new data center region in Spain and extended its partnership with Telefónica to boost competitiveness in Spain. The new expansion of the data center region in Spain aims at accelerating the digital transformation of public and private entities of all size, helping them innovate, scale, and migrate their business to cloud in a secure way.
- In February 2020, the GE Steam Power segment and Thales collaborated to provide a broad cybersecurity portfolio for the power generation sector. The collaboration brings together Thales' cyber knowledge and GE's expertise in the power generation industry to protect customers from cyber risks by providing threat intelligence, joint training, and a combined portfolio of cyber solutions.
- In January 2020, GE Hitachi Nuclear Energy and TerraPower collaborated to design and construct Versatile Test Reactor (VTR) for the US Department of Energy (DOE). The collaboration aims at building the next-generation nuclear technology for delivering affordable and clean energy, and reestablishing the American leadership in nuclear technology.
- In July 2019, Eaton acquired Innovative Switchgear Solutions (ISG), a specialty manufacturer of medium-voltage electrical equipment catering to the North American utilities, commercial, and industrial markets. With the acquisition, Eaton would be able to enhance its product offering as ISG's solid dielectric underground switchgear products would provide a compact, low maintenance, and highly configurable solution. The solution would help Eaton solve the critical challenges faced by its customers.
Critical questions answered by the report:
- What are the current trends driving the energy and utilities analytics market?
- In which vertical are most industrial companies deploying energy and utilities analytics solutions?
- Where will the recent developments of the market vendors take the industry in the mid- to long-term?
- Who are the top vendors in the market, and what is their competitive analysis?
- What are the drivers and challenges faced by the vendors in the market?
Frequently Asked Questions (FAQ):
How big is the energy and utilities analytics Market?
The global energy and utilities analytics market size was estimated at 2.0 billion in 2020 and is expected to reach USD 4.3 billion by 2025.
What is the energy and utilities analytics Market Growth?
The global energy and utilities analytics market is expected to grow at a compound annual growth rate of 16.3% from 2020 to 2025 to reach USD 4.3 billion by 2025.
What are the top companies providing energy and utilities analytics solutions in the market?
The top vendors in the market include Microsoft (US), Eaton (Ireland), IBM (US), SAP (Germany), Intel (US), GE (US), Schneider Electric (France), Siemens (Germany), Cisco (US), Google (US), Oracle (US), SAS Institute (US), Salesforce (US), OpenText (Canada), Teradata (US), AWS (US), Atos (France), MicroStrategy (US), Alteryx (US), TIBCO Software (US), Qlik (US), Yellowfin (Australia), Board International (Switzerland), and Infor (US).
What are the major driving factors in the energy and utilities analytics in the market?
Increasing investments digital channels to improve customer process, experience, and perceived customer value to drive the growth of energy and utilities analytics market.
Which region have highest growth rate in the energy and utilities analytics market?
APAC is expected to grow at the highest growth rate during the forecast period due to the increasing investments in developments of various energy generation plants with huge customer demand for energy and electricity across the region.
What are various the key applications in the energy and utilities analytics?
The key applications in the energy and utilities analytics market includes upstream, midstream, and downstream. .
To speak to our analyst for a discussion on the above findings, click Speak to Analyst
 Exclusive indicates content/data unique to MarketsandMarkets and not available with any competitors.
TABLE OF CONTENTS
1 INTRODUCTION (Page No. - 30)
1.1 INTRODUCTION TO COVID-19
1.2 COVID-19 HEALTH ASSESSMENT
FIGURE 1 COVID-19: THE GLOBAL PROPAGATION
FIGURE 2 COVID-19 PROPAGATION: SELECT COUNTRIES
1.3 COVID-19 ECONOMIC ASSESSMENT
FIGURE 3 REVISED GDP FORECASTS FOR SELECT G20 COUNTRIES IN 2020
1.3.1 COVID-19 ECONOMIC IMPACT—SCENARIO ASSESSMENT
FIGURE 4 CRITERIA IMPACTING THE GLOBAL ECONOMY
FIGURE 5 SCENARIOS IN TERMS OF RECOVERY OF THE GLOBAL ECONOMY
1.4 OBJECTIVES OF THE STUDY
1.5 MARKET DEFINITION
1.5.1 INCLUSIONS AND EXCLUSIONS
1.6 MARKET SCOPE
1.6.1 MARKET SEGMENTATION
1.6.2 REGIONS COVERED
1.6.3 YEARS CONSIDERED FOR THE STUDY
1.7 CURRENCY CONSIDERED
TABLE 1 UNITED STATES DOLLAR EXCHANGE RATE, 2017–2019
1.8 STAKEHOLDERS
1.9 SUMMARY OF CHANGES
2 RESEARCH METHODOLOGY (Page No. - 41)
2.1 RESEARCH DATA
FIGURE 6 ENERGY AND UTILITIES ANALYTICS MARKET: RESEARCH DESIGN
2.1.1 SECONDARY DATA
2.1.2 PRIMARY DATA
2.1.2.1 Breakup of primary profiles
2.1.2.2 Key industry insights
2.2 MARKET BREAKUP AND DATA TRIANGULATION
FIGURE 7 DATA TRIANGULATION
2.3 MARKET SIZE ESTIMATION
FIGURE 8 MARKET SIZE ESTIMATION METHODOLOGY–APPROACH 1 (SUPPLY SIDE): REVENUE OF SOLUTIONS/SERVICES OF THE ENERGY AND UTILITIES ANALYTICS MARKET
FIGURE 9 MARKET SIZE ESTIMATION METHODOLOGY–APPROACH 2 BOTTOM-UP (SUPPLY SIDE): COLLECTIVE REVENUE OF ALL SOLUTIONS/SERVICES OF THE ENERGY AND UTILITIES ANALYTICS MARKET
FIGURE 10 MARKET SIZE ESTIMATION METHODOLOGY–APPROACH 3 TOP-DOWN (DEMAND SIDE): SHARE OF ENERGY AND UTILITIES ANALYTICS THROUGH THE OVERALL ENERGY AND UTILITIES ANALYTICS SPENDING
FIGURE 11 ENERGY AND UTILITIES ANALYTICS MARKET: TOP-DOWN AND BOTTOM-UP APPROACHES
2.3.1 TOP-DOWN APPROACH
2.3.2 BOTTOM-UP APPROACH
2.4 MARKET FORECAST
TABLE 2 FACTOR ANALYSIS
2.5 ASSUMPTIONS FOR THE STUDY
2.6 LIMITATIONS OF THE STUDY
3 EXECUTIVE SUMMARY (Page No. - 52)
TABLE 3 GLOBAL ENERGY AND UTILITIES ANALYTICS MARKET SIZE AND GROWTH RATE, 2018–2025 (USD MILLION, Y-O-Y%)
FIGURE 12 SERVICES SEGMENT TO HOLD A HIGHER MARKET SIZE IN THE ENERGY AND UTILITIES ANALYTICS MARKET IN 2020
FIGURE 13 PLATFORM SEGMENT TO HOLD A HIGHER MARKET SHARE IN THE ENERGY AND UTILITIES ANALYTICS MARKET IN 2020
FIGURE 14 PROFESSIONAL SERVICES SEGMENT TO HOLD A HIGHER MARKET SIZE IN THE ENERGY AND UTILITIES ANALYTICS MARKET IN 2020
FIGURE 15 DEPLOYMENT AND INTEGRATION SEGMENT TO HOLD THE HIGHEST MARKET SHARE IN THE ENERGY AND UTILITIES ANALYTICS MARKET IN 2020
FIGURE 16 ON-PREMISES SEGMENT TO HOLD A HIGHER MARKET SHARE IN THE ENERGY AND UTILITIES ANALYTICS MARKET IN 2020
FIGURE 17 PUBLIC CLOUD SEGMENT TO HOLD THE HIGHEST MARKET SIZE IN THE ENERGY AND UTILITIES ANALYTICS MARKET IN 2020
FIGURE 18 LARGE ENTERPRISES SEGMENT TO HOLD A HIGHER MARKET SHARE IN THE ENERGY AND UTILITIES ANALYTICS MARKET IN 2020
FIGURE 19 UPSTREAM SEGMENT TO HOLD THE HIGHEST MARKET SIZE IN THE ENERGY AND UTILITIES ANALYTICS MARKET IN 2020
FIGURE 20 EXPLORATION AND DRILLING ANALYTICS SEGMENT TO HOLD THE HIGHEST MARKET SHARE IN THE ENERGY AND UTILITIES ANALYTICS MARKET IN 2020
FIGURE 21 STORAGE OPTIMIZATION ANALYTICS SEGMENT TO HOLD THE HIGHEST MARKET SIZE IN THE ENERGY AND UTILITIES ANALYTICS MARKET IN 2020
FIGURE 22 CUSTOMER ANALYTICS SEGMENT TO HOLD THE HIGHEST MARKET SHARE IN THE ENERGY AND UTILITIES ANALYTICS MARKET IN 2020
FIGURE 23 ENERGY VERTICAL TO HOLD A HIGHER MARKET SIZE IN THE ENERGY AND UTILITIES ANALYTICS MARKET IN 2020
FIGURE 24 OIL AND GAS VERTICAL TO HOLD THE HIGHEST MARKET SIZE IN THE ENERGY AND UTILITIES ANALYTICS MARKET IN 2020
FIGURE 25 ELECTRICITY VERTICAL TO HOLD THE HIGHEST MARKET SHARE IN THE ENERGY AND UTILITIES ANALYTICS MARKET IN 2020
FIGURE 26 NORTH AMERICA TO HOLD THE HIGHEST MARKET SHARE AND ASIA PACIFIC TO HOLD THE HIGHEST CAGR IN THE ENERGY AND UTILITIES ANALYTICS MARKET IN 2020
4 PREMIUM INSIGHTS (Page No. - 61)
4.1 ATTRACTIVE MARKET OPPORTUNITIES IN THE ENERGY AND UTILITIES ANALYTICS MARKET
FIGURE 27 MOUNTING ADOPTION OF SMART METERS, PRIORITIZATION OF POWER GENERATION PLANNING, AND INCREASING INVESTMENTS IN DIGITAL CHANNELS TO ENHANCE CUSTOMER EXPERIENCE TO DRIVE THE GROWTH OF THE ENERGY AND UTILITIES ANALYTICS MARKET
4.2 ENERGY AND UTILITIES ANALYTICS MARKET: TOP APPLICATIONS
FIGURE 28 MIDSTREAM SEGMENT TO GROW AT THE HIGHEST CAGR DURING THE FORECAST PERIOD
4.3 ENERGY AND UTILITIES ANALYTICS MARKET: BY REGION
FIGURE 29 NORTH AMERICA TO HOLD THE HIGHEST MARKET SHARE IN 2020
4.4 ENERGY AND UTILITIES ANALYTICS MARKET IN NORTH AMERICA, BY APPLICATION AND CLOUD TYPE
FIGURE 30 UPSTREAM SEGMENT AND PUBLIC CLOUD SEGMENT TO ACCOUNT FOR THE HIGHEST SHARES IN THE ENERGY AND UTILITIES ANALYTICS MARKET IN 2020
5 MARKET OVERVIEW AND INDUSTRY TRENDS (Page No. - 63)
5.1 INTRODUCTION
5.2 MARKET EVOLUTION
5.3 MARKET DYNAMICS
FIGURE 31 ENERGY AND UTILITIES ANALYTICS MARKET: DRIVERS, RESTRAINTS, OPPORTUNITIES, AND CHALLENGES
5.3.1 DRIVERS
5.3.1.1 Mounting adoption of smart meters to enable two-way communication between companies and customers
5.3.1.2 Prioritization of power generation planning and the need for accurate forecasting
5.3.1.3 Increasing investments in digital channels to improve customer processes, experience, and perceived customer value
5.3.1.4 Business need for operational efficiency and risk mitigation
5.3.2 RESTRAINTS
5.3.2.1 Legacy database technologies limiting utility effectiveness
5.3.2.2 Technological and analytical skills gaps within the existing workforce
5.3.2.3 Stringent government rules and regulations
5.3.3 OPPORTUNITIES
5.3.3.1 Increasing investments in smart grid and advanced metering infrastructure
5.3.3.2 Rising internet penetration and adoption of IoT devices
5.3.4 CHALLENGES
5.3.4.1 Inability to analyze streaming IoT data
5.3.4.2 COVID-19 to have a significant impact on the energy and utilities sector
5.4 CASE STUDIES
5.4.1 ELSTER USED MICROSTRATEGY TO UNLOCK BUSINESS INSIGHTS
5.4.2 ENEXIS ADOPTED SAS VISUAL ANALYTICS SOLUTION TO GIVE EMPLOYEES THE INSIGHTS THEY NEED, QUICKLY AND ACCURATELY
5.4.3 CEMIG IMPLEMENTED SAS ENTERPRISE MINER TO IDENTIFY ENERGY THEFTS
5.4.4 E.ON PARTNERED WITH TABLEAU TO GENERATE REAL-TIME, MAP-BASED ANALYSIS FOR SENSORS
5.4.5 A US-BASED UTILITY FIRM PARTNERED WITH COGNIZANT TO UPGRADE ITS LEGACY SYSTEMS
5.4.6 STORENGY IMPLEMENTED OPENTEXT ANALYTICS SUITE TO IMPROVE ITS DAILY REPORT GRANULARITY
5.4.7 CENTRICA ADOPTED CLOUDERA’S SOLUTIONS TO CREATE A CENTRALIZED IT INFRASTRUCTURE
5.4.8 MESHPOWER COLLABORATED WITH JAVELIN GROUP AND ALTERYX TO ANALYZE SITE SELECTION
5.4.9 TRANSPOWER NZ LTD. ADOPTED SCHNEIDER ELECTRIC SOLUTION TO HAVE CLEAR VISIBILITY INTO THE ENTIRE POWER SYSTEM
5.4.10 EATON TO PROVIDE KEY WIND POWER TECHNOLOGIES TO GUODIAN UNITED POWER TECHNOLOGY COMPANY LTD
5.5 ENERGY AND UTILITIES ANALYTICS: USE CASES
5.6 VALUE CHAIN ANALYSIS
FIGURE 32 VALUE CHAIN ANALYSIS
5.7 REGULATORY COMPLIANCES
5.7.1 GENERAL DATA PROTECTION REGULATION
5.7.2 FEDERAL ENERGY REGULATORY COMMISSION
5.7.3 EUROPEAN MARKET INFRASTRUCTURE REGULATION
5.7.4 HEALTH INSURANCE PORTABILITY AND ACCOUNTABILITY ACT OF 1996
5.8 ENERGY AND UTILITIES ANALYTICS: TYPES
5.9 ENERGY AND UTILITIES ANALYTICS: DATA FLOW MODEL
FIGURE 33 ENERGY AND UTILITIES ANALYTICS: DATA FLOW MODEL
5.10 FUTURE OUTLOOK
5.10.1 AI AND ANALYTICS
5.10.2 BLOCKCHAIN AND ANALYTICS
5.10.3 IOT AND ANALYTICS
5.10.4 SUSTAINABILITY ANALYTICS
5.10.5 CARBON FOOTPRINT AND ANALYTICS
5.10.6 CLEAN ENERGY AND ANALYTICS
6 COVID-19 IMPACT ON ENERGY AND UTILITIES ANALYTICS MARKET (Page No. - 85)
6.1 INTRODUCTION
FIGURE 34 ENERGY AND UTILITIES ANALYTICS MARKET TO DECLINE DURING 2020–2021 OWING TO COVID-19 PANDEMIC
7 ENERGY AND UTILITIES ANALYTICS MARKET, BY COMPONENT (Page No. - 87)
7.1 INTRODUCTION
7.1.1 COMPONENT: COVID-19 IMPACT
FIGURE 35 SERVICES SEGMENT TO REGISTER A HIGHER CAGR DURING THE FORECAST PERIOD
TABLE 4 ENERGY AND UTILITIES ANALYTICS MARKET SIZE, BY COMPONENT, 2018–2025 (USD MILLION)
7.2 SOLUTIONS
7.2.1 SOLUTIONS: ENERGY AND UTILITIES ANALYTICS MARKET DRIVERS
FIGURE 36 SOFTWARE SEGMENT TO REGISTER A HIGHER CAGR DURING THE FORECAST PERIOD
TABLE 5 SOLUTIONS: ENERGY AND UTILITIES ANALYTICS MARKET SIZE, BY TYPE, 2018–2025 (USD MILLION)
7.2.2 PLATFORM
7.2.3 SOFTWARE
7.3 SERVICES
7.3.1 SERVICES: ENERGY AND UTILITIES ANALYTICS MARKET DRIVERS
FIGURE 37 MANAGED SERVICES SEGMENT TO GROW AT A HIGHER CAGR DURING THE FORECAST PERIOD
TABLE 6 ENERGY AND UTILITIES ANALYTICS MARKET SIZE, BY SERVICE, 2018–2025 (USD MILLION)
7.3.2 MANAGED SERVICES
7.3.3 PROFESSIONAL SERVICES
FIGURE 38 SUPPORT AND MAINTENANCE SEGMENT TO GROW AT THE HIGHEST CAGR DURING THE FORECAST PERIOD
TABLE 7 PROFESSIONAL SERVICE MARKET SIZE, BY TYPE, 2018–2025 (USD MILLION)
7.3.3.1 Consulting
7.3.3.2 Support and maintenance
7.3.3.3 Deployment and integration
8 ENERGY AND UTILITIES ANALYTICS MARKET, BY DEPLOYMENT MODE (Page No. - 96)
8.1 INTRODUCTION
8.1.1 DEPLOYMENT MODE: COVID-19 IMPACT
FIGURE 39 CLOUD SEGMENT TO REGISTER A HIGHER CAGR DURING THE FORECAST PERIOD
TABLE 8 ENERGY AND UTILITIES ANALYTICS MARKET SIZE, BY DEPLOYMENT MODE, 2018–2025 (USD MILLION)
8.2 ON-PREMISES
8.2.1 ON-PREMISES: ENERGY AND UTILITIES ANALYTICS MARKET DRIVERS
8.3 CLOUD
8.3.1 CLOUD: ENERGY AND UTILITIES ANALYTICS MARKET DRIVERS
FIGURE 40 HYBRID CLOUD SEGMENT TO GROW AT THE HIGHEST CAGR DURING THE FORECAST PERIOD
TABLE 9 CLOUD: ENERGY AND UTILITIES ANALYTICS MARKET SIZE, BY TYPE, 2018–2025 (USD MILLION)
8.3.2 PUBLIC CLOUD
8.3.3 PRIVATE CLOUD
8.3.4 HYBRID CLOUD
9 ENERGY AND UTILITIES ANALYTICS MARKET, BY ORGANIZATION SIZE (Page No. - 102)
9.1 INTRODUCTION
9.1.1 ORGANIZATION SIZE: COVID-19 IMPACT
FIGURE 41 SMALL AND MEDIUM-SIZED ENTERPRISES SEGMENT TO REGISTER A HIGHER CAGR DURING THE FORECAST PERIOD
TABLE 10 ENERGY AND UTILITIES ANALYTICS MARKET SIZE, BY ORGANIZATION SIZE, 2018–2025 (USD MILLION)
9.2 LARGE ENTERPRISES
9.2.1 LARGE ENTERPRISES: ENERGY AND UTILITIES ANALYTICS MARKET DRIVERS
9.3 SMALL AND MEDIUM-SIZED ENTERPRISES
9.3.1 SMALL AND MEDIUM-SIZED ENTERPRISES: ENERGY AND UTILITIES ANALYTICS MARKET DRIVERS
10 ENERGY AND UTILITIES ANALYTICS MARKET, BY APPLICATION (Page No. - 106)
10.1 INTRODUCTION
FIGURE 42 UPSTREAM SEGMENT TO GROW AT THE HIGHEST CAGR DURING THE FORECAST PERIOD
TABLE 11 ENERGY AND UTILITIES ANALYTICS MARKET SIZE, BY APPLICATION, 2018–2025 (USD MILLION)
10.2 UPSTREAM APPLICATIONS
10.2.1 UPSTREAM APPLICATIONS: COVID-19 IMPACT
10.2.2 UPSTREAM APPLICATIONS: ENERGY AND UTILITIES ANALYTICS MARKET DRIVERS
FIGURE 43 PREDICTIVE ASSET ANALYTICS SEGMENT TO GROW AT THE HIGHEST CAGR DURING THE FORECAST PERIOD
TABLE 12 UPSTREAM APPLICATION: ENERGY AND UTILITIES ANALYTICS MARKET SIZE, BY TYPE, 2018–2025 (USD MILLION)
10.2.3 EXPLORATION AND DRILLING ANALYTICS
10.2.4 PRODUCTION PLANNING AND FORECASTING ANALYTICS
10.2.5 FIELD SURVEILLANCE ANALYTICS
10.2.6 WORKFORCE MANAGEMENT ANALYTICS
10.2.7 PREDICTIVE ASSET ANALYTICS
10.3 MIDSTREAM APPLICATIONS
10.3.1 MIDSTREAM APPLICATIONS: COVID-19 IMPACT
10.3.2 MIDSTREAM APPLICATIONS: ENERGY AND UTILITIES ANALYTICS MARKET DRIVERS
FIGURE 44 GRID ANALYTICS SEGMENT TO GROW AT THE HIGHEST CAGR DURING THE FORECAST PERIOD
TABLE 13 MIDSTREAM APPLICATION: ENERGY AND UTILITIES ANALYTICS MARKET SIZE, BY TYPE, 2018–2025 (USD MILLION)
10.3.3 LOGISTICS AND SUPPLY CHAIN ANALYTICS
10.3.4 GRID ANALYTICS
10.3.5 STORAGE OPTIMIZATION ANALYTICS
10.4 DOWNSTREAM APPLICATIONS
10.4.1 DOWNSTREAM APPLICATIONS: COVID-19 IMPACT
10.4.2 DOWNSTREAM APPLICATIONS: ENERGY AND UTILITIES ANALYTICS MARKET DRIVERS
FIGURE 45 ADVANCED METERING INFRASTRUCTURE ANALYTICS SEGMENT TO GROW AT THE HIGHEST CAGR DURING THE FORECAST PERIOD
TABLE 14 DOWNSTREAM APPLICATION: ENERGY AND UTILITIES ANALYTICS MARKET SIZE, BY TYPE, 2018–2025 (USD MILLION)
10.4.3 PRICING ANALYTICS
10.4.4 ADVANCED METERING INFRASTRUCTURE ANALYTICS
10.4.5 CUSTOMER ANALYTICS
10.4.6 CALL CENTER OPTIMIZATION
11 ENERGY AND UTILITIES ANALYTICS MARKET, BY VERTICAL (Page No. - 118)
11.1 INTRODUCTION
FIGURE 46 UTILITIES VERTICAL TO GROW AT A HIGHER CAGR DURING THE FORECAST PERIOD
TABLE 15 ENERGY AND UTILITIES ANALYTICS MARKET SIZE, BY VERTICAL, 2018–2025 (USD MILLION)
11.2 ENERGY
11.2.1 ENERGY: COVID-19 IMPACT
11.2.2 ENERGY VERTICAL: ENERGY AND UTILITIES ANALYTICS MARKET DRIVERS
FIGURE 47 RENEWABLE ENERGY VERTICAL TO GROW AT A THE HIGHEST CAGR DURING THE FORECAST PERIOD
TABLE 16 ENERGY: ENERGY AND UTILITIES ANALYTICS MARKET SIZE, BY TYPE, 2018–2025 (USD MILLION)
11.2.3 OIL AND GAS
11.2.4 RENEWABLE ENERGY
11.2.5 MINING
11.2.6 OTHERS
11.3 UTILITIES
11.3.1 UTILITIES: COVID-19 IMPACT
11.3.2 UTILITIES VERTICAL: ENERGY AND UTILITIES ANALYTICS MARKET DRIVERS
FIGURE 48 WATER VERTICAL TO GROW AT A THE HIGHEST CAGR DURING THE FORECAST PERIOD
TABLE 17 UTILITIES: ENERGY AND UTILITIES ANALYTICS MARKET SIZE, BY TYPE, 2018–2025 (USD MILLION)
11.3.3 ELECTRICITY
11.3.4 WATER
11.3.5 WASTE
12 ENERGY AND UTILITIES ANALYTICS MARKET, BY REGION (Page No. - 127)
12.1 INTRODUCTION
FIGURE 49 INDIA TO GROW AT THE HIGHEST CAGR DURING THE FORECAST PERIOD, BY COUNTRY
FIGURE 50 ASIA PACIFIC TO GROW AT THE HIGHEST CAGR DURING THE FORECAST PERIOD, BY REGION
TABLE 18 ENERGY AND UTILITIES ANALYTICS MARKET SIZE, BY REGION, 2018–2025 (USD MILLION)
12.2 NORTH AMERICA
12.2.1 NORTH AMERICA: ENERGY AND UTILITIES ANALYTICS MARKET DRIVERS
12.2.2 NORTH AMERICA: COVID-19 EFFECT
FIGURE 51 NORTH AMERICA: MARKET SNAPSHOT
TABLE 19 NORTH AMERICA: ENERGY AND UTILITIES ANALYTICS MARKET SIZE, BY COMPONENT, 2018–2025 (USD MILLION)
TABLE 20 NORTH AMERICA: ENERGY AND UTILITIES ANALYTICS MARKET SIZE, BY SOLUTION, 2018–2025 (USD MILLION)
TABLE 21 NORTH AMERICA: ENERGY AND UTILITIES ANALYTICS MARKET SIZE, BY SERVICE, 2018–2025 (USD MILLION)
TABLE 22 NORTH AMERICA: ENERGY AND UTILITIES ANALYTICS MARKET SIZE, BY PROFESSIONAL SERVICE, 2018–2025 (USD MILLION)
TABLE 23 NORTH AMERICA: ENERGY AND UTILITIES ANALYTICS MARKET SIZE, BY DEPLOYMENT MODE, 2018–2025 (USD MILLION)
TABLE 24 NORTH AMERICA: ENERGY AND UTILITIES ANALYTICS MARKET SIZE, BY CLOUD TYPE, 2018–2025 (USD MILLION)
TABLE 25 NORTH AMERICA: ENERGY AND UTILITIES ANALYTICS MARKET SIZE, BY ORGANIZATION SIZE, 2018–2025 (USD MILLION)
TABLE 26 NORTH AMERICA: ENERGY AND UTILITIES ANALYTICS MARKET SIZE, BY APPLICATION, 2018–2025 (USD MILLION)
TABLE 27 NORTH AMERICA: ENERGY AND UTILITIES ANALYTICS MARKET SIZE, BY UPSTREAM, 2018–2025 (USD MILLION)
TABLE 28 NORTH AMERICA: ENERGY AND UTILITIES ANALYTICS MARKET SIZE, BY MIDSTREAM, 2018–2025 (USD MILLION)
TABLE 29 NORTH AMERICA: ENERGY AND UTILITIES ANALYTICS MARKET SIZE, BY DOWNSTREAM, 2018–2025 (USD MILLION)
TABLE 30 NORTH AMERICA: NORTH AMERICA: ENERGY AND UTILITIES ANALYTICS MARKET SIZE, BY VERTICAL, 2018–2025 (USD MILLION)
TABLE 31 NORTH AMERICA: ENERGY AND UTILITIES ANALYTICS MARKET SIZE, BY ENERGY VERTICAL, 2018–2025 (USD MILLION)
TABLE 32 NORTH AMERICA: ENERGY AND UTILITIES ANALYTICS MARKET SIZE, BY UTILITIES VERTICAL, 2018–2025 (USD MILLION)
TABLE 33 NORTH AMERICA: ENERGY AND UTILITIES ANALYTICS MARKET SIZE, BY COUNTRY, 2018–2025 (USD MILLION)
12.2.3 UNITED STATES
12.2.3.1 United States: COVID-19 effect
TABLE 34 UNITED STATES: ENERGY AND UTILITIES ANALYTICS MARKET ANALYTICS SIZE, BY COMPONENT, 2018–2025 (USD MILLION)
12.2.4 CANADA
12.2.4.1 Canada: COVID-19 effect
TABLE 35 CANADA: ENERGY AND UTILITIES ANALYTICS MARKET SIZE, BY COMPONENT, 2018–2025 (USD MILLION)
12.3 EUROPE
12.3.1 EUROPE: ENERGY AND UTILITIES ANALYTICS MARKET DRIVERS
12.3.2 EUROPE: COVID-19 EFFECT
TABLE 36 EUROPE: ENERGY AND UTILITIES ANALYTICS MARKET SIZE, BY COMPONENT, 2018–2025 (USD MILLION)
TABLE 37 EUROPE: ENERGY AND UTILITIES ANALYTICS MARKET SIZE, BY SOLUTION, 2018–2025 (USD MILLION)
TABLE 38 EUROPE: ENERGY AND UTILITIES ANALYTICS MARKET SIZE, BY SERVICE, 2018–2025 (USD MILLION)
TABLE 39 EUROPE: ENERGY AND UTILITIES ANALYTICS MARKET SIZE, BY PROFESSIONAL SERVICE, 2018–2025 (USD MILLION)
TABLE 40 EUROPE: ENERGY AND UTILITIES ANALYTICS MARKET SIZE, BY DEPLOYMENT MODE, 2018–2025 (USD MILLION)
TABLE 41 EUROPE: ENERGY AND UTILITIES ANALYTICS MARKET SIZE, BY CLOUD TYPE, 2018–2025 (USD MILLION)
TABLE 42 EUROPE: ENERGY AND UTILITIES ANALYTICS MARKET SIZE, BY ORGANIZATION SIZE, 2018–2025 (USD MILLION)
TABLE 43 EUROPE: ENERGY AND UTILITIES ANALYTICS MARKET SIZE, BY APPLICATION, 2018–2025 (USD MILLION)
TABLE 44 EUROPE: ENERGY AND UTILITIES ANALYTICS MARKET SIZE, BY UPSTREAM, 2018–2025 (USD MILLION)
TABLE 45 EUROPE: ENERGY AND UTILITIES ANALYTICS MARKET SIZE, BY MIDSTREAM, 2018–2025 (USD MILLION)
TABLE 46 EUROPE: ENERGY AND UTILITIES ANALYTICS MARKET SIZE, BY DOWNSTREAM, 2018–2025 (USD MILLION)
TABLE 47 EUROPE: ENERGY AND UTILITIES ANALYTICS MARKET SIZE, BY VERTICAL, 2018–2025 (USD MILLION)
TABLE 48 EUROPE: ENERGY AND UTILITIES ANALYTICS MARKET SIZE, BY ENERGY VERTICAL, 2018–2025 (USD MILLION)
TABLE 49 EUROPE: ENERGY AND UTILITIES ANALYTICS MARKET SIZE, BY UTILITIES VERTICAL, 2018–2025 (USD MILLION)
TABLE 50 EUROPE: ENERGY AND UTILITIES ANALYTICS MARKET SIZE, BY COUNTRY, 2018–2025 (USD MILLION)
12.3.3 UNITED KINGDOM
12.3.3.1 United Kingdom: COVID-19 effect
TABLE 51 UNITED KINGDOM: ENERGY AND UTILITIES ANALYTICS MARKET SIZE, BY COMPONENT, 2018–2025 (USD MILLION)
12.3.4 GERMANY
12.3.4.1 Germany: COVID-19 effect
TABLE 52 GERMANY: ENERGY AND UTILITIES ANALYTICS MARKET SIZE, BY COMPONENT, 2018–2025 (USD MILLION)
12.3.5 REST OF EUROPE
12.3.5.1 Rest of Europe: COVID-19 effect
TABLE 53 REST OF EUROPE: ENERGY AND UTILITIES ANALYTICS MARKET SIZE, BY COMPONENT, 2018–2025 (USD MILLION)
12.4 ASIA PACIFIC
12.4.1 ASIA PACIFIC: ENERGY AND UTILITIES ANALYTICS MARKET DRIVERS
12.4.2 ASIA PACIFIC: COVID-19 EFFECT
FIGURE 52 ASIA PACIFIC: MARKET SNAPSHOT
TABLE 54 ASIA PACIFIC: ENERGY AND UTILITIES ANALYTICS MARKET SIZE, BY COMPONENT, 2018–2025 (USD MILLION)
TABLE 55 ASIA PACIFIC: ENERGY AND UTILITIES ANALYTICS MARKET SIZE, BY SOLUTION, 2018–2025 (USD MILLION)
TABLE 56 ASIA PACIFIC: ENERGY AND UTILITIES ANALYTICS MARKET SIZE, BY SERVICE, 2018–2025 (USD MILLION)
TABLE 57 ASIA PACIFIC: ENERGY AND UTILITIES ANALYTICS MARKET SIZE, BY PROFESSIONAL SERVICE, 2018–2025 (USD MILLION)
TABLE 58 ASIA PACIFIC: ENERGY AND UTILITIES ANALYTICS MARKET SIZE, BY DEPLOYMENT MODE, 2018–2025 (USD MILLION)
TABLE 59 ASIA PACIFIC: ENERGY AND UTILITIES ANALYTICS MARKET SIZE, BY CLOUD TYPE, 2018–2025 (USD MILLION)
TABLE 60 ASIA PACIFIC: ENERGY AND UTILITIES ANALYTICS MARKET SIZE, BY ORGANIZATION SIZE, 2018–2025 (USD MILLION)
TABLE 61 ASIA PACIFIC: ENERGY AND UTILITIES ANALYTICS MARKET SIZE, BY APPLICATION, 2018–2025 (USD MILLION)
TABLE 62 ASIA PACIFIC: ENERGY AND UTILITIES ANALYTICS MARKET SIZE, BY UPSTREAM, 2018–2025 (USD MILLION)
TABLE 63 ASIA PACIFIC: ENERGY AND UTILITIES ANALYTICS MARKET SIZE, BY MIDSTREAM, 2018–2025 (USD MILLION)
TABLE 64 ASIA PACIFIC: ENERGY AND UTILITIES ANALYTICS MARKET SIZE, BY DOWNSTREAM, 2018–2025 (USD MILLION)
TABLE 65 ASIA PACIFIC: ENERGY AND UTILITIES ANALYTICS MARKET SIZE, BY VERTICAL, 2018–2025 (USD MILLION)
TABLE 66 ASIA PACIFIC: ENERGY AND UTILITIES ANALYTICS MARKET SIZE, BY ENERGY VERTICAL, 2018–2025 (USD MILLION)
TABLE 67 ASIA PACIFIC: ENERGY AND UTILITIES ANALYTICS MARKET SIZE, BY UTILITIES VERTICAL, 2018–2025 (USD MILLION)
TABLE 68 ASIA PACIFIC: ENERGY AND UTILITIES ANALYTICS MARKET SIZE, BY COUNTRY, 2018–2025 (USD MILLION)
12.4.3 CHINA
12.4.3.1 China: COVID-19 effect
TABLE 69 CHINA: ENERGY AND UTILITIES ANALYTICS MARKET SIZE, BY COMPONENT, 2018–2025 (USD MILLION)
12.4.4 JAPAN
12.4.4.1 Japan: COVID-19 effect
TABLE 70 JAPAN: ENERGY AND UTILITIES ANALYTICS MARKET SIZE, BY COMPONENT, 2018–2025 (USD MILLION)
12.4.5 INDIA
12.4.5.1 India: COVID-19 effect
TABLE 71 INDIA: ENERGY AND UTILITIES ANALYTICS MARKET SIZE, BY COMPONENT, 2018–2025 (USD MILLION)
12.4.6 REST OF ASIA PACIFIC
12.4.6.1 Rest of Asia Pacific: COVID-19 effect
TABLE 72 REST OF ASIA PACIFIC: ENERGY AND UTILITIES ANALYTICS MARKET SIZE, BY COMPONENT, 2018–2025 (USD MILLION)
12.5 MIDDLE EAST AND AFRICA
12.5.1 MIDDLE EAST AND AFRICA: ENERGY AND UTILITIES ANALYTICS MARKET DRIVERS
12.5.2 MIDDLE EAST AND AFRICA: COVID-19 EFFECT
TABLE 73 MIDDLE EAST AND AFRICA: ENERGY AND UTILITIES ANALYTICS MARKET SIZE, BY COMPONENT, 2018–2025 (USD MILLION)
TABLE 74 MIDDLE EAST AND AFRICA: ENERGY AND UTILITIES ANALYTICS MARKET SIZE, BY SOLUTION, 2018–2025 (USD MILLION)
TABLE 75 MIDDLE EAST AND AFRICA: ENERGY AND UTILITIES ANALYTICS MARKET SIZE, BY SERVICE, 2018–2025 (USD MILLION)
TABLE 76 MIDDLE EAST AND AFRICA: ENERGY AND UTILITIES ANALYTICS MARKET SIZE, BY PROFESSIONAL SERVICE, 2018–2025 (USD MILLION)
TABLE 77 MIDDLE EAST AND AFRICA: ENERGY AND UTILITIES ANALYTICS MARKET SIZE, BY DEPLOYMENT MODE, 2018–2025 (USD MILLION)
TABLE 78 MIDDLE EAST AND AFRICA: ENERGY AND UTILITIES ANALYTICS MARKET SIZE, BY CLOUD TYPE, 2018–2025 (USD MILLION)
TABLE 79 MIDDLE EAST AND AFRICA: ENERGY AND UTILITIES ANALYTICS MARKET SIZE, BY ORGANIZATION SIZE, 2018–2025 (USD MILLION)
TABLE 80 MIDDLE EAST AND AFRICA: ENERGY AND UTILITIES ANALYTICS MARKET SIZE, BY APPLICATION, 2018–2025 (USD MILLION)
TABLE 81 MIDDLE EAST AND AFRICA: ENERGY AND UTILITIES ANALYTICS MARKET SIZE, BY UPSTREAM, 2018–2025 (USD MILLION)
TABLE 82 MIDDLE EAST AND AFRICA: ENERGY AND UTILITIES ANALYTICS MARKET SIZE, BY MIDSTREAM, 2018–2025 (USD MILLION)
TABLE 83 MIDDLE EAST AND AFRICA: ENERGY AND UTILITIES ANALYTICS MARKET SIZE, BY DOWNSTREAM, 2018–2025 (USD MILLION)
TABLE 84 MIDDLE EAST AND AFRICA: ENERGY AND UTILITIES ANALYTICS MARKET SIZE, BY VERTICAL, 2018–2025 (USD MILLION)
TABLE 85 MIDDLE EAST AND AFRICA: ENERGY AND UTILITIES ANALYTICS MARKET SIZE, BY ENERGY VERTICAL, 2018–2025 (USD MILLION)
TABLE 86 MIDDLE EAST AND AFRICA: ENERGY AND UTILITIES ANALYTICS MARKET SIZE, BY UTILITIES VERTICAL, 2018–2025 (USD MILLION)
TABLE 87 MIDDLE EAST AND AFRICA: ENERGY AND UTILITIES ANALYTICS MARKET SIZE, BY COUNTRY, 2018–2025 (USD MILLION)
12.5.3 KINGDOM OF SAUDI ARABIA
12.5.3.1 Kingdom of Saudi Arabia: COVID-19 effect
TABLE 88 KINGDOM OF SAUDI ARABIA: ENERGY AND UTILITIES ANALYTICS MARKET SIZE, BY COMPONENT, 2018–2025 (USD MILLION)
12.5.4 UNITED ARAB EMIRATES
12.5.4.1 United Arab Emirates: COVID-19 effect
TABLE 89 UNITED ARAB EMIRATES: ENERGY AND UTILITIES ANALYTICS MARKET SIZE, BY COMPONENT, 2018–2025 (USD MILLION)
12.5.5 SOUTH AFRICA
12.5.5.1 South Africa: COVID-19 effect
TABLE 90 SOUTH AFRICA: ENERGY AND UTILITIES ANALYTICS MARKET SIZE, BY COMPONENT, 2018–2025 (USD MILLION)
12.5.6 REST OF MIDDLE EAST AND AFRICA
12.5.6.1 Rest of Middle East and Africa: COVID-19 effect
TABLE 91 REST OF MIDDLE EAST AND AFRICA: ENERGY AND UTILITIES ANALYTICS MARKET SIZE, BY COMPONENT, 2018–2025 (USD MILLION)
12.6 LATIN AMERICA
12.6.1 LATIN AMERICA: ENERGY AND UTILITIES ANALYTICS MARKET DRIVERS
12.6.2 LATIN AMERICA: COVID-19 IMPACT
TABLE 92 LATIN AMERICA: ENERGY AND UTILITIES ANALYTICS MARKET SIZE, BY COMPONENT, 2018–2025 (USD MILLION)
TABLE 93 LATIN AMERICA: ENERGY AND UTILITIES ANALYTICS MARKET SIZE, BY SOLUTION, 2018–2025 (USD MILLION)
TABLE 94 LATIN AMERICA: ENERGY AND UTILITIES ANALYTICS MARKET SIZE, BY SERVICE, 2018–2025 (USD MILLION)
TABLE 95 LATIN AMERICA: ENERGY AND UTILITIES ANALYTICS MARKET SIZE, BY PROFESSIONAL SERVICE, 2018–2025 (USD MILLION)
TABLE 96 LATIN AMERICA: ENERGY AND UTILITIES ANALYTICS MARKET SIZE, BY DEPLOYMENT MODE, 2018–2025 (USD MILLION)
TABLE 97 LATIN AMERICA: ENERGY AND UTILITIES ANALYTICS MARKET SIZE, BY CLOUD TYPE, 2018–2025 (USD MILLION)
TABLE 98 LATIN AMERICA: ENERGY AND UTILITIES ANALYTICS MARKET SIZE, BY ORGANIZATION SIZE, 2018–2025 (USD MILLION)
TABLE 99 LATIN AMERICA: ENERGY AND UTILITIES ANALYTICS MARKET SIZE, BY APPLICATION, 2018–2025 (USD MILLION)
TABLE 100 LATIN AMERICA: ENERGY AND UTILITIES ANALYTICS MARKET SIZE, BY UPSTREAM, 2018–2025 (USD MILLION)
TABLE 101 LATIN AMERICA: ENERGY AND UTILITIES ANALYTICS MARKET SIZE, BY MIDSTREAM, 2018–2025 (USD MILLION)
TABLE 102 LATIN AMERICA: ENERGY AND UTILITIES ANALYTICS MARKET SIZE, BY DOWNSTREAM, 2018–2025 (USD MILLION)
TABLE 103 LATIN AMERICA: ENERGY AND UTILITIES ANALYTICS MARKET SIZE, BY VERTICAL, 2018–2025 (USD MILLION)
TABLE 104 LATIN AMERICA: ENERGY AND UTILITIES ANALYTICS MARKET SIZE, BY ENERGY VERTICAL, 2018–2025 (USD MILLION)
TABLE 105 LATIN AMERICA: ENERGY AND UTILITIES ANALYTICS MARKET SIZE, BY UTILITIES VERTICAL, 2018–2025 (USD MILLION)
TABLE 106 LATIN AMERICA: ENERGY AND UTILITIES ANALYTICS MARKET SIZE, BY COUNTRY, 2018–2025 (USD MILLION)
12.6.3 BRAZIL
12.6.3.1 Brazil: COVID-19 impact
TABLE 107 BRAZIL: ENERGY AND UTILITIES ANALYTICS MARKET SIZE, BY COMPONENT, 2018–2025 (USD MILLION)
12.6.4 MEXICO
12.6.4.1 Mexico: COVID-19 impact
TABLE 108 MEXICO: ENERGY AND UTILITIES ANALYTICS MARKET SIZE, BY COMPONENT, 2018–2025 (USD MILLION)
12.6.5 REST OF LATIN AMERICA
12.6.5.1 Rest of Latin America: COVID-19 impact
TABLE 109 REST OF LATIN AMERICA: ENERGY AND UTILITIES ANALYTICS MARKET SIZE, BY COMPONENT, 2018–2025 (USD MILLION)
13 COMPETITIVE LANDSCAPE (Page No. - 185)
13.1 KEY MARKET DEVELOPMENTS
13.1.1 NEW PRODUCT LAUNCHES AND PRODUCT ENHANCEMENTS
13.1.2 BUSINESS EXPANSIONS
13.1.3 MERGERS AND ACQUISITIONS
13.1.4 PARTNERSHIPS, AGREEMENTS, CONTRACTS, AND COLLABORATIONS
13.2 COMPETITIVE LEADERSHIP MAPPING
13.2.1 MARKET RANKING ANALYSIS, BY COMPANY
FIGURE 53 ENERGY AND UTILITIES ANALYTICS MARKET RANKING, BY COMPANY, 2020
13.2.2 STAR
13.2.3 EMERGING LEADER
13.2.4 PERVASIVE
13.2.5 EMERGING COMPANIES
FIGURE 54 ENERGY AND UTILITIES ANALYTICS MARKET (GLOBAL), COMPANY LEADERSHIP MAPPING, 2020
14 COMPANY PROFILES (Page No. - 193)
14.1 INTRODUCTION
(Business and Financial Overview, Solutions and Services Offered, Recent Developments, SWOT Analysis, and MnM View)*
14.2 MICROSOFT
FIGURE 55 MICROSOFT: COMPANY SNAPSHOT
FIGURE 56 MICROSOFT: SWOT ANALYSIS
14.3 EATON
FIGURE 57 EATON: COMPANY SNAPSHOT
FIGURE 58 EATON: SWOT ANALYSIS
14.4 IBM
FIGURE 59 IBM: COMPANY SNAPSHOT
FIGURE 60 IBM: SWOT ANALYSIS
14.5 SAP
FIGURE 61 SAP: COMPANY SNAPSHOT
FIGURE 62 SAP: SWOT ANALYSIS
14.6 GE
FIGURE 63 GE: COMPANY SNAPSHOT
FIGURE 64 GE: SWOT ANALYSIS
14.7 AWS
FIGURE 65 AWS: COMPANY SNAPSHOT
FIGURE 66 AWS: SWOT ANALYSIS
14.8 ORACLE
FIGURE 67 ORACLE: COMPANY SNAPSHOT
FIGURE 68 ORACLE: SWOT ANALYSIS
14.9 SCHNEIDER ELECTRIC
FIGURE 69 SCHNEIDER ELECTRIC: COMPANY SNAPSHOT
14.10 SIEMENS
FIGURE 70 SIEMENS: COMPANY SNAPSHOT
14.11 CISCO
FIGURE 71 CISCO: COMPANY SNAPSHOT
14.12 GOOGLE
FIGURE 72 GOOGLE: COMPANY SNAPSHOT
14.13 SAS INSTITUTE
FIGURE 73 SAS INSTITUTE: COMPANY SNAPSHOT
14.14 SALESFORCE
FIGURE 74 SALESFORCE: COMPANY SNAPSHOT
14.15 OPENTEXT
FIGURE 75 OPENTEXT: COMPANY SNAPSHOT
14.16 TERADATA
FIGURE 76 TERADATA: COMPANY SNAPSHOT
14.17 INTEL
FIGURE 77 INTEL: COMPANY SNAPSHOT
14.18 ATOS
FIGURE 78 ATOS: COMPANY SNAPSHOT
14.19 MICROSTRATEGY
FIGURE 79 MICROSTRATEGY: COMPANY SNAPSHOT
14.20 ALTERYX
FIGURE 80 ALTERYX: COMPANY SNAPSHOT
14.21 TIBCO SOFTWARE
14.22 QLIK
14.23 YELLOWFIN
14.24 BOARD INTERNATIONAL
14.25 INFOR
*Details on Business and Financial Overview, Solutions and Services Offered, Recent Developments, SWOT Analysis, and MnM View might not be captured in case of unlisted companies.
15 APPENDIX (Page No. - 268)
15.1 INDUSTRY EXPERTS
15.2 DISCUSSION GUIDE
15.3 KNOWLEDGE STORE: MARKETSANDMARKETS’ SUBSCRIPTION PORTAL
15.4 AVAILABLE CUSTOMIZATIONS
15.5 RELATED REPORTS
15.6 AUTHOR DETAILS
The study involved four major activities in estimating the current market size of the energy and utilities analytics market. Extensive secondary research was done to collect information on the market, peer market, and parent market. The next step was to validate these findings, assumptions, and sizing with industry experts across the value chain through primary research. Both top-down and bottom-up approaches were used to estimate the total market size. After that, the market breakup and data triangulation procedures were used to estimate the market size of the segments and subsegments of the market.
Secondary Research
In the secondary research process, various secondary sources such as The Electricity Journal, Journal of Energy Engineering, and the International Journal of Data Science and Analytics were referred to, for identifying and collecting information for this study. Secondary sources included annual reports; press releases and investor presentations of companies; whitepapers, certified publications, and articles by recognized authors; Research and Development (R&D) organizations; regulatory bodies; and databases. Journals, repositories, and resources from the Journal of Energy were referred to understand the integration of energy and utilities technology.
Primary Research
Various primary sources from both supply and demand sides were interviewed to obtain qualitative and quantitative information on the market. The primary sources from the supply side included various industry experts, including Chief Strategy Officers (CSOs); Vice Presidents (VPs); directors from business development, marketing, and product development/innovation teams; related key executives from energy and utilities analytics solution vendors, system integrators, professional service providers, industry associations, and consultants; and key opinion leaders. All possible parameters that affect the market covered in this research study have been accounted for, viewed in extensive detail, verified through primary research, and analyzed to get the final quantitative and qualitative data.
The following is the breakup of primary profiles:
To know about the assumptions considered for the study, download the pdf brochure
Market Size Estimation
Both top-down and bottom-up approaches were used to estimate and validate the total size of the energy and utilities analytics market. The top-down approach was used to derive the revenue contribution of top vendors and their offerings in the market. The bottom-up approach was used to arrive at the overall market size of the global market using key companies revenue and their offerings in the market. The research methodology used to estimate the market size includes the following:
- The key players in the market were identified through extensive secondary research.
- The market size, in terms of value, was determined through primary and secondary research processes.
- All percentages, shares, and breakups were determined using secondary sources and verified through primary sources.
Data Triangulation
After arriving at the overall market size using the market size estimation processes as explained above, the market was split into several segments and subsegments. To complete the overall market engineering process and arrive at the exact statistics of each market segment and subsegment, data triangulation and market breakup procedures were employed, wherever applicable. The overall market size was then used in the top-down procedure to estimate the size of other individual markets via percentage splits of the market segmentation.
Report Objectives
- To define, segment, and project the global market size of the energy and utilities analytics market
- To understand the structure of the market by identifying its various subsegments
- To provide detailed information about the key factors (drivers, restraints, opportunities, and industry-specific challenges) influencing the growth of the market
- To analyze micromarkets concerning individual growth trends, prospects, and contributions to the overall market
- To analyze the market by component, deployment mode, organization size, application, vertical, and region
- To project the size of the market and its submarkets, in terms of value, for North America, Europe, Asia Pacific (APAC), Middle East and Africa (MEA), and Latin America
- To profile key players and comprehensively analyze their core competencies
- To understand the competitive landscape and identify significant growth strategies adopted by players across key regions
- To analyze competitive developments, such as expansions and funding, new product launches, mergers and acquisitions, strategic partnerships, and agreements, in the market
Available customizations
With the given market data, MarketsandMarkets offers customizations as per the companys specific needs. The following customization options are available for the report:
Product analysis
- Product matrix provides a detailed comparison of the product portfolio of each company
Geographic analysis
- Further breakup of the North American energy and utilities analytics market
- Further breakup of the European market
- Further breakup of the APAC market
- Further breakup of the Latin American market
- Further breakup of the MEA market
Company information
- Detailed analysis and profiling of additional market players up to 5


Growth opportunities and latent adjacency in Energy and Utilities Analytics Market
Interested in the information on Global Building Energy(Electricity) Big Data Analytics Market or Global BEMS as SaaS market
Interested in the market size for data analytics across various industries by country or region specifically in energy, financial services, retail, insurance, manufacturing, etc.
Analyse the market trends of Solar Thermal industry which is concerned to the use of High Temp Fluid production.