Filter Integrity Test Market by Test Type (Bubble Point, Diffusion, Water Flow), Mechanism (Manual, Automation), Filter Type (Air, Liquid), End User (Biopharmaceutical Companies, Contract Manufacturing Organizations, Academics) - Global Forecast to 2024


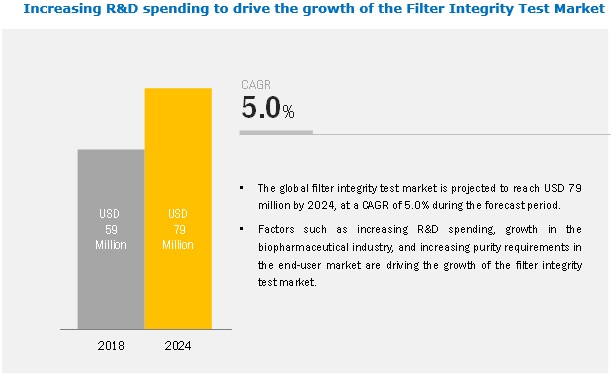
[106 Pages Report] The filter integrity test market is projected to reach USD 79 million by 2024 from USD 59 million in 2018, at a CAGR of 5.0% during the forecast period. Factors such as increasing R&D spending, growth in the biopharmaceutical industry, and increasing purity requirements in the end-user market are driving the growth of the market.
By type, the diffusion test segment to register the highest growth rate in the filter integrity test market during the forecast period.
Based on type, the market is segmented into diffusion test, water flow integrity test, and bubble point test. In 2018, the diffusion test segment accounted for the largest share of the filter integrity test market. This segment is also expected to witness the highest growth during the forecast period. The advantages offered by the diffusion testing method such as high sensitivity, high margin of safety, and testing of the complete filter system (cartridge and housing) are supporting the growth of this segment.
By mechanism, the automated filter integrity test segment to register the highest growth during the forecast period.
Based on mechanism, the filter integrity test market is segmented into automated and manual filter integrity tests. Integrity tests based on the automated mechanism accounted for the larger share of the market in 2018. In automated integrity testing, the data is not manually entered into the integrity test instrument, which reduces the risk of human error. Moreover, the filter can be tested in-line without the user having to initiate the test manually, and test results are automatically transferred to a data storage module. These advantages are supporting the growth of the automated integrity test segment.
Pharmaceutical and biopharmaceutical companies are the largest and fastest-growing end users of the filter integrity test market.
Based on end user, the filter integrity test market is segmented into pharmaceutical and biopharmaceutical companies, CMOs, and other end users. In 2018, the pharmaceutical and biopharmaceutical companies segment accounted for the largest share of the market. This segment is also expected to witness the highest growth during the forecast period owing to the growing biopharmaceutical industry, significant growth in the biologics market, and stringent government guidelines for purity requirements in pharmaceutical and biotechnology manufacturing.
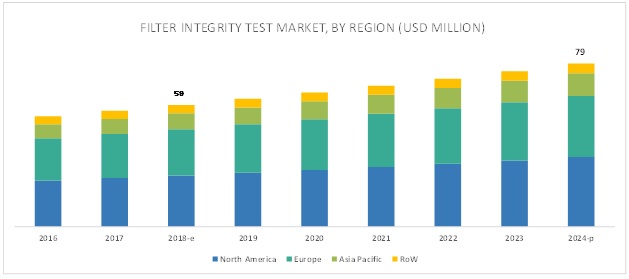
North America accounted for the largest share of the filter integrity test market in 2018.
The market is divided into four major regions—North America, Europe, Asia Pacific, and the Rest of the World (RoW). In 2018, North America accounted for the largest share of the market, followed by Europe. The increasing demand for biopharmaceuticals and implementation of drug safety guidelines by the FDA are the major factors driving the growth of the filter integrity test industry in North America.
The market in the Asia Pacific is estimated to grow at the highest CAGR during the forecast period. Significant investments by key market players, increasing government support, developing R&D infrastructure, and growing expertise and academic excellence are the major factors fueling the growth of the market in the Asia Pacific.
The major players in the filter integrity test market are Merck KGaA (Germany), Danaher Corporation/Pall Corporation (US), Sartorius (Germany), Donaldson Company (US), Parker Hannifin Corporation (US), Meissner Filtration Product (US), MDI Filtration Technologies (US), Thermo Fisher Scientific (US), Eaton Corporation (Ireland), and SH-Surway (China).
Sartorius is a prominent player in the market. The company has a wide range of product offerings, which include filter integrity tests, transfer equipment, bottles, and bags. The company mainly focuses on product innovation and has a strong geographic presence in Europe, the Americas, and the Asia Pacific. The company is expected to grow at a positive rate in the market due to its superior product offerings.
Merck is another major player in the filter integrity test market. The company has a strong geographic presence across the Americas, Europe, Asia Pacific, and the Middle East and Africa. Merck focuses on inorganic strategies to maintain its leading position in this market. For instance, in 2018, the company signed a MoU with Schneider Electric (France) to automate biopharmaceutical processes for China’s biopharmaceutical industry.
Scope of the Report
|
Report Metric |
Details |
|
Market size available for years |
2016–2024 |
|
Base year considered |
2017 |
|
Forecast period |
2018–2024 |
|
Forecast units |
Values (USD Million) |
|
Segments covered |
Type, Filter Type, Mechanism, End User, and Region |
|
Geographies covered |
North America, Europe, APAC, and the RoW |
|
Companies covered |
10 major players covered in total, including Merck KGaA (Germany), Danaher Corporation/Pall Corporation (US), and Sartorius (Germany) |
This research report categorizes the filter integrity test market based on type, filter type, mechanism, end user, and region.
On the basis of Type, the filter integrity test market is segmented as follows:
- Diffusion Test
- Bubble Point Test
- Water Flow Integrity Test
On the basis of Filter Type, the filter integrity test market is segmented as follows:
- Liquid
- Air
On the basis of Mechanism, the filter integrity test market is segmented as follows:
- Automated
- Manual
On the basis of End user, the filter integrity test market is segmented as follows:
- Pharmaceutical and Biotechnology Companies
- Contract Manufacturing Organizations
- Other End Users (Research Laboratories and Institutes)
On the basis of Region, the filter integrity test market is segmented as follows:
-
North America
- US
- Canada
- Europe
-
Asia Pacific
- China
- Japan
- India
- Rest of Asia Pacific
- RoW
Recent Developments:
- In 2018, Thermo Fisher Scientific opened the new Bioprocess Design Center in Shanghai, China to connect and collaborate with biologic developers to design bioprocessing solutions.
- Merck opened a new manufacturing and distribution center for its life science business in Mumbai, India to increase its gross domestic product storage and meet future bioproduction demand.
- Thermo Fisher Scientific acquired the Advanced Bioprocessing business from Becton, Dickinson and Company. With this acquisition, the company expanded its product portfolio of life sciences solutions.
Key questions addressed by the report:
- Who are the major players in the market?
- What are the regional growth trends and the largest revenue-generating region for the filter integrity test market?
- What are the major drivers and opportunities of the filter integrity test market?
- Which is the major test type of filter integrity test?
- Who are the major end users of the filter integrity test market?
To speak to our analyst for a discussion on the above findings, click Speak to Analyst
 Exclusive indicates content/data unique to MarketsandMarkets and not available with any competitors.
Table of Contents
1 Introduction (Page No. - 13)
1.1 Objectives of the Study
1.2 Market Definition
1.3 Market Scope
1.3.1 Markets Covered
1.3.2 Years Considered for the Study
1.4 Currency
1.5 Limitations
1.6 Stakeholders
2 Research Methodology (Page No. - 16)
2.1 Research Data
2.1.1 Secondary Sources
2.1.2 Key Data From Secondary Sources
2.1.3 Primary Sources
2.1.3.1 Key Industry Insights
2.1.4 Key Data From Primary Sources
2.2 Market Size Estimation
2.3 Market Breakdown and Data Triangulation
3 Executive Summary (Page No. - 23)
3.1 Introduction
4 Premium Insights (Page No. - 28)
4.1 Filter Integrity Test: Market Overview
4.2 North America: Market, By Mechanism (2018)
4.3 Market, By Filter Type (2018 vs 2024)
4.4 Market, By End User (2018 vs 2024)
4.5 Geographical Snapshot of the Filter Integrity Test Market
5 Market Overview (Page No. - 31)
5.1 Introduction
5.2 Market Dynamics
5.2.1 Drivers
5.2.1.1 Increase in R&D Spending
5.2.1.2 Growth in the Biopharmaceutical Industry
5.2.1.3 Increasing Purity Requirements in the End-User Market
5.2.2 Opportunities
5.2.2.1 Rising Opportunities in Emerging Markets
5.2.2.2 Creation and Use of Advanced Filters
6 Filter Integrity Test Market, By Type (Page No. - 34)
6.1 Introduction
6.2 Diffusion Test
6.2.1 Diffusional Flow Test to Register the Highest Growth During the Forecast Period
6.3 Water Flow Integrity Test
6.3.1 Water Flow Integrity Test is Time-Consuming and Suitable Only in Clean Operating Environments
6.4 Bubble Point Test
6.4.1 Bubble Point Test is Less Sensitive as Compared to Pressure Decay/Diffusional Flow
7 Filter Integrity Test Market, By Filter Type (Page No. - 40)
7.1 Introduction
7.2 Liquid Filter Integrity Test
7.2.1 Liquid Filter Integrity Test Will Continue to Dominate the Market in 2024
7.3 Air Filter Integrity Test
7.3.1 Air Filter Integrity Testing is Used for Pharmaceutical and Biotechnological Production Systems
8 Filter Integrity Test Market, By Mechanism (Page No. - 45)
8.1 Introduction
8.2 Automated Filter Integrity Test
8.2.1 Automated Filter Integrity Test Accounted for the Largest Share of the Filter Integrity Test Market in 2018
8.3 Manual Filter Integrity Test
8.3.1 Manual Filter Integrity Test Accounts for A Relatively Smaller Share of the Market Due to the Increased Preference for Automated Integrity Test in the Pharmaceutical Industry
9 Filter Integrity Test Market, By End User (Page No. - 50)
9.1 Introduction
9.2 Pharmaceutical and Biopharmaceutical Companies
9.2.1 Pharmaceutical and Biopharmaceutical Companies are the Largest End-Users of Filter Integrity Tests
9.3 Contract Manufacturing Organizations
9.3.1 Benefits of Outsourcing Have Driven the Preference for Contract Manufacturing
9.4 Other End Users
9.4.1 Research Laboratories are Emerging as One of the Fastest-Growing End-User Segments
10 Filter Integrity Test Market, By Region (Page No. - 56)
10.1 Introduction
10.2 North America
10.2.1 US
10.2.1.1 Growing R&D Investments in the US to Drive Market Growth
10.2.2 Canada
10.2.2.1 Availability of Funds for Pharmaceutical and Biopharmaceutical Research is A Key Market Driver in Canada
10.3 Europe
10.3.1 Growing Health Awareness and Safety Concerns in the Pharmaceutical Industry to Boost the Filter Integrity Test Market in Europe
10.4 Asia Pacific
10.4.1 High Focus on Healthcare Modernization Among Major Economies in the Asia Pacific Region to Create Growth Opportunities
10.4.2 China
10.4.2.1 Increasing Government Support for Biologics Manufacturing to Support Market Growth in China
10.4.3 Japan
10.4.3.1 Growing Geriatric Population and Increasing Need of Biopharmaceuticals – Key Factors Driving Market Growth in Japan
10.4.4 India
10.4.4.1 Expanding Pharmaceutical Industry to Support Market Growth in India
10.4.5 Rest of Asia Pacific
10.5 Rest of the World
11 Competitive Landscape (Page No. - 78)
11.1 Introduction
11.2 Market Ranking Analysis, 2017
11.3 Competitive Leadership Mapping
11.3.1 Visionary Leaders
11.3.2 Innovators
11.3.3 Dynamic Differentiators
11.3.4 Emerging Players
11.4 Competitive Situation and Trends
11.4.1 Expansion
11.4.2 Acquisitions
12 Company Profiles (Page No. - 82)
(Business Overview, Products Offered, Recent Developments, MnM View)*
12.1 Danaher Corporation
12.2 Merck KGaA
12.3 Sartorius AG
12.4 Thermo Fisher Scientific
12.5 Meissner Filtration Products
12.6 Donaldson Company
12.7 Parker Hannifin Corp
12.8 Eaton Corporation PLC
12.9 Mdi Membrane Technologies
12.10 Sh-Surway
*Business Overview, Products Offered, Recent Developments, MnM View Might Not Be Captured in Case of Unlisted Companies.
13 Appendix (Page No. - 100)
13.1 Discussion Guide
13.2 Knowledge Store: Marketsandmarkets’ Subscription Portal
13.3 Available Customizations
13.4 Related Reports
13.5 Author Details
List of Tables (80 Tables)
Table 1 Market, By Type, 2016–2024 (USD Million)
Table 2 Diffusion Test Market, By Region, 2016–2024 (USD Million)
Table 3 North America: Diffusion Test Market, By Country, 2016–2024 (USD Million)
Table 4 Asia Pacific: Diffusion Test Market, By Country, 2016–2024 (USD Million)
Table 5 Water Flow Integrity Test Market, By Region, 2016–2024 (USD Million)
Table 6 North America: Water Flow Integrity Test Market, By Country, 2016–2024 (USD Million)
Table 7 Asia Pacific: Water Flow Integrity Test Market, By Country, 2016–2024 (USD Million)
Table 8 Bubble Point Test Market, By Region, 2016–2024 (USD Million)
Table 9 North America: Bubble Point Test Market, By Country, 2016–2024 (USD Million)
Table 10 Asia Pacific: Bubble Point Test Market, By Country, 2016–2024 (USD Million)
Table 11 Market, By Filter Type, 2016–2024 (USD Million)
Table 12 Liquid Filter Integrity Test Market, By Region, 2016–2024 (USD Million)
Table 13 North America: Liquid Filter Integrity Test Market, By Country, 2016–2024 (USD Million)
Table 14 Asia Pacific: Liquid Filter Integrity Test Market, By Country, 2016–2024 (USD Million)
Table 15 Air Filter Integrity Test Market, By Region, 2016–2024 (USD Million)
Table 16 North America: Air Filter Integrity Test Market, By Country, 2016–2024 (USD Million)
Table 17 Asia Pacific: Air Filter Integrity Test Market, By Country, 2016–2024 (USD Million)
Table 18 Market, By Mechanism, 2016–2024 (USD Million)
Table 19 Automated Filter Integrity Test Market, By Region, 2016–2024 (USD Million)
Table 20 North America: Automated Filter Integrity Test Market, By Country, 2016–2024 (USD Million)
Table 21 Asia Pacific: Automated Filter Integrity Test Market, By Country, 2016–2024 (USD Million)
Table 22 Manual Filter Integrity Test Market, By Region, 2016–2024 (USD Million)
Table 23 North America: Manual Filter Integrity Test Market, By Country, 2016–2024 (USD Million)
Table 24 Asia Pacific: Manual Filter Integrity Test Market, By Country, 2016–2024 (USD Million)
Table 25 Market, By End User, 2016–2024 (USD Million)
Table 26 Market for Pharmaceutical and Biopharmaceutical Companies, By Region, 2016–2024 (USD Million)
Table 27 North America: Market for Pharmaceutical and Biopharmaceutical Companies, By Country, 2016–2024 (USD Million)
Table 28 Asia Pacific: Market for Pharmaceutical and Biopharmaceutical Companies, By Country, 2016–2024 (USD Million)
Table 29 Market for Contract Manufacturing Organizations, By Region, 2016–2024 (USD Million)
Table 30 North America: Market for Contract Manufacturing Organizations, By Country, 2016–2024 (USD Million)
Table 31 Asia Pacific: Market for Contract Manufacturing Organizations, By Country, 2016–2024 (USD Million)
Table 32 Market for Other End Users, By Region, 2016–2024 (USD Million)
Table 33 North America: Market for Other End Users, By Country, 2016–2023 (USD Million)
Table 34 Asia-Pacific: Market for Others, By Country, 2016–2024 (USD Million)
Table 35 Market, By Region, 2016–2024 (USD Million)
Table 36 North America: Market, By Country, 2016–2024 (USD Million)
Table 37 North America: Market, By Mechanism, 2016–2024 (USD Million)
Table 38 North America: Market, By Filter Type, 2016–2024 (USD Million)
Table 39 North America: Market, By Test Type, 2016–2024 (USD Million)
Table 40 North America: Market, By End User, 2016–2024 (USD Million)
Table 41 US: Market, By Mechanism, 2016–2024 (USD Million)
Table 42 US: Market, By Filter Type, 2016–2024 (USD Million)
Table 43 US: Market, By Test Type, 2016–2024 (USD Million)
Table 44 US: Market, By End User, 2016–2024 (USD Million)
Table 45 Canada: Market, By Mechanism, 2016–2024 (USD Million)
Table 46 Canada: Market, By Filter Type, 2016–2024 (USD Million)
Table 47 Canada: Market, By Test Type, 2016–2024 (USD Million)
Table 48 Canada: Market, By End User, 2016–2024 (USD Million)
Table 49 Europe: Market, By Mechanism, 2016–2024 (USD Million)
Table 50 Europe: Market, By Filter Type, 2016–2024 (USD Million)
Table 51 Europe: Market, By Test Type, 2016–2024 (USD Million)
Table 52 Europe: Market, By End User, 2016–2024 (USD Million)
Table 53 Asia Pacific: Market, By Country, 2016–2024 (USD Million)
Table 54 Asia Pacific: Market, By Mechanism, 2016–2024 (USD Million)
Table 55 Asia Pacific: Market, By Filter Type, 2016–2024 (USD Million)
Table 56 Asia Pacific: Market, By Test Type, 2016–2024 (USD Million)
Table 57 Asia Pacific: Market, By End User, 2016–2024 (USD Million)
Table 58 China: Market, By Mechanism, 2016–2024 (USD Million)
Table 59 China: Market, By Filter Type, 2016–2024 (USD Million)
Table 60 China: Market, By Test Type, 2016–2024 (USD Million)
Table 61 China: Market, By End User, 2016–2024 (USD Million)
Table 62 Japan: Market, By Mechanism, 2016–2024 (USD Million)
Table 63 Japan: Market, By Filter Type, 2016–2024 (USD Million)
Table 64 Japan: Market, By Test Type, 2016–2024 (USD Million)
Table 65 Japan: Market, By End User, 2016–2024 (USD Million)
Table 66 India: Market, By Mechanism, 2016–2024 (USD Million)
Table 67 India: Market, By Filter Type, 2016–2024 (USD Million)
Table 68 India: Market, By Test Type, 2016–2024 (USD Million)
Table 69 India: Market, By End User, 2016–2024 (USD Million)
Table 70 RoAPAC: Market, By Mechanism, 2016–2024 (USD Million)
Table 71 RoAPAC: Market, By Filter Type, 2016–2024 (USD Million)
Table 72 RoAPAC: Market, By Test Type, 2016–2024 (USD Million)
Table 73 RoAPAC: Market, By End User, 2016–2024 (USD Million)
Table 74 RoW: Market, By Mechanism, 2016–2024 (USD Million)
Table 75 RoW: Market, By Filter Type, 2016–2024 (USD Million)
Table 76 RoW: Market, By Test Type, 2016–2024 (USD Million)
Table 77 RoW: Market, By End User, 2016–2024 (USD Million)
Table 78 Market Ranking, By Key Player (2017)
Table 79 Expansions, 2016–2018
Table 80 Acquisitions, 2016–2018
List of Figures (27 Figures)
Figure 1 Research Design
Figure 2 Primary Sources
Figure 3 Market: Top-Down Approach
Figure 4 Market: Bottom-Up Approach
Figure 5 Data Triangulation Methodology
Figure 6 Market, By Mechanism, 2018 vs 2024 (USD Million)
Figure 7 Market, By Filter Type, 2018 vs 2024 (USD Million)
Figure 8 Market, By End User, 2018 vs 2024 (USD Million)
Figure 9 Market, By Type, 2018 vs 2024 (USD Million)
Figure 10 Geographical Snapshot of the Market
Figure 11 Increasing R&D Spending Across the Globe is the Major Factor Driving the Market
Figure 12 Automated Filter Integrity Test Segment Accounted for the Largest Share of the North American Market in 2018
Figure 13 Liquid Filter Integrity Test Segment Will Continue to Dominate the Market in 2024
Figure 14 Pharmaceutical & Biopharmaceutical Companies Segment Will Continue to Dominate the Market in 2024
Figure 15 Asia Pacific to Witness the Highest Growth in the Market During the Forecast Period
Figure 16 Filter Integrity Tests Market: Drivers and Opportunities
Figure 17 Increasing R&D Investments
Figure 18 North America: Market Snapshot
Figure 19 Asia Pacific: Market Snapshot
Figure 20 Competitive Leadership Mapping of the Market
Figure 21 Danaher: Company Snapshot ( 2017)
Figure 22 Merck KGaA: Company Snapshot (2017)
Figure 23 Sartorius AG: Company Snapshot (2017)
Figure 24 Thermo Fisher Scientific: Company Snapshot (2017)
Figure 25 Donaldson Company, Inc.: Company Snapshot (2018)
Figure 26 Parker Hannifin Corp: Company Snapshot (2018)
Figure 27 Eaton Corporation: Company Snapshot (2017)
The study involved 4 major activities in estimating the current market size for filter integrity test. Exhaustive secondary research was done to collect information on the market as well as its peer and parent markets. The next step was to validate these findings, assumptions, and sizing with industry experts across the value chain through primary research. Both the top-down and bottom-up approaches were employed to estimate the complete market size. Thereafter, market breakdown and data triangulation were used to estimate the market size of segments and subsegments.
Secondary Research
In the secondary research process, various secondary sources such as Hoovers, Bloomberg Business, Forbes, and Dun & Bradstreet have been referred to, so as to identify and collect information useful for the technical, market-oriented, and commercial study of the filter integrity test market. These secondary sources include annual reports, press releases & investor presentations of companies, Bio-Process Systems Alliance (BPSA), BioProcess International, BioPharm International, National Center for Biotechnology Information, and Life Science Leader. Secondary research was mainly used to obtain key information about the industry’s supply chain, the total pool of key players, and market classification and segmentation according to the industry trends to the bottom-most level and regional markets. It was also used to obtain information about the key developments from a market-oriented perspective.
Primary Research
The filter integrity test market comprises several stakeholders such as raw material suppliers, manufacturers of filter integrity test, and regulatory organizations in the supply chain. Various primary sources from both the supply and demand sides of the market were interviewed to obtain qualitative and quantitative information. The primary interviewees from the demand side include key opinion leaders in research laboratories, academic institutes, and pharmaceutical & biotechnology companies. The primary sources from the supply side include key opinion leaders, distributors, and filter integrity test manufacturers. Various primary sources from both the supply and demand sides of the market were interviewed to obtain qualitative and quantitative information. Given below is the breakdown of the primary respondents:
To know about the assumptions considered for the study, download the pdf brochure
Market Size Estimation
Both the top-down and bottom-up approaches were used to estimate and validate the total size of the filter integrity test market. These approaches were also used extensively to estimate the size of various subsegments in the market. The research methodology used to estimate the market size includes the following:
- Key players have been identified through extensive secondary research.
- The filter integrity test industry’s value chain and market size, in terms of value have been determined through primary and secondary research.
- All percentage shares, splits, and breakdowns have been determined using secondary sources and verified through primary sources.
- All possible parameters that affect the market covered in this research study have been accounted for, viewed in extensive detail, verified through primary research, and analyzed to obtain the final quantitative and qualitative data.
Data Triangulation
After arriving at the overall market size—using the market size estimation processes explained above—the market was split into several segments and subsegments. To complete the overall market engineering process and arrive at the exact statistics of each market segment and subsegment, data triangulation and market breakdown procedures were employed, wherever applicable. The data was triangulated by studying various factors and trends from both the demand and supply sides of the filter integrity test industry.
Report Objectives
- To define, segment, and project the global market size for filter integrity test
- To understand the structure of the filter integrity test market by identifying its various subsegments
- To provide detailed information about the key factors influencing the growth of the market (drivers, restraints, and opportunities)
- To project the size of the market and its submarkets, in terms of value and volume, with respect to 4 regions (along with their respective key countries)
- To profile key players and comprehensively analyze their core competencies
- To understand the competitive landscape and identify the major growth strategies adopted by players across key regions
- To analyze the competitive developments such as expansions and acquisitions in the filter integrity test market
Available Customizations
With the given market data, MarketsandMarkets offers customizations according to company-specific scientific needs.
The following customization options are available for the report:
Regional Analysis
- Further breakdown of the European filter integrity test market, by country

 Generating Response ...


Growth opportunities and latent adjacency in Filter Integrity Test Market