Gamification Market by Component (Solution and Services), Deployment (Cloud and On-premises), Organization Size (SMEs and Large Enterprises), Application, End-User (Enterprise-Driven and Consumer-Driven), Vertical, and Region - Global Forecast to 2025


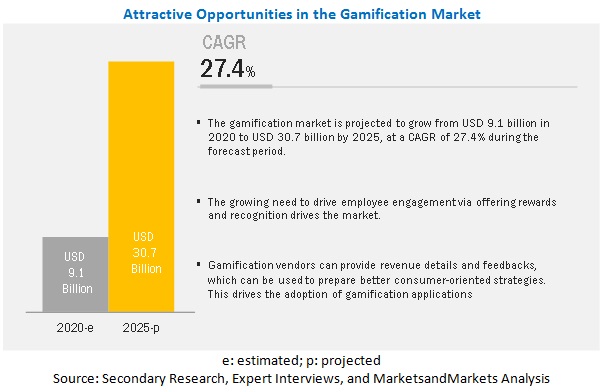
The gamification market size is projected to grow from USD 9.1 billion in 2020 to USD 30.7 billion by 2025, at a Compound Annual Growth Rate (CAGR) of 27.4% during the forecast period. The major factors driving the growth of the gamification market include rewards and recognition to employees over performance to boost employee engagement, provision of lucrative offers to the customers and consumers, and gamification yielding higher Return on Investment (RoI).
Services segment to grow at the higher CAGR during the forecast period
Based on components, the services segment of the gamification market is projected to grow at the higher CAGR during the forecast period. Gamification service providers render a variety of services, which are categorized into consulting, implementation, and support and maintenance services. These services provide end-users with services for gamification solution development and smooth installation, deployment, and maintenance of ongoing solutions. Certain service providers assist end-users in customized solution development for their organization. These service providers handle the implementation of solutions that are tailored to fit the business processes, such as customized solutions
Telecom segment to grow at a highest CAGR during the forecast period
Based on verticals, telecom segment to grow at highest growth rate during the forecast period. Telecom companies also face severe competition from other service providers, due to which the adoption of a customer-centric approach has become very crucial. Increasing the number of subscribers with consistent experiences across all channels is the main goal of companies, which can be achieved only through customer-focused offerings. Since the customer has become highly informed and is likely to avail multiple services, companies have to incorporate gamification in their business models. These companies have limited jurisdiction over the content and offerings, but the customer is going to hold them accountable for quality and availability. With the gamification solution, companies can know about consumer satisfaction and engage them for new offers and rewards.
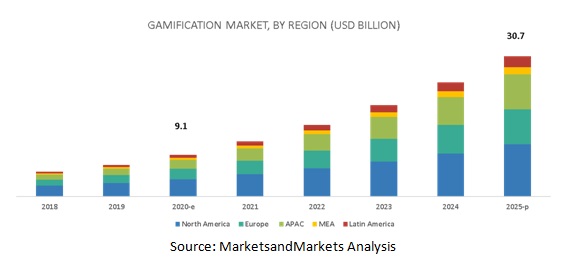
North America to record the highest market share in 2020
The North America region has been a predominately receptive market toward the adoption of gamification solutions. There has been an expansive usage of the internet to connect with various channel partners and clients among enterprises. The high adoption of customer-based solutions and enterprise-based solutions are driving the gamification market in North America. Moreover, in this region, countries such as the US and Canada are adopting gamification solutions to enrich their marketing activities with better advertising, customer interaction, and branding and selling. Furthermore, the rising demand for cloud-based gamified solutions among enterprises due to its low implementation cost has helped the gamification market to grow at a significant pace. Presently, the gamification market in North America is contributing a large portion of revenue as compared to the other regions.
Key Market Players
Key market players profiled in this report include Microsoft (US), SAP (Germany), BI WORLDWIDE (US), Verint (US) Aon (UK), Hoopla (US), Centrical (US), Mambo.IO (UK), MPS Interactive Systems (India), Influitive (Canada), LevelEleven (US), Ambition (US), Axonify Inc. (Canada), Gamifier (Latin America), IActionable (US), Khoros (US), Scrimmage (US), Xoxoday (India), Tango Card (US), and NIIT (US). These players have adopted various growth strategies, such as partnerships and new service launches to expand their presence further in the gamification market and broaden their customer base.
SAP offers its SAP cloud platform gamification, which helps in the rapid integration of gamification concepts into applications. This solution includes an online development and operations environment called gamification workbench to implement and analyze gamification concepts. The company�s gamification solution provides support for sophisticated concepts, covering time constraints, complex nested missions, and collaborative games. It also has a built-in analytics module that helps in advanced analysis of the player's behavior for continuous improvement of game concepts. The company uses gamification in multiple applications, such as SAP Community Network, SAP TwoGo, SAP Fitness application, and other SAP applications. SAP is also known to be taking interest in the gamification market as the company made multiple acquisitions over the past few years. It acquired CallidusCloud, a provider of cloud-based solutions for sales effectiveness, sales performance management, and sales execution software and services in April 2018. It further acquired Gigya, a provider of customer identity and access management platform, in September 2017. These acquisitions will help SAP to increase its offerings in gamification market as the acquired companies were prominent players in the gamification market.
Recent Developments
- In September 2019, Microsoft added new features and applications for Dynamics 365 by adding AI-driven insights. This product enhancement will empower organizations to take informed actions and improve their customer experiences.
- In January 2019, SAP acquired Qualtrics, an experience management software provider. This acquisition will help SAP to deliver exceptional customer, employee, product, and brand experiences. This acquisition will accelerate SAP�s new experience management category by combining Qualtrics� experience data with operational data from the SAP software.
- In January 2020, BI WORLDWIDE partnered with Vitality, a behavior change platform provider. Both companies collaborated to improve the overall employee health. BI WORLDWIDE�s recognition system is integrated with the new Vitality One program to reward employees for leading active and healthy lifestyles
- In August 2019, Verint partnered with the authorities of the city of Barrie, Ontario. This partnership helped Barrie city to simplify, modernize, and automate its customer service operations for improved overall customer experience and employee satisfaction. Verint used its engagement management offerings to help Barrie expand its access and support to all citizens across channels, including the city�s customer portal, online forms, and web chat.
- In April 2018, SAP acquired Callidus Software, a provider of enterprise software and Software-as-a-Service (SaaS). This acquisition helped SAP strengthen its intelligent customer experience suite of solutions. This acquisition will help SAP to strengthen its front office suite from only Customer Relationship Management (CRM) to an intelligent customer experience suite. The front office suite consists sales, customer data, marketing, service, and commerce solutions.
Key questions addressed by the report
- What are the growth opportunities in the gamification market?
- What is the competitive landscape scenario in the market?
- What are the regulations that are expected to have an impact on the market for gamification?
- How have gamification solution and services evolved from traditional technologies?
- What are the dynamics of the market?
To speak to our analyst for a discussion on the above findings, click Speak to Analyst
 Exclusive indicates content/data unique to MarketsandMarkets and not available with any competitors.
TABLE OF CONTENTS
1 INTRODUCTION (Page No. - 15)
1.1 OBJECTIVES OF THE STUDY
1.2 MARKET DEFINITION
1.2.1 INCLUSIONS AND EXCLUSIONS
1.3 MARKET SCOPE
1.3.1 MARKET SEGMENTATION
1.3.2 YEARS CONSIDERED FOR THE STUDY
1.4 CURRENCY CONSIDERED
1.5 STAKEHOLDERS
2 RESEARCH METHODOLOGY (Page No. - 19)
2.1 RESEARCH DATA
2.1.1 SECONDARY DATA
2.1.2 PRIMARY DATA
2.1.2.1 Breakup of primary profiles
2.1.2.2 Key industry insights
2.2 MARKET BREAKUP AND DATA TRIANGULATION
2.3 MARKET SIZE ESTIMATION
2.4 MARKET FORECAST
2.5 RESEARCH ASSUMPTIONS AND LIMITATIONS
2.5.1 ASSUMPTIONS FOR THE STUDY
2.5.2 LIMITATIONS OF THE STUDY
3 EXECUTIVE SUMMARY (Page No. - 27)
4 PREMIUM INSIGHTS (Page No. - 30)
4.1 ATTRACTIVE OPPORTUNITIES IN THE GAMIFICATION MARKET
4.2 ASIA PACIFIC GAMIFICATION MARKET, BY COMPONENT AND COUNTRY
4.3 GAMIFICATION MARKET: MAJOR COUNTRIES
5 MARKET OVERVIEW AND INDUSTRY TRENDS (Page No. - 32)
5.1 INTRODUCTION
5.2 MARKET DYNAMICS
5.2.1 DRIVERS
5.2.1.1 Rewards and recognition to employees over performance to boost the employee engagement
5.2.1.2 Providing lucrative offers to the customers and consumers
5.2.1.3 Gamification yields higher RoI
5.2.2 OPPORTUNITIES
5.2.2.1 AI used for processing and showing personalized results
5.2.2.2 Digitization of businesses creating new business avenues for gamification
5.2.3 CHALLENGES
5.2.3.1 Complexities in developing gamification application
5.2.3.2 Gamification is for short time
5.3 USE CASES
5.3.1 USE CASE 1: BUNCHBALL
5.3.2 USE CASE 2: BUNCHBALL
5.3.3 USE CASE 3: AXONIFY
5.3.4 USE CASE 4: OCTALYSIS GROUP
5.3.5 USE CASE 5: CENTRICAL
6 GAMIFICATION MARKET, BY COMPONENT (Page No. - 37)
6.1 INTRODUCTION
6.1.1 COMPONENT: GAMIFICATION MARKET DRIVERS
6.2 SOLUTION
6.3 SERVICES
7 GAMIFICATION MARKET, BY DEPLOYMENT (Page No. - 41)
7.1 INTRODUCTION
7.1.1 DEPLOYMENT: GAMIFICATION MARKET DRIVERS
7.2 CLOUD
7.3 ON-PREMISES
8 GAMIFICATION MARKET, BY ORGANIZATION SIZE (Page No. - 45)
8.1 INTRODUCTION
8.1.1 ORGANIZATION SIZE: GAMIFICATION MARKET DRIVERS
8.2 SMALL AND MEDIUM-SIZED ENTERPRISES
8.3 LARGE ENTERPRISES
9 GAMIFICATION MARKET, BY VERTICAL (Page No. - 49)
9.1 INTRODUCTION
9.1.1 VERTICAL: GAMIFICATION MARKET DRIVERS
9.2 EDUCATION
9.3 HEALTHCARE
9.4 BANKING, FINANCIAL SERVICES, AND INSURANCE
9.5 RETAIL
9.6 MANUFACTURING
9.7 MEDIA AND ENTERTAINMENT
9.8 TELECOM
9.9 IT AND ITES
9.10 HOSPITALITY
9.11 OTHERS
10 GAMIFICATION MARKET, BY END-USER (Page No. - 58)
10.1 INTRODUCTION
10.2 ENTERPRISE-DRIVEN
10.3 CONSUMER-DRIVEN
11 GAMIFICATION MARKET, BY APPLICATION (Page No. - 59)
11.1 INTRODUCTION
11.2 MARKETING
11.3 SALES
11.4 SUPPORT
11.5 PRODUCT DEVELOPMENT
11.6 HUMAN RESOURCES
11.7 OTHER APPLICATIONS
12 GAMIFICATION MARKET, BY REGION (Page No. - 61)
12.1 INTRODUCTION
12.1.1 REGION: GAMIFICATION MARKET DRIVERS
12.2 NORTH AMERICA
12.2.1 UNITED STATES
12.2.2 CANADA
12.3 EUROPE
12.3.1 UNITED KINGDOM
12.3.2 GERMANY
12.3.3 FRANCE
12.3.4 REST OF EUROPE
12.4 ASIA PACIFIC
12.4.1 CHINA
12.4.2 JAPAN
12.4.3 AUSTRALIA AND NEW ZEALAND
12.4.4 REST OF ASIA PACIFIC
12.5 MIDDLE EAST AND AFRICA
12.5.1 UNITED ARAB EMIRATES
12.5.2 SOUTH AFRICA
12.5.3 KINGDOM OF SAUDI ARABIA
12.5.4 REST OF MIDDLE EAST AND AFRICA
12.6 LATIN AMERICA
12.6.1 BRAZIL
12.6.2 MEXICO
12.6.3 REST OF LATIN AMERICA
13 COMPETITIVE LANDSCAPE (Page No. - 97)
13.1 COMPETITIVE LEADERSHIP MAPPING
13.1.1 VISIONARY LEADERS
13.1.2 INNOVATORS
13.1.3 DYNAMIC DIFFERENTIATORS
13.1.4 EMERGING COMPANIES
13.2 STRENGTH OF PRODUCT PORTFOLIO
13.3 BUSINESS STRATEGY EXCELLENCE
14 COMPANY PROFILES (Page No. - 101)
14.1 INTRODUCTION
14.2 MICROSOFT
(Business overview, Solutions offered, Recent developments, and SWOT analysis)*
14.3 SAP
14.4 BI WORLDWIDE (BUNCHBALL)
14.5 VERINT
14.6 AON (CUT-E GMBH)
14.7 HOOPLA
14.8 CENTRICAL
14.9 MAMBO.IO
14.10 MPS INTERACTIVE SYSTEMS
14.11 INFLUITIVE
14.12 LEVELELEVEN
14.13 AMBITION
14.14 AXONIFY
14.15 GAMIFIER
14.16 IACTIONABLE
14.17 KHOROS
14.18 SCRIMMAGE
14.19 XOXODAY
14.20 TANGO CARD
14.21 NIIT
*Details on Business overview, Solutions offered, Recent developments, and SWOT analysis might not be captured in case of unlisted companies.
14.22 RIGHT-TO-WIN
15 APPENDIX (Page No. - 128)
15.1 DISCUSSION GUIDE
15.2 KNOWLEDGE STORE: MARKETSANDMARKETS� SUBSCRIPTION PORTAL
15.3 AVAILABLE CUSTOMIZATION
15.4 RELATED REPORTS
15.5 AUTHOR DETAILS
LIST OF TABLES (104 Tables)
TABLE 1 UNITED STATES DOLLAR EXCHANGE RATE, 2016�2019
TABLE 2 FACTOR ANALYSIS
TABLE 3 GLOBAL GAMIFICATION MARKET SIZE, 2018�2025 (USD MILLION)
TABLE 4 MARKET SIZE, BY COMPONENT, 2018�2025 (USD MILLION)
TABLE 5 SOLUTION: MARKET SIZE, BY REGION, 2018�2025 (USD MILLION)
TABLE 6 SERVICES: MARKET SIZE, BY REGION, 2018�2025 (USD MILLION)
TABLE 7 MARKET SIZE, BY DEPLOYMENT, 2018�2025 (USD MILLION)
TABLE 8 CLOUD: MARKET SIZE, BY REGION, 2018�2025 (USD MILLION)
TABLE 9 ON-PREMISES: MARKET SIZE, BY REGION, 2018�2025 (USD MILLION)
TABLE 10 MARKET SIZE, BY ORGANIZATION SIZE, 2018�2025 (USD MILLION)
TABLE 11 SMALL AND MEDIUM-SIZED ENTERPRISES: MARKET SIZE, BY REGION, 2018�2025 (USD MILLION)
TABLE 12 LARGE ENTERPRISES: MARKET SIZE, BY REGION, 2018�2025 (USD MILLION)
TABLE 13 GAMIFICATION MARKET SIZE, BY VERTICAL, 2018�2025 (USD MILLION)
TABLE 14 EDUCATION: MARKET SIZE, BY REGION, 2018�2025 (USD MILLION)
TABLE 15 HEALTHCARE: MARKET SIZE, BY REGION, 2018�2025 (USD MILLION)
TABLE 16 BANKING, FINANCIAL SERVICES, AND INSURANCE: MARKET SIZE, BY REGION, 2018�2025 (USD MILLION)
TABLE 17 RETAIL: MARKET SIZE, BY REGION, 2018�2025 (USD MILLION)
TABLE 18 MANUFACTURING: MARKET SIZE, BY REGION, 2018�2025 (USD MILLION)
TABLE 19 MEDIA AND ENTERTAINMENT: MARKET SIZE, BY REGION, 2018�2025 (USD MILLION)
TABLE 20 TELECOM: MARKET SIZE, BY REGION, 2018�2025 (USD MILLION)
TABLE 21 IT AND ITES: MARKET SIZE, BY REGION, 2018�2025 (USD MILLION)
TABLE 22 HOSPITALITY: MARKET SIZE, BY REGION, 2018�2025 (USD MILLION)
TABLE 23 OTHERS: MARKET SIZE, BY REGION, 2018�2025 (USD MILLION)
TABLE 24 GAMIFICATION MARKET SIZE, BY REGION, 2018�2025 (USD MILLION)
TABLE 25 NORTH AMERICA: MARKET SIZE, BY COMPONENT, 2018�2025 (USD MILLION)
TABLE 26 NORTH AMERICA: MARKET SIZE, BY DEPLOYMENT, 2018�2025 (USD MILLION)
TABLE 27 NORTH AMERICA: MARKET SIZE, BY ORGANIZATION SIZE, 2018�2025 (USD MILLION)
TABLE 28 NORTH AMERICA: MARKET SIZE, BY VERTICAL, 2018�2025 (USD MILLION)
TABLE 29 NORTH AMERICA: EDUCATION MARKET SIZE, BY DEPLOYMENT, 2018�2025 (USD MILLION)
TABLE 30 NORTH AMERICA: HEALTHCARE MARKET SIZE, BY DEPLOYMENT, 2018�2025 (USD MILLION)
TABLE 31 NORTH AMERICA: BANKING, FINANCIAL SERVICES, AND INSURANCE MARKET SIZE, BY DEPLOYMENT, 2018�2025 (USD MILLION)
TABLE 32 NORTH AMERICA: RETAIL MARKET SIZE, BY DEPLOYMENT, 2018�2025 (USD MILLION)
TABLE 33 NORTH AMERICA: MANUFACTURING MARKET SIZE, BY DEPLOYMENT, 2018�2025 (USD MILLION)
TABLE 34 NORTH AMERICA: MARKET SIZE, BY COUNTRY, 2018�2025 (USD MILLION)
TABLE 35 UNITED STATES: GAMIFICATION MARKET SIZE, BY COMPONENT, 2018�2025 (USD MILLION)
TABLE 36 UNITED STATES: MARKET SIZE, BY DEPLOYMENT, 2018�2025 (USD MILLION)
TABLE 37 UNITED STATES: MARKET SIZE, BY ORGANIZATION SIZE, 2018�2025 (USD MILLION)
TABLE 38 CANADA: MARKET SIZE, BY COMPONENT, 2018�2025 (USD MILLION)
TABLE 39 CANADA: MARKET SIZE, BY DEPLOYMENT, 2018�2025 (USD MILLION)
TABLE 40 CANADA: MARKET SIZE, BY ORGANIZATION SIZE, 2018�2025 (USD MILLION)
TABLE 41 EUROPE: GAMIFICATION MARKET SZE, BY COMPONENT, 2018�2025 (USD MILLION)
TABLE 42 EUROPE: MARKET SIZE, BY DEPLOYMENT, 2018�2025 (USD MILLION)
TABLE 43 EUROPE: MARKET SIZE, BY ORGANIZATION SIZE, 2018�2025 (USD MILLION)
TABLE 44 EUROPE: MARKET SIZE, BY VERTICAL, 2018�2025 (USD MILLION)
TABLE 45 EUROPE: EDUCATION MARKET SIZE, BY DEPLOYMENT, 2018�2025 (USD MILLION)
TABLE 46 EUROPE: HEALTHCARE MARKET SIZE, BY DEPLOYMENT, 2018�2025 (USD MILLION)
TABLE 47 EUROPE: BANKING, FINANCIAL SERVICES, AND INSURANCE MARKET SIZE, BY DEPLOYMENT, 2018�2025 (USD MILLION)
TABLE 48 EUROPE: RETAIL MARKET SIZE, BY DEPLOYMENT, 2018�2025 (USD MILLION)
TABLE 49 EUROPE: MANUFACTURING MARKET SIZE, BY DEPLOYMENT, 2018�2025 (USD MILLION)
TABLE 50 EUROPE: GAMIFICATION MARKET SIZE, BY COUNTRY, 2018�2025 (USD MILLION)
TABLE 51 UNITED KINGDOM: MARKET SIZE, BY COMPONENT, 2018�2025 (USD MILLION)
TABLE 52 UNITED KINGDOM: MARKET SIZE, BY DEPLOYMENT, 2018�2025 (USD MILLION)
TABLE 53 UNITED KINGDOM: MARKET SIZE, BY ORGANIZATION SIZE, 2018�2025 (USD MILLION)
TABLE 54 GERMANY: MARKET SIZE, BY COMPONENT, 2018�2025 (USD MILLION)
TABLE 55 GERMANY: MARKET SIZE, BY DEPLOYMENT, 2018�2025 (USD MILLION)
TABLE 56 GERMANY: MARKET SIZE, BY ORGANIZATION SIZE, 2018�2025 (USD MILLION)
TABLE 57 ASIA PACIFIC: GAMIFICATION MARKET SIZE, BY COMPONENT, 2018�2025 (USD MILLION)
TABLE 58 ASIA PACIFIC: MARKET SIZE, BY DEPLOYMENT, 2018�2025 (USD MILLION)
TABLE 59 ASIA PACIFIC: MARKET SIZE, BY ORGANIZATION SIZE, 2018�2025 (USD MILLION)
TABLE 60 ASIA PACIFIC: MARKET SIZE, BY VERTICAL, 2018�2025 (USD MILLION)
TABLE 61 ASIA PACIFIC: EDUCATION MARKET SIZE, BY DEPLOYMENT, 2018�2025 (USD MILLION)
TABLE 62 ASIA PACIFIC: HEALTHCARE MARKET SIZE, BY DEPLOYMENT, 2018�2025 (USD MILLION)
TABLE 63 ASIA PACIFIC: BANKING, FINANCIAL SERVICES, AND INSURANCE MARKET SIZE, BY DEPLOYMENT, 2018�2025 (USD MILLION)
TABLE 64 ASIA PACIFIC: RETAIL MARKET SIZE, BY DEPLOYMENT, 2018�2025 (USD MILLION)
TABLE 65 ASIA PACIFIC: MANUFACTURING MARKET SIZE, BY DEPLOYMENT, 2018�2025 (USD MILLION)
TABLE 66 ASIA PACIFIC: GAMIFICATION MARKET SIZE, BY COUNTRY, 2018�2025 (USD MILLION)
TABLE 67 CHINA: MARKET SIZE, BY COMPONENT, 2018�2025 (USD MILLION)
TABLE 68 CHINA: MARKET SIZE, BY DEPLOYMENT, 2018�2025 (USD MILLION)
TABLE 69 CHINA: MARKET SIZE, BY ORGANIZATION SIZE, 2018�2025 (USD MILLION)
TABLE 70 JAPAN: MARKET SIZE, BY COMPONENT, 2018�2025 (USD MILLION)
TABLE 71 JAPAN: MARKET SIZE, BY DEPLOYMENT, 2018�2025 (USD MILLION)
TABLE 72 JAPAN: MARKET SIZE, BY ORGANIZATION SIZE, 2018�2025 (USD MILLION)
TABLE 73 MIDDLE EAST AND AFRICA: GAMIFICATION MARKET SIZE, BY COMPONENT, 2018�2025 (USD MILLION)
TABLE 74 MIDDLE EAST AND AFRICA: MARKET SIZE, BY DEPLOYMENT, 2018�2025 (USD MILLION)
TABLE 75 MIDDLE EAST AND AFRICA: MARKET SIZE, BY ORGANIZATION SIZE, 2018�2025 (USD MILLION)
TABLE 76 MIDDLE EAST AND AFRICA: MARKET SIZE, BY VERTICAL, 2018�2025 (USD MILLION)
TABLE 77 MIDDLE EAST AND AFRICA: EDUCATION MARKET SIZE, BY DEPLOYMENT, 2018�2025 (USD MILLION)
TABLE 78 MIDDLE EAST AND AFRICA: HEALTHCARE MARKET SIZE, BY DEPLOYMENT, 2018�2025 (USD MILLION)
TABLE 79 MIDDLE EAST AND AFRICA: BANKING, FINANCIAL SERVICES, AND INSURANCE MARKET SIZE, BY DEPLOYMENT, 2018�2025 (USD MILLION)
TABLE 80 MIDDLE EAST AND AFRICA: RETAIL MARKET SIZE, BY DEPLOYMENT, 2018�2025 (USD MILLION)
TABLE 81 MIDDLE EAST AND AFRICA: MANUFACTURING MARKET SIZE, BY DEPLOYMENT, 2018�2025 (USD MILLION)
TABLE 82 MIDDLE EAST AND AFRICA: GAMIFICATION MARKET SIZE, BY COUNTRY, 2018�2025 (USD MILLION)
TABLE 83 UNITED ARAB EMIRATES: MARKET SIZE, BY COMPONENT, 2018�2025 (USD MILLION)
TABLE 84 UNITED ARAB EMIRATES: MARKET SIZE, BY DEPLOYMENT, 2018�2025 (USD MILLION)
TABLE 85 UNITED ARAB EMIRATES: MARKET SIZE, BY ORGANIZATION SIZE, 2018�2025 (USD MILLION)
TABLE 86 SOUTH AFRICA: MARKET SIZE, BY COMPONENT, 2018�2025 (USD MILLION)
TABLE 87 SOUTH AFRICA: MARKET SIZE, BY DEPLOYMENT, 2018�2025 (USD MILLION)
TABLE 88 SOUTH AFRICA: MARKET SIZE, BY ORGANIZATION SIZE, 2018�2025 (USD MILLION)
TABLE 89 LATIN AMERICA: GAMIFICATION MARKET SIZE, BY COMPONENT, 2018�2025 (USD MILLION)
TABLE 90 LATIN AMERICA: MARKET SIZE, BY DEPLOYMENT, 2018�2025 (USD MILLION)
TABLE 91 LATIN AMERICA: MARKET SIZE, BY ORGANIZATION SIZE, 2018�2025 (USD MILLION)
TABLE 92 LATIN AMERICA: MARKET SIZE, BY VERTICAL, 2018�2025 (USD MILLION)
TABLE 93 LATIN AMERICA: EDUCATION MARKET SIZE, BY DEPLOYMENT, 2018�2025 (USD MILLION)
TABLE 94 LATIN AMERICA: HEALTHCARE MARKET SIZE, BY DEPLOYMENT, 2018�2025 (USD MILLION)
TABLE 95 LATIN AMERICA: BANKING, FINANCIAL SERVICES, AND INSURANCE MARKET SIZE, BY DEPLOYMENT, 2018�2025 (USD MILLION)
TABLE 96 LATIN AMERICA: RETAIL MARKET SIZE, BY DEPLOYMENT, 2018�2025 (USD MILLION)
TABLE 97 LATIN AMERICA: MANUFACTURING MARKET SIZE, BY DEPLOYMENT, 2018�2025 (USD MILLION)
TABLE 98 LATIN AMERICA: GAMIFICATION MARKET SIZE, BY COUNTRY, 2018�2025 (USD MILLION)
TABLE 99 BRAZIL: MARKET SIZE, BY COMPONENT, 2018�2025 (USD MILLION)
TABLE 100 BRAZIL: MARKET SIZE, BY DEPLOYMENT, 2018�2025 (USD MILLION)
TABLE 101 BRAZIL: MARKET SIZE, BY ORGANIZATION SIZE, 2018�2025 (USD MILLION)
TABLE 102 MEXICO: MARKET SIZE, BY COMPONENT, 2018�2025 (USD MILLION)
TABLE 103 MEXICO: MARKET SIZE, BY DEPLOYMENT, 2018�2025 (USD MILLION)
TABLE 104 MEXICO: MARKET SIZE, BY ORGANIZATION SIZE, 2018�2025 (USD MILLION)
LIST OF FIGURES (30 Figures)
FIGURE 1 GAMIFICATION MARKET: RESEARCH DESIGN
FIGURE 2 MARKET SIZE ESTIMATION METHODOLOGY �(SUPPLY SIDE): REVENUE OF SOLUTION AND SERVICES OF THE MARKET
FIGURE 3 MARKET SIZE ESTIMATION METHODOLOGY �BOTTOM-UP (SUPPLY SIDE): COLLECTIVE REVENUE OF ALL SOLUTIONS AND SERVICES OF THE MARKET
FIGURE 4 MARKET SIZE ESTIMATION METHODOLOGY �TOP-DOWN (DEMAND SIDE): SHARE OF THE MARKET
FIGURE 5 SOLUTION SEGMENT TO HOLD A LARGER MARKET SIZE IN 2020
FIGURE 6 CLOUD DEPLOYMENT TO HOLD A HIGHER MARKET SHARE IN 2020
FIGURE 7 LARGE ENTERPRISES SEGMENT TO HOLD A LARGER MARKET SIZE IN 2020
FIGURE 8 NEED FOR INCREASED EMPLOYEE AND CUSTOMER ENGAGEMENT TO DRIVE THE GAMIFICATION MARKET GROWTH
FIGURE 9 SOLUTION SEGMENT AND CHINA TO ACCOUNT FOR HIGH MARKET SHARES IN ASIA PACIFIC IN 2020
FIGURE 10 AUSTRALIA AND NEW ZEALAND TO GROW AT THE HIGHEST CAGR DURING THE FORECAST PERIOD
FIGURE 11 DRIVERS, OPPORTUNITIES, AND CHALLENGES: MARKET
FIGURE 12 SERVICES SEGMENT TO GROW AT A HIGHER CAGR DURING THE FORECAST PERIOD
FIGURE 13 CLOUD SEGMENT TO GROW AT A HIGHER CAGR DURING THE FORECAST PERIOD
FIGURE 14 SMALL AND MEDIUM-SIZED ENTERPRISES SEGMENT TO WITNESS A HIGHER GROWTH RATE DURING THE FORECAST PERIOD
FIGURE 15 TELECOM SEGMENT TO WITNESS THE HIGHEST GROWTH RATE DURING THE FORECAST PERIOD
FIGURE 16 NORTH AMERICA TO EXHIBIT THE LARGEST MARKET SIZE DURING THE FORECAST PERIOD
FIGURE 17 NORTH AMERICA: MARKET SNAPSHOT
FIGURE 18 ASIA PACIFIC: MARKET SNAPSHOT
FIGURE 19 GAMIFICATION MARKET (GLOBAL), COMPETITIVE LEADERSHIP MAPPING, 2020
FIGURE 20 PRODUCT PORTFOLIO ANALYSIS OF TOP PLAYERS IN THE GLOBAL MARKET
FIGURE 21 BUSINESS STRATEGY EXCELLENCE OF TOP PLAYERS IN THE GLOBAL MARKET
FIGURE 22 MICROSOFT: COMPANY SNAPSHOT
FIGURE 23 MICROSOFT: SWOT ANALYSIS
FIGURE 24 SAP: COMPANY SNAPSHOT
FIGURE 25 SAP: SWOT ANALYSIS
FIGURE 26 BI WORLDWIDE (BUNCHBALL): SWOT ANALYSIS
FIGURE 27 VERINT: COMPANY SNAPSHOT
FIGURE 28 VERINT: SWOT ANALYSIS
FIGURE 29 AON (CUT-E GMBH): COMPANY SNAPSHOT
FIGURE 30 AON (CUT-E GMBH): SWOT ANALYSIS
The study involved four major activities in estimating the current market size for the gamification market. An exhaustive secondary research was done to collect information on the market for gamification. The next step was to validate these findings, assumptions, and sizing with industry experts across the value chain using primary research. Both top-down and bottom-up approaches were employed to estimate the total market size. After that, the market breakup and data triangulation procedures were used to estimate the market size of the segments and subsegments of the gamification market.
Secondary Research
In the secondary research process, various secondary sources, such as D&B Hoovers, Bloomberg BusinessWeek, and Dun & Bradstreet, were referred to identify and collect information for this study. These secondary sources included annual reports, press releases, and investor presentations of companies; whitepapers, certified publications, and articles by recognized authors; gold standard and silver standard websites; regulatory bodies; trade directories; and databases.
Primary Research
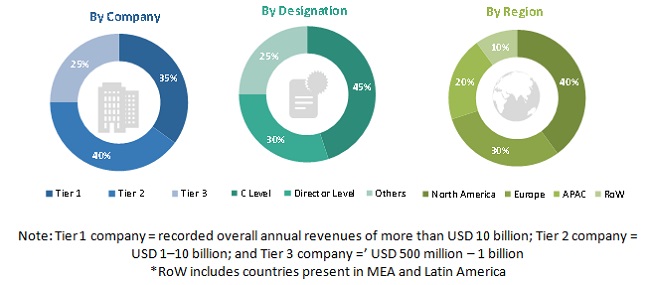
The gamification market comprises several stakeholders, such as gamification vendors, gamification service providers, venture capitalists, government organizations, regulatory authorities, policymakers, and financial organizations, consulting firms, research organizations, academic institutions, resellers, and distributors and training providers. The demand side of the gamification market consists of all the firms operating in several industry verticals. The supply side includes gamification providers, offering gamification services. Various primary sources from both the supply and demand sides of the market were interviewed to obtain qualitative and quantitative information. Given below is the breakup of the primary respondents:
To know about the assumptions considered for the study, download the pdf brochure
Market Size Estimation
The top-down and bottom-up approaches were used to estimate and validate the size of the global gamification market and various other dependent submarkets in the overall market. An exhaustive list of all the vendors who offer solutions and services in the gamification market was prepared while using the top-down approach. The market share for all the vendors in the market was estimated through annual reports, press releases, funding, investor presentations, paid databases, and primary interviews. Each vendor was evaluated based on its components (solution and services). The aggregate of all companies� revenues was extrapolated to reach the overall market size.
Further, each subsegment was studied and analyzed for its global market size and regional penetration. The markets were triangulated through both primary and secondary research. The primary procedure included extensive interviews for key insights from the industry leaders, such as Chief Executive Officers (CEOs), Vice Presidents (VPs), directors, and managers.
Data Triangulation
After arriving at the overall market size using the market size estimation processes as explained above, the market was split into several segments and subsegments. The data triangulation and market breakup procedures were employed, wherever applicable, to complete the overall market engineering process and arrive at the exact statistics of each market segment and subsegment. The data was triangulated by studying various factors and trends from both the demand and supply sides.
Report Objectives
- To determine and forecast the global gamification market by component, deployment, organization size, application, end-user, vertical, and region during the forecast period, and analyze the various macroeconomic and microeconomic factors that affect the market growth
- To forecast the size of the market segments concerning five main regions: North America, Europe, Asia Pacific (APAC), Latin America, and Middle East and Africa (MEA)
- To provide detailed information about the major factors (drivers, opportunities, and challenges) influencing the growth of the market
- To analyze each submarket with respect to individual growth trends, prospects, and contribution to the overall market
- To analyze the opportunities in the market for stakeholders by identifying the high-growth segments of the gamification market
- To profile key market players; provide a comparative analysis based on business overview, regional presence, product offerings, business strategies, and critical financials; and illustrate the competitive landscape of the market
- To track and analyze competitive developments, such as mergers and acquisitions, product developments, partnerships and collaborations, and Research & Development (R&D) activities, in the market
Scope of Report
|
Report Metrics |
Details |
|
Market size available for years |
2018-2025 |
|
Base year considered |
2019 |
|
Forecast period |
2020-2025 |
|
Forecast units |
Value (USD Billion) |
|
Segments covered |
Component (Solution and Services), Deployment (Cloud and On-premises), Organization Size (SMEs and Large Enterprises), Application, End-User (Enterprise-Driven and Consumer-Driven), Vertical, and Region |
|
Regions covered |
North America, Europe, APAC, MEA, and Latin America |
|
Companies covered |
Microsoft (US), SAP (Germany), BI WORLDWIDE (US), Verint (US) Aon (UK), Hoopla (US), Centrical (US), Mambo.IO (UK), MPS Interactive Systems (India), Influitive (Canada), LevelEleven (US), Ambition (US), Axonify Inc. (Canada), Gamifier (Latin America), IActionable (US), Khoros (US), Scrimmage (US), Xoxoday (India), Tango Card (US), and NIIT (US) |
This research report categorizes the gamification market to forecast revenue and analyze trends in each of the following submarkets:
Based on the components, the gamification market has the following segments:
- Solution
- Services
Based on deployment, the market has the following segments:
- Cloud
- On-premises
Based on organization size, the gamification market has the following segments:
- SMEs
- Large enterprise
Based on regions, the market has the following segments:
- North America
- US
- Canada
- Europe
- UK
- Germany
- France
- Rest of Europe
- APAC
- China
- Japan
- ANZ
- Rest of APAC
- MEA
- UAE
- South Africa
- KSA
- Rest of MEA
- Latin America
- Brazil
- Mexico
- Rest of Latin America
Available customizations
Along with the market data, MarketsandMarkets offers customizations as per the company�s specific needs. The following customization options are available for the report:
Company information
- Detailed analysis and profiling of additional market players (Up to 5)


Growth opportunities and latent adjacency in Gamification Market
Require insights on the Gamification market in Latin America
Require insights on the Gamification market in Healthcare vertical
Need insights into the use of gamification for employee training purposes.
Detailed understanding of the Gamification, application of gasification oriented to corporations, entrepreneurs, universities and business schools.
Gather insights into wellness programs, sales incentives, channel loyalty programming, enterprise learning with gamification enablement.
Require insights on the Gamification market in Healthcare vertical
Require insights on the Gamification market in Latin America
Interested in HMD market, virtual reality and gaming industry.
Need analysis of market trends in the Gamification, Responsive content, Adaptive and Personalized learning, Social learning, video and chunked learning, Human Capital Management, Employee Engagement.
Require insights on the Gamification market in Healthcare vertical
Deep understanding of the gamification market.