Glass Cockpit Market for Aerospace by Aircraft Type (Cargo, Fighter, Helicopter, Air Transport, Trainer, General Aviation, & Business Jet), Display Type (PFD, MFD, Backup, & Mission), Display Size, & Geography - Analysis & Forecast (2014 � 2020)


Glass Cockpit Display Market are generally a cluster of several display screens that form a display panel in the cockpit of an aircraft. These displays have become an essential part of every big and small aircraft’s cockpit. Factors such as light weight with more functionality and better accuracy; enhanced safety, situational awareness, and efficiency; and automation of the flight controls are driving the growth of the glass cockpit displays for aerospace market. glass cockpit market is expected to reach $1,818.7 Million by 2020, growing at a CAGR of 2.2% from 2014 to 2020. Moreover, the shipment of glass cockpit displays is expected to reach 148,277 units by 2020, growing at an estimated CAGR of 5.3%. Technological advancement has resulted in a positive impact on the market.
Please click here to get the relevant report of Cockpit Display Market for Land Vehicle by Vehicle Type (Commercial Automobile, Tactical, and Trains), Display Type (Driver-Assist Displays and Mission Displays), Display Size, and Geography
Glass cockpits; also known as cockpit displays, head-down displays (HDD), or electronic flight instrument system (EFIS) displays, are generally a cluster of several display screens that form a display panel in the cockpit. The history of glass cockpit displays dates back to the late 1970s, when NASA conducted a study for the research of a much efficient display technology. However, the technology was commercialized in the 1990s, when the LCD glass cockpit display technology was widely accepted by airliners, business jets, and military aircrafts. By the end of the 20th century, these displays became an essential part of every big and small aircraft’s cockpit. Since then, glass cockpit displays have gradually made their way from commercial aircraft to the general aviation industry.
Advanced technologies, such as touchscreen displays and a boost in the orders of new aircraft by airlines, are the major areas of opportunities for the glass cockpit displays in aerospace industry. Whereas, factors such as light weight with more functionalities and better accuracy, enhanced safety, situational awareness, and efficiency, and automation of the flight controls are driving the growth of the glass cockpit displays for aerospace market.
Glass Cockpit Displays for Aerospace Market Size, by Value ($ Million), 2012–2020
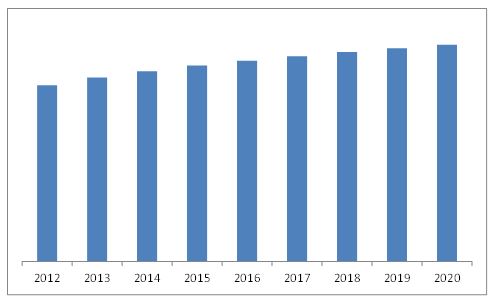
Source: MarketsandMarkets Analysis
The market size of the glass cockpit displays for aerospace market is expected to grow at a CAGR of 2.2% in terms of value and 5.3% in terms of volume from 2014 to 2020. The report focuses on detailed segmentations of the market, combined with qualitative and quantitative analysis of each and every aspect of the classification on the basis of aircraft types, display types, display sizes, and geographies. All the numbers, at every level of detail, are forecast till 2020 to give a glimpse of the potential market size in terms of value and volume in this market.
The major players in glass cockpit displays for aerospace market include Aspen Avionics, Inc. (U.S.), Avidyne Corporation (U.S.), Dynon Avionics (U.S.), Elbit Systems Ltd. (Israel), Esterline Technologies Corporation (U.S.), Garmin Ltd. (Switzerland), Honeywell Aerospace, Inc. (U.S.), L-3 Communication Holdings, Inc. (U.S.), Northrop Grumman Corporation (U.S.), Rockwell Collins, Inc. (U.S.), Thales SA (France), and Universal Avionics Systems Corporation (U.S.).
 Exclusive indicates content/data unique to MarketsandMarkets and not available with any competitors.
Table of Contents
1 Introduction (Page No. - 17)
1.1 Objectives of the Study
1.2 Market Definition
1.3 Study Scope
1.3.1 Markets Covered
1.3.2 Geographic Scope
1.3.3 Years Considered for the Study
1.4 Currency
1.5 Limitations
1.6 Market Stakeholders
2 Research Methodology (Page No. - 20)
2.1 Research Data
2.1.1 Secondary Data
2.1.1.1 Key Data From Secondary Sources
2.1.2 Primary Data
2.1.2.1 Key Data From Primary Sources
2.1.2.2 Key Industry Insights
2.1.2.3 Breakdown of Primaries
2.2 Variables Considered Within Factor Analysis
2.2.1 Demand Side Analysis
2.2.1.1 A Broader Depiction of the Aircraft Manufacturing Industry
2.2.1.2 Analysis of Aircraft Shipments, By Geography
2.3 Market Size Estimation
2.3.1 Bottom-Up Approach
2.3.2 Top-Down Approach
2.3.3 Market Share Estimation
2.4 Market Breakdown and Data Triangulation
2.5 Research Assumptions and Limitations
2.5.1 Assumptions
2.5.2 Limitations
3 Executive Summary (Page No. - 32)
4 Premium Insights (Page No. - 37)
4.1 Attractive Market Opportunities in the Glass Cockpit Display for Aerospace Market
4.2 Glass Cockpit Display for Aerospace Market—Top Three Aircraft Types
4.3 Glass Cockpit Display for Aerospace Market, By Display Type and Display Size
4.4 the Americas Was the Major Consumer of the Glass Cockpit Display for Aerospace Market in 2014
4.5 Glass Cockpit Display for Aerospace Market: Matured vs. Emerging Markets
4.6 Glass Cockpit Display for Aerospace Market, By Aircraft Type
5 Market Overview (Page No. - 42)
5.1 Introduction
5.2 Market Segmentation
5.2.1 Glass Cockpit Market By Aircraft Type
5.2.2 Glass Cockpit Market By Display Type
5.2.3 Glass Cockpit Market By Display Size
5.2.4 Glass Cockpit Market By Geography
5.3 Evolution
5.4 Glass Cockpit Market Market Dynamics
5.4.1 Drivers
5.4.1.1 Lightweight With More Functionalities and Better Accuracy
5.4.1.2 Enhanced Safety, Situational Awareness, and Efficiency
5.4.1.3 Automation of Flight Controls
5.4.2 Restraints
5.4.2.1 Increased Complexity
5.4.2.2 Display Blackout Due to System Failure
5.4.3 Opportunities
5.4.3.1 Touchscreen Display
5.4.3.2 Increased Demand for New Aircraft By Airlines
5.4.4 Challenges
5.4.4.1 Appropriate Pilot Training
5.5 Burning Issue
5.5.1 Although the Rate of Accidents has Decreased, Chances of Fatal Accidents Have Increased
5.6 Winning Imperatives
5.6.1 The Introduction of Low-Cost Technically Advanced Glass Cockpit Display With Less Complexity
6 Industry Trends (Page No. - 58)
6.1 Introduction
6.2 Value Chain Analysis
6.3 Supply Chain Analysis
6.4 Porter’s Five Forces Analysis
6.4.1 Threat of New Entrants
6.4.2 Threat of Substitutes
6.4.3 Bargaining Power of Suppliers
6.4.4 Bargaining Power of Buyers
6.4.5 Degree of Competition
7 Glass Cockpit Display for Aerospace Market, By Aircraft Type (Page No. - 70)
7.1 Introduction
7.2 Cargo Aircraft
7.3 Fighter Aircraft
7.4 Helicopter
7.5 Air Transport
7.6 Trainer Aircraft
7.7 General Aviation
7.8 Business Jet
8 Glass Cockpit Display for Aerospace Market, By Display Type (Page No. - 109)
8.1 Introduction
8.2 Primary Flight Display
8.3 Multi-Function Display
8.4 Backup Display
8.5 Mission Display
9 Glass Cockpit Display for Aerospace Market, By Display Size (Page No. - 123)
9.1 Introduction
9.2 Less Than 5 Inches
9.3 5 Inches to 10 Inches
9.4 Greater Than 10 Inches
10 Geographic Analysis (Page No. - 135)
10.1 Introduction
10.2 The Americas
10.3 Europe
10.4 Asia-Pacific
10.5 Rest of the World
11 Competitive Landscape (Page No. - 154)
11.1 Overview
11.2 Market Share Analysis
11.3 Competitive Scenario
11.3.1 New Product Launches
11.3.2 Partnerships, Agreements, and Joint Ventures
11.3.3 Acquisitions
11.3.4 Contracts
11.3.5 Other Developments
12 Company Profiles (Page No. - 163)
(Overview, Products and Services, Financials, Strategy & Development)*
12.1 Introduction
12.2 Rockwell Collins, Inc.
12.3 Honeywell Aerospace Inc.
12.4 Esterline Technologies Corporation (Also Featuring Barco N.V. Products)
12.5 Thales SA
12.6 Garmin Ltd.
12.7 Elbit Systems Ltd.
12.8 L-3 Communications Holdings, Inc.
12.9 Northrop Grumman Corporation
12.10 Universal Avionics Systems Corporation
12.11 Aspen Avionics, Inc.
12.12 Avidyne Corporation
12.13 Dynon Avionics
*Details on Overview, Products and Services, Financials, Strategy & Development Might Not Be Captured in Case of Unlisted Companies.
13 Appendix (Page No. - 190)
13.1 Insights of Industry Experts
13.2 Discussion Guide
13.3 Introducing RT: Real-Time Market Intelligence
13.4 Available Customizations
13.5 Related Reports
List of Tables (81 Tables)
Table 1 Lightweight With More Functionalities and Better Accuracy is the Major Demand Driver of the Glass Cockpit Display for Aerospace Market
Table 2 Increased Complexity is Limiting the Growth of the Glass Cockpit Display for Aerospace Market
Table 3 Evolution in the Touchscreen Technology Presents Itself as an Opportunity for the Glass Cockpit Display for Aerospace Market
Table 4 Porter’s Five Forces Analysis With Their Weightage Impact
Table 5 Glass Cockpit Display Market Size, By Aircraft Type,2012–2020 ($Million)
Table 6 Glass Cockpit Display Market Size, By Aircraft Type, 2012–2020 (Units)
Table 7 Glass Cockpit Display Market Size for Cargo Aircraft, By Display Type, 2012–2020 ($Million)
Table 8 Glass Cockpit Display Market Size for Cargo Aircraft, By Display Type, 2012–2020 (Units)
Table 9 Glass Cockpit Display MarketSize for Cargo Aircraft, By Display Size, 2012–2020 ($Million)
Table 10 Glass Cockpit Display Market Size for Cargo Aircraft, By Display Size, 2012–2020 (Units)
Table 11 Glass Cockpit Display Market Size for Cargo Aircraft, By Geography, 2012–2020 ($Million)
Table 12 Glass Cockpit Display MarketSize for Cargo Aircraft, By Geography, 2012–2020 (Units)
Table 13 Glass Cockpit Display Market Size for Fighter Aircraft, By Display Type, 2012–2020 ($Million)
Table 14 Glass Cockpit Display Market Size for Fighter Aircraft, By Display Type, 2012–2020 (Units)
Table 15 Glass Cockpit Display Market Size for Fighter Aircraft, By Display Size, 2012–2020 ($Million)
Table 16 Glass Cockpit Display Market Size for Fighter Aircraft, By Display Size, 2012–2020 (Units)
Table 17 Glass Cockpit Display Market Size for Fighter Aircraft, By Geography, 2012–2020 ($Million)
Table 18 Glass Cockpit Market Size for Fighter Aircraft, By Geography, 2012–2020 (Units)
Table 19 Glass Cockpit Display Market Size for Helicopters, By Display Type, 2012–2020 ($Million)
Table 20 Glass Cockpit Market Size for Helicopters, By Display Type, 2012–2020 (Units)
Table 21 Glass Cockpit Display Market Size for Helicopters, By Display Size, 2012–2020 ($Million)
Table 22 Glass Cockpit Display Market Size for Helicopters, By Display Size, 2012–2020 (Units)
Table 23 Glass Cockpit Market Size for Helicopters, By Region, 2012–2020 ($Million)
Table 24 Glass Cockpit Market Size for Helicopters, By Geography, 2012–2020 (Units)
Table 25 Glass Cockpit Market Size for Air Transport Aircraft,By Display Type, 2012–2020 ($Million)
Table 26 Glass Cockpit Display Market Size for Air Transport Aircraft,By Display Type, 2012–2020 (Units)
Table 27 Glass Cockpit Market Size for Air Transport Aircraft,By Display Size, 2012–2020 ($Million)
Table 28 Glass Cockpit Market Size for Air Transport Aircraft,By Display Size, 2012–2020 (Units)
Table 29 Glass Cockpit Market Size for Air Transport Aircraft,By Geography, 2012–2020 ($Million)
Table 30 Glass Cockpit Market Size for Air Transport Aircraft,By Geography, 2012–2020 (Units)
Table 31 Glass Cockpit Display Market Size for Trainer Aircraft, By Display Type, 2012–2020 ($Million)
Table 32 Glass Cockpit Market Size for Trainer Aircraft, By Display Type, 2012–2020 (Units)
Table 33 Glass Cockpit Display Market Size for Trainer Aircraft, By Display Size, 2012–2020 ($Million)
Table 34 Glass Cockpit Market Size for Trainer Aircraft, By Display Size, 2012–2020 (Units)
Table 35 Glass Cockpit Display Market Size for Trainer Aircraft, By Geography, 2012–2020 ($Million)
Table 36 Glass Cockpit Market Size for Trainer Aircraft, By Geography, 2012–2020 (Units)
Table 37 Glass Cockpit Display Market Size for General Aviation Aircraft,By Display Type, 2012–2020 ($Million)
Table 38 Glass Cockpit Market Size for General Aviation Aircraft,By Display Type, 2012–2020 (Units)
Table 39 Glass Cockpit Display Market Size for General Aviation Aircraft,By Display Size, 2012–2020 ($Million)
Table 40 Glass Cockpit Market Size for General Aviation Aircraft,By Display Size, 2012–2020 (Units)
Table 41 Glass Cockpit Display Market Size for General Aviation Aircraft, By Geography, 2012–2020 ($Million)
Table 42 Glass Cockpit Market Size for General Aviation Aircraft, By Geography, 2012–2020 (Units)
Table 43 Glass Cockpit Market Size for Business Jet Aircraft, By Display Type, 2012–2020 ($Million)
Table 44 Glass Cockpit Display Market Size for Business Jet Aircraft, By Display Type, 2012–2020 (Units)
Table 45 Glass Cockpit Display Market Size for Business Jet Aircraft, By Display Size, 2012–2020 ($Million)
Table 46 Glass Cockpit Market Size for Business Jet Aircraft, By Display Size, 2012–2020 (Units)
Table 47 Glass Cockpit Market Size for Business Jet Aircraft,By Geography, 2012–2020 ($Million)
Table 48 Glass Cockpit Display Market Size for Business Jet Aircraft,By Geography, 2012–2020 (Units)
Table 49 Glass Cockpit Market Size, By Display Type, 2012-2020 ($Million)
Table 50 Glass Cockpit Market Size, By Display Type, 2012–2020 (Units)
Table 51 Primary Flight Display Market Size, By Aircraft Type,2012–2020 ($Million)
Table 52 Primary Flight Display Market Size, By Aircraft Type, 2012–2020 (Units)
Table 53 Multi-Function Display Market Size, By Aircraft Type,2012–2020 ($Million)
Table 54 Multi-Function Display Market Size, By Aircraft Type, 2012–2020 (Units)
Table 55 Backup Display Market Size, By Aircraft Type, 2012–2020 ($Million)
Table 56 Backup Display Market Size, By Aircraft Type, 2012–2020 (Units)
Table 57 Mission Display Market Size, By Aircraft Type, 2012–2020 ($Million)
Table 58 Mission Display Market Size, By Aircraft Type, 2012–2020 (Units)
Table 59 Glass Cockpit Display Market Size, By Aircraft Display Size, 2012–2020 ($Million)
Table 60 Glass Cockpit Market Size, By Aircraft Display Size, 2012–2020 (Units)
Table 61 Less Than 5 Inches Display Market Size, By Aircraft Type,2012–2020 ($Million)
Table 62 Less Than 5 Inches Display Market Size, By Aircraft Type,2012–2020 (Units)
Table 63 5 Inches to 10 Inches Display Market Size, By Aircraft Type, 2012–2020 ($Million)
Table 64 5 Inches to 10 Inches Display Market Size, By Aircraft Type,2012–2020 (Units)
Table 65 Greater Than 10 Inches Display Market Size, By Aircraft Type, 2012–2020 ($Million)
Table 66 Greater Than 10 Inches Display Market Size, By Aircraft Type, 2012–2020 (Units)
Table 67 Glass Cockpit Market Size for Aircraft, By Region, 2012–2020 ($Million)
Table 68 Glass Cockpit Market Size for Aircraft, By Region,2012–2020 (Units)
Table 69 The Americas Glass Cockpit Display Market Size, By Aircraft Type, 2012–2020 ($Million)
Table 70 The Americas Glass Cockpit Display Market Size, By Aircraft Type, 2012–2020 (Units)
Table 71 The European Glass Cockpit Display Market Size, By Aircraft Type, 2012–2020 ($Million)
Table 72 European Glass Cockpit Display Market Size, By Aircraft Type, 2012–2020 (Units)
Table 73 APAC Glass Cockpit Display Market Size, By Aircraft Type, 2012–2020 ($Million)
Table 74 APAC Glass Cockpit Display Market Size, By Aircraft Type,2012–2020 (Units)
Table 75 RoW Glass Cockpit Display Market Size, By Aircraft Type, 2012–2020 ($Million)
Table 76 RoW Glass Cockpit Display Market Size, By Aircraft Type,2012–2020 (Units)
Table 77 Most Significant New Product Launches in the Glass Cockpit Display for Aerospace Market
Table 78 Most Significant Partnerships, Agreements, and Joint Ventures in the Glass Cockpit Display for Aerospace Market
Table 79 Recent Acquisitions of the Glass Cockpit Display for Aerospace Market
Table 80 Recent Contracts of the Glass Cockpit Display for Aerospace Market
Table 81 Other Recent Developments in the Glass Cockpit Display for Aerospace Market
List of Figures (111 Figures)
Figure 1 Research Design
Figure 2 Global Aircraft Market Analysis (2012 - 2014)
Figure 3 Global Aircraft Market, By Geography (Between 2010 and 2014)
Figure 4 Glass Cockpit Market Size Estimation Methodology: Bottom-Up Approach
Figure 5 Glass Cockpit Market Size Estimation Methodology: Top-Down Approach
Figure 6 Glass Cockpit Market Breakdown and Data Triangulation
Figure 7 Assumptions of the Research Study
Figure 8 Limitations of the Research Study
Figure 9 Air Transport to Dominate the Market During the Forecast Period
Figure 10 The Multi-Function Displays Segment is the Fastest-Growing Segment During the Forecast Period
Figure 11 5 Inches to 10 Inches Display Accounted for Around Two-Third of the Overall Market in 2014
Figure 12 The Americas Accounted for the Largest Market Share in 2014
Figure 13 The Glass Cockpit Display for Aerospace Market is Expected to Grow at A CAGR of 2.2% Between 2014 and 2020
Figure 14 Air Transport Holds the Largest Share in the Glass Cockpit Display for Aerospace Market During the Forecast Period
Figure 15 PFDS Hold the Largest Share in the Display Type Segment
Figure 16 The Americas Accounted for the Largest Share of the Overall Glass Cockpit Display for Aerospace Market
Figure 17 The APAC and RoW Regions are Growing at A Higher Rate Than the Americas and European Regions
Figure 18 New Aircraft is Expected to Dominate the Glass Cockpit Display for Aerospace Market Till 2020
Figure 19 Glass Cockpit Display for Aerospace Market Segmentation
Figure 20 Glass Cockpit Market Segmentation: By Aircraft Type
Figure 21 Glass Cockpit Market Segmentation: By Display Type
Figure 22 Glass Cockpit Market Segmentation: By Display Size
Figure 23 Glass Cockpit Market Segmentation: By Region
Figure 24 Evolution of the Glass Cockpit Display for Aerospace Industry
Figure 25 Reduction in the Workload of Pilots is Majorly Driving the Glass Cockpit Display for Aerospace Market
Figure 26 Fatal Accidents in the Commercial Aviation Industry, By Cause, Since 1950s
Figure 27 Value Chain Analysis: Major Value is Added During the Raw Material Supply and Original Equipment Manufacturing Phase
Figure 28 Display Packagers/Avionics Manufacturers are the Most Essential Part of Glass Cockpit Display for Aerospace’s Supply Chain
Figure 29 Porter’s Five Forces Analysis
Figure 30 Due to the Small Number of Existing Players, Suppliers’ Bargaining Power is Expected to Remain High Between 2014 and 2020
Figure 31 The Impact of Threat of New Entrants is Currently Medium and Would Gradually Decrease to Low By 2020
Figure 32 Legislative Regulations are the Key Factor Strengthening the Substitute’s Market
Figure 33 Technology Factors and the Switching of Suppliers By Buyers are Highly Impacting Suppliers’ Power
Figure 34 Buyers Would Have A Limited Choice During Upgrades Due to Compatibility Issues
Figure 35 The Lesser Number of Players is Giving A Relaxing Spot for New Entrants in the Glass Cockpit Display for Aerospace Market
Figure 36 Trainer Aircraft Closely Followed By the General Aviation Aircraft is Expected to Be the Fastest-Growing Aircraft Type Market
Figure 37 Air Transport Held the Largest Share in the Glass Cockpit Display for Aerospace Market in 2014, Followed By the Fighter Aircraft
Figure 38 Cargo Aircraft, By Display Type, Market Size Comparison (2014 vs. 2020)
Figure 39 Cargo Aircraft, By Display Size, Market Size Comparison (2014 vs. 2020)
Figure 40 Cargo Aircraft, By Geography, Market Size Comparison (2014 vs. 2020)
Figure 41 Fighter Aircraft, By Display Type, Market Size Comparison (2014 vs. 2020)
Figure 42 Fighter Aircraft, By Display Size, Market Size Comparison (2014 vs. 2020)
Figure 43 Fighter Aircraft, By Geography, Market Size Comparison (2014 vs. 2020)
Figure 44 Helicopter, By Display Type, Market Size Comparison (2014 vs. 2020)
Figure 45 Helicopter, By Display Size, Market Size Comparison (2014 vs. 2020)
Figure 46 Helicopter, By Geography, Market Size Comparison (2014 vs. 2020)
Figure 47 Air Transport Aircraft, By Display Type, Market Size Comparison (2014 vs. 2020)
Figure 48 Air Transport Aircraft, By Display Size, Market Size Comparison (2014 vs. 2020)
Figure 49 Air Transport Aircraft, By Geography, Market Size Comparison (2014 vs. 2020)
Figure 50 Trainer Aircraft, By Display Type, Market Size Comparison (2014 vs. 2020)
Figure 51 Trainer Aircraft, By Display Size, Market Size Comparison (2014 vs. 2020)
Figure 52 Trainer Aircraft, By Geography, Market Size Comparison (2014 vs. 2020)
Figure 53 General Aviation Aircraft, By Display Type, Market Size Comparison(2014 vs. 2020)
Figure 54 General Aviation Aircraft, By Display Size, Market Size Comparison (2014 vs. 2020)
Figure 55 General Aviation Aircraft, By Geography, Market Size Comparison (2014 vs. 2020)
Figure 56 Jet Aircraft, By Display Type, Market Size Comparison (2014 vs. 2020)
Figure 57 Business Jet Aircraft, By Display Size, Market Size Comparison (2014 vs. 2020)
Figure 58 Business Jet Aircraft, By Geography, Market Size Comparison (2014 vs. 2020)
Figure 59 Primary Flight Display Accounted for the Largest Share of the Overall Glass Cockpit Display for Aerospace Market in 2013
Figure 60 The Multi-Function Displays Segment is Estimated as the Fastest-Growing Segment Between 2014 and 2020
Figure 61 Primary Flight Display Market Size Comparison (2014 vs. 2020)
Figure 62 Primary Flight Display Market Size Comparison (2014 vs. 2020)
Figure 63 Multi-Function Display Market Size Comparison (2014 vs. 2020)
Figure 64 Multi-Function Display Market Size Comparison (2014 vs. 2020)
Figure 65 Backup Display Market Size Comparison (2014 vs. 2020)
Figure 66 Backup Display Market Size Comparison (2014 vs. 2020)
Figure 67 Mission Display Market Size Comparison (2014 vs. 2020)
Figure 68 Mission Display Market Size Comparison (2014 vs. 2020)
Figure 69 The 5 Inches to 10 Inches Display Size is Considered as the Average Size of Cockpit Display
Figure 70 The Greater Than 10 Inches Display Size Market is Estimated to Grow at the Highest CAGR
Figure 71 Less Than 5 Inches Display Market Size Comparison (2014 vs. 2020)
Figure 72 Less Than 5 Inches Display Market Size Comparison (2014 vs. 2020)
Figure 73 5 Inches to 10 Inches Display Market Size Comparison (2014 vs. 2020)
Figure 74 5 Inches to 10 Inches Display Market Size Comparison (2014 vs. 2020)
Figure 75 Greater Than 10 Inches Display Market Size Comparison (2014 vs. 2020)
Figure 76 Greater Than 10 Inches Display Market Size Comparison (2014 vs. 2020)
Figure 77 Geographic Snapshot
Figure 78 The Americas Dominated the Market in 2013
Figure 79 APAC is Estimated to Grow at the Highest CAGR Between 2014 and 2020
Figure 80 Americas Glass Cockpit Market for Aerospace Snapshot
Figure 81 The Americas Glass Cockpit Market for Aerospace Size Comparison (2014 vs. 2020)
Figure 82 The Americas Glass Cockpit Market for Aerospace Size Comparison (2014 vs. 2020)
Figure 83 The European Glass Cockpit Display for Aerospace Market Snapshot
Figure 84 European Glass Cockpit Market for Aerospace Size Comparison (2014 vs. 2020)
Figure 85 European Glass Cockpit Display for Aerospace Market Size Comparison (2014 vs. 2020)
Figure 86 APAC Glass Cockpit Market for Aerospace Snapshot
Figure 87 APAC Glass Cockpit Market for Aerospace Size Comparison(2014 vs. 2020)
Figure 88 APAC Glass Cockpit Market for Aerospace Size Comparison (2014 vs. 2020)
Figure 89 RoW Glass Cockpit Market for Aerospace Snapshot
Figure 90 RoW Glass Cockpit Market for Aerospace Size Comparison (2014 vs. 2020)
Figure 91 RoW Glass Cockpit Market for Aerospace Size Comparison(2014 vs. 2020)
Figure 92 Companies Adopted Contracts as the Key Growth Strategy Between2013 and 2015
Figure 93 Garmin Ltd. has Emerged as the Fastest-Growing Company Between2010 and 2014
Figure 94 Market Shares of the Top Five Players in the Glass Cockpit Market for Aerospace Market, 2014
Figure 95 Glass Cockpit Market Evaluation Framework
Figure 96 Battle for the Market Share: Contracts is the Key Strategy
Figure 97 Geographic Revenue Mix of the Top Five Market Players
Figure 98 Competitive Benchmarking of the Key Market Players (2010–2014)
Figure 99 Rockwell Collins, Inc.: Company Snapshot
Figure 100 Rockwell Collins, Inc.: SWOT Analysis
Figure 101 Honeywell Aerospace Inc.: Company Snapshot
Figure 102 Honeywell Aerospace Inc.: SWOT Analysis
Figure 103 Esterline Technologies Corporation: Company Snapshot
Figure 104 Esterline Technologies Corporation: SWOT Analysis
Figure 105 Thales SA: Company Snapshot
Figure 106 Thales SA: SWOT Analysis
Figure 107 Garmin Ltd.: Company Snapshot
Figure 108 Garmin Ltd.: SWOT Analysis
Figure 109 Elbit Systems Ltd.: Company Snapshot
Figure 110 L-3 Communications Holdings, Inc.: Company Snapshot
Figure 111 Northrop Grumman Corporation: Company Snapshot
The report is based on an in-depth research study on the glass cockpit displays for aerospace market across different types of aircraft, such as cargo, fighter, helicopter, air transport, general aviation, trainer, and business jet. The report profiles the major active companies in the Glass Cockpit Display Market. The recent developments, contracts received by OEMs, and agreements to strengthen the growth of this market are also briefly discussed. The report also provides the competitive landscapes of the key players, which indicate their growth strategies in terms of the glass cockpit displays for aerospace market.
The report presents glass cockpit market dynamics such as drivers, restraints, and opportunities. Apart from the in-depth view on market segmentation on the basis of aircraft types, display types, display sizes, and geographies, the report also includes the critical market data and qualitative information for each type, along with the qualitative analysis, such as the Porter’s five force analysis, APAC, and RoW.
value chain analysis, supply chain, and market breakdown analysis. The market covered under this report has been segmented as follows:
Market, by Aircraft Type:
The glass cockpit displays for aerospace market, by aircraft type, includes cargo, fighter, helicopter, air transport, general aviation, trainer, and business jet.
Market, by Display Type:
The glass cockpit displays for aerospace market, by display type, includes primary flight display, multi-function display, backup display, and mission display.
Market, by Display Size:
The glass cockpit displays for aerospace market, by display size, has been divided into three different sizes, such as less than 5 inches, 5 inches to 10 inches, and greater than 10 inches.
Market, by Region:
The glass cockpit displays for aerospace market, by region, has been divided into four major segments that include the Americas, Europe, APAC, and RoW.
Major players in this glass cockpit market include Aspen Avionics, Inc. (U.S.), Avidyne Corporation (U.S.), Dynon Avionics (U.S.), Elbit Systems Ltd. (Israel), Esterline Technologies Corporation (U.S.), Garmin Ltd. (Switzerland), Honeywell Aerospace, Inc. (U.S.), L-3 Communication Holdings, Inc. (U.S.), Northrop Grumman Corporation (U.S.), Rockwell Collins, Inc. (U.S.), Thales SA (France), and Universal Avionics Systems Corporation (U.S.), among others.


Growth opportunities and latent adjacency in Glass Cockpit Market