Grid-forming Inverter Market by Power Rating (Below 50 KW, 50-100 KW, Above 100 KW), Voltage ( 100-300 V, 300-500 V, Above 500 V), Type (Micro Inverters, String Inverters, Central Inverters), Application & Region - Global Forecast to 2028
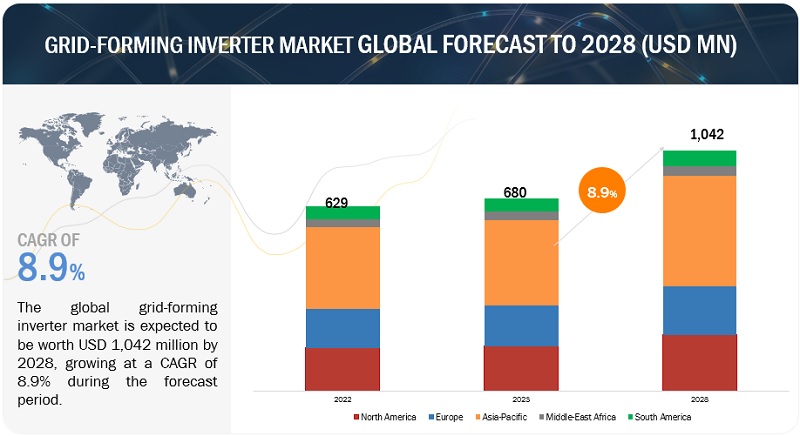
[233 Pages Report] The global Grid-forming inverter market is expected to grow from an estimated USD 680 million in 2023 to USD 1,042 million by 2028, at a CAGR of 8.9% from 2023 to 2028. As the world shifts towards greater adoption of renewable energy sources like solar and wind, the need for grid-forming inverters becomes more pronounced. These inverters play a crucial role in stabilizing the grid and facilitating the smooth integration of intermittent renewable energy into the existing power infrastructure. In regions with underdeveloped or weak grids, grid-forming inverters can provide an effective solution to maintain grid stability and improve power quality.
To know about the assumptions considered for the study, Request for Free Sample Report
To know about the assumptions considered for the study, download the pdf brochure
Grid-forming Inverter Market Dynamics
Driver: Rising Investment in Renewable Energy Sector
Rising investments in the renewable power sector is a key driver of the grid-forming inverter market. As the world transitions toward a more sustainable energy future, there has been a significant increase in investments in renewable power generation technologies such as solar, wind, and hydropower. These investments are driven by various factors, including the need to reduce greenhouse gas emissions, combat climate change, and enhance energy security.
Grid-forming inverters are crucial in integrating renewable power sources into the electrical grid. Unlike traditional grid-tied inverters that rely on stable grid conditions, grid-forming inverters can autonomously control the electrical grid's frequency and voltage. This enables renewable energy sources to contribute to grid stability and operate in islanded or microgrid configurations
Restraint: More espensive then traditional grid-following inverters
Grid-forming inverters are more complex than grid-following inverters because they need to be able to actively control the grid voltage and frequency. This requires more complex control algorithms and hardware. On the other hand, grid-following inverters only need to be able to track the grid voltage and frequency, which can be done with less complex control algorithms and hardware. Thus, grid-forming inverters are typically more expensive than grid-following inverters because of the extra complexity. The additional cost of grid-forming inverters is justified by the benefits they offer, such as improved stability and reliability of the grid and reduced cost of renewable energy integration.
Opportunity: Rising demand for Elctric Vehicles
The rising demand for electric vehicles (EVs) presents a significant opportunity for the grid-forming inverter market. As EV adoption continues to rise, there is a growing need for efficient charging infrastructure and seamless integration of clean power with the electrical grid. Grid-forming inverters play a crucial role in enabling this integration by enabling bi-directional power flow, allowing EVs to not only consume power from the grid but also inject power back into the grid when necessary. This vehicle-to-grid (V2G) capability enhances the flexibility and resilience of the energy system by utilizing the energy storage capacity of EV batteries. Grid-forming inverters enable EVs to act as distributed energy resources, providing grid support services such as load balancing, frequency regulation, and demand response.
Challenge: Grid codes and regulations to pose challenge for grid-forming inverter deployment
Grid codes are a set of regulations that govern the operation of the grid. They typically specify the requirements for the quality of power being generated, as well as the communication protocols used by inverters. Grid codes can vary from country to country and can be complex and difficult to comply with. In some countries, there are economic incentives for the deployment of grid-forming inverters. These incentives can help offset the cost of deploying grid-forming inverters, and they can also help encourage the development of new grid-forming inverter technologies. However, in other countries, there may be no such economic incentives.
Grid-forming inverter Market Ecosystem
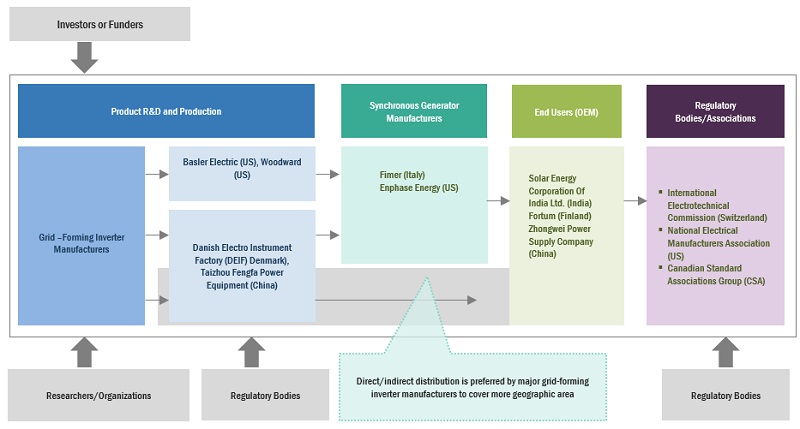
Prominent companies in this market include well-established, financially stable grid-forming inverter manufacturers of market and components. These companies have been operating in the market for several years and possess a diversified product portfolio, state-of-the-art technologies, and strong global sales and marketing networks. Prominent companies in this market include Huawei Technologies Co. Ltd. (China), General Electric (US), SMA Solar Technology (Germany), Games Electric (Spain) and FIMER Group (Italy).
The 50-100 KW segment by power rating holds the second fastest growing segment in 2022
By power rating, grid-forming inverter market is segmented into below 50 KW, 50-100 KW, Above 100 KW. The increasing adoption of solar PV systems and small to medium-sized wind turbines in commercial and industrial applications has created a demand for grid-forming inverters in the 50-100 kW range. These inverters are essential for efficiently integrating renewable energy into the grid and ensuring grid stability. Grid-forming inverters in the 50-100 kW range strike a balance between capacity and cost-effectiveness, making them suitable for a wide range of commercial and industrial applications.
Above 500 V segment by Voltage is estimated to be the second fastest segment for grid-forming inverter market
Above 500 V grid forming inverters are commonly used in utility-scale renewable energy projects, such as large solar farms and wind farms. These inverters are capable of handling high power capacities and efficiently integrating the generated electricity into the grid. The market for above 500 V grid-forming inverters was witnessing significant growth due to the increasing adoption of large-scale renewable energy projects and the need for high-capacity inverters to accommodate them.
Solar PV Plants segment by application is estimated to be the largest segment for Grid-forming Inverter market
Solar PV grid-forming inverters are specialized inverters designed to facilitate the integration of solar photovoltaic (PV) systems into the electrical grid while providing grid-forming capabilities. Solar PV grid-forming inverters play a critical role in modern energy systems, particularly in areas with high renewable energy penetration and the development of microgrids and distributed energy resources. They enable the efficient and reliable integration of solar PV power into the grid while contributing to the overall stability and sustainability of the electricity network.
Europe is expected to account for second largest market during the forecast period.
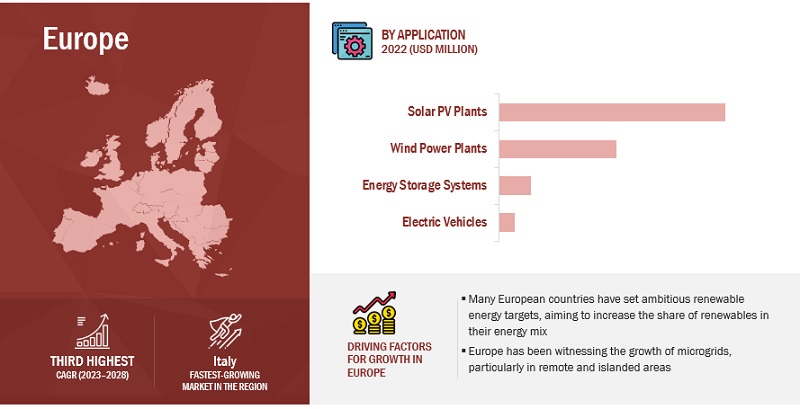
Europe accounted for a 26.1% share of the Grid-forming Inverter market in 2022. The region has been segmented into the Germany, Spain, UK, Netherlands, Italy and rest of europe. The grid-forming inverters have been gaining traction in Europe, driven by the region's increasing focus on renewable energy integration and grid modernization. Grid-forming inverters are becoming essential components of Europe's evolving energy landscape, supporting the integration of renewable energy sources and enabling grid stability and resilience.
Key Market Players
The market is dominated by a few major players that have a wide regional presence. The major players in the Grid-forming Inverter market are Huawei Technologies Co. Ltd. (China), General Electric (US), SMA Solar Technology (Germany), Games Electric (Spain) and FIMER Group (Italy). Between 2018 and 2022, Strategies such as product launches, contracts, agreements, partnerships, collaborations, alliances, acquisitions, and expansions are followed by these companies to capture a larger share of the market.
Scope of the Report
|
Report Metric |
Details |
|
Market Size available for years |
|
|
Base year considered |
|
|
Forecast period |
|
|
Forecast units |
|
|
Segments covered |
|
|
Geographies covered |
|
|
Companies covered |
|
This research report categorizes the grid forming inverter market based on type, application, voltage, power rating, and region.
By Type
- Micro Inverter
- String Inverter
- Central Inverter
By Application
- Solar PV Plants
- Wind Power Plants
- Energy Storage Systems
- Electric Vehicles
By Voltage
- 100–300 V
- 300–500 V
- Above 500 V
By Power Rating
- Below 50 KW
- 50–100 KW
- Above 100 KW
By Region
- North America
- Asia Pacific
- South America
- Europe
- Middle East & Africa
Recent Developments
- In Mar 2022, Huawei Technology has signed a strategic cooperation agreement with Meienergy Technology Co., Ltd. for providing smart PV and energy storage system for the 1 GW utility PV plant and 500 MWh energy storage system in Ghana which is NA developed by Meienergy.
- In Feb 2022, FIMER made a partnership with Vega Solar to supply 14 PVS-100 inverters, three-phase string solution in Albania. The PVS-100 is FIMER’s cloud connected three-phase string inverter solution for cost efficient decentralized photovoltaic systems for both ground mounted and rooftop applications
- In Oct 2021, SMA solar technology AG (SMA) has been chosen to supply central battery inverters to Australian integrated energy company AGL energy limited for world’s largest grid-forming storage project.
Frequently Asked Questions (FAQ):
What is the market size of the Grid-forming inverter market?
The Grid-forming inverter market size is projected to grow from USD 680 million in 2023 to USD 1042 million by 2028, at a CAGR of 8.9% during the forecast period.
What is the major drivers for grid-forming inverter market?
The growing demand for residential solar rooftop installations and distributed energy resources (DERs) has a significant positive impact on the growth of the grid-forming inverter market. As more homeowners and businesses seek to generate their own renewable energy through rooftop solar panels, there is a need for effective integration of these DERs into the grid. Grid-forming inverters enable the seamless connection of residential solar systems and DERs to the electrical grid by providing stability, voltage control, and frequency regulation. This increasing demand for residential solar rooftop installations and DERs directly drives the need for grid-forming inverters, leading to market growth..
Which is the largest-growing region during the forecasted period in grid-forming inverter market?
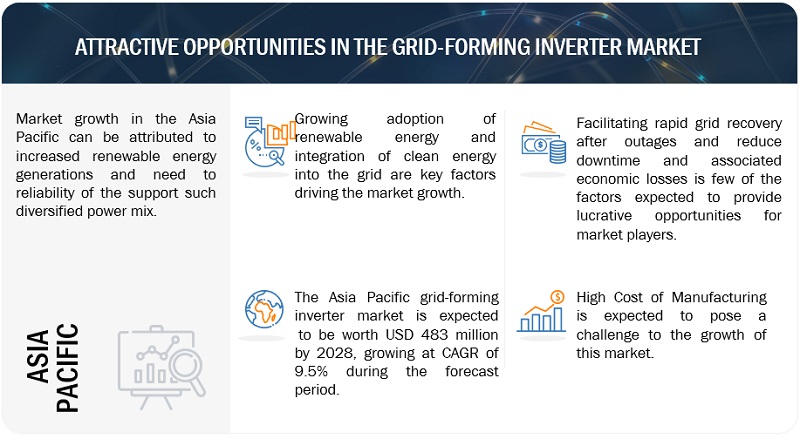
Asia Pacific is expected to account for the largest market size during the forecast period. Asia Pacific region have been gaining momentum due to the growing focus on renewable energy integration, grid modernization, and improving energy resilience. The Asia-Pacific region encompasses a diverse group of countries with varying energy needs and policy priorities.
Which is the second largest-growing segment, by power rating during the forecasted period in grid-forming inverter market?
The Above 100 KW segment, by power rating, is projected to hold the second -largest market share during the forecast period. Many countries and regions are setting ambitious energy transition targets, including increased renewable energy penetration. Above 100 kW grid-forming inverters are essential for supporting the integration of high-capacity renewable energy sources into the grid.
Which is the fastest-growing segment, by voltage during the forecasted period in grid-forming inverter market?
300-500 V, by voltage is projected to be the fastest growing market during the forecast period. These inverters are essential for efficiently integrating distributed energy resources, such as solar PV systems or small wind turbines, into the electrical grid while ensuring grid stability and reliability.
To speak to our analyst for a discussion on the above findings, click Speak to Analyst


- 5.1 INTRODUCTION
-
5.2 MARKET DYNAMICSDRIVERS- Rising investments in renewable energy sector- Growing demand for distributed solar energy resources supported by government-LED incentivesRESTRAINTS- More expensive than traditional grid-following inverters- Grid-forming inverters are not compatible with all existing grid infrastructureOPPORTUNITIES- Rising demand for electric vehicles- Growing investments in smart grid development- Growing adoption of high-power density invertersCHALLENGES- Incompatibility of control algorithms used by grid-forming inverters with grid operating systems- Grid codes and regulations to pose challenge for grid-forming inverter deployment
-
5.3 TRENDS/DISRUPTIONS IMPACTING CUSTOMER BUSINESSREVENUE SHIFT AND NEW REVENUE POCKETS FOR GRID-FORMING INVERTER MANUFACTURERS
-
5.4 TECHNOLOGY ANALYSISADVANCED CONTROL ALGORITHMSIMPROVED COMMUNICATION PROTOCOLSNEW HARDWARE ARCHITECTURESMACHINE LEARNING
- 5.5 KEY CONFERENCES AND EVENTS, 2022–2023
- 5.6 MARKET MAP
-
5.7 VALUE CHAIN ANALYSISRESEARCH AND DEVELOPMENTCOMPONENT PROVIDERSMANUFACTURERS/ASSEMBLERSSYSTEM INTEGRATORS AND DISTRIBUTORSEND USERSPOST-SALES SERVICES
- 5.8 INNOVATIONS AND PATENT REGISTRATIONS
- 5.9 AVERAGE SELLING PRICE TREND
- 5.10 TRADE DATA STATISTICS
-
5.11 CASE STUDY ANALYSISACHIEVE RELIABLE AND STABLE GRID OPERATION- Problem StatementENHANCE STABILITY AND FLEXIBILITY OF LOCAL GRIDCHALLENGES ASSOCIATED WITH GRID STABILITYMAINTAINING GRID STABILITYREGULATORY BODIES, GOVERNMENT AGENCIES, AND OTHER ORGANIZATIONSCODES AND REGULATIONS RELATED TO GRID-FORMING INVERTERS
-
5.12 PORTER’S FIVE FORCES ANALYSISTHREAT OF NEW ENTRANTSBARGAINING POWER OF SUPPLIERSBARGAINING POWER OF BUYERSTHREAT OF SUBSTITUTESINTENSITY OF COMPETITIVE RIVALRY
-
5.13 KEY STAKEHOLDERS AND BUYING CRITERIAKEY STAKEHOLDERS IN BUYING PROCESSBUYING CRITERIA
- 6.1 INTRODUCTION
-
6.2 100–300 VRISING ELECTRICITY DEMAND FROM RESIDENTIAL SECTOR TO DRIVE MARKET
-
6.3 300–500 VNEED FOR EFFICIENT POWER SUPPLY IN COMMERCIAL SECTOR TO PROPEL MARKET
-
6.4 ABOVE 500 VRISING INVESTMENTS IN DEVELOPMENT OF UTILITY-SCALE RENEWABLE POWER PROJECTS TO SUPPORT MARKET GROWTH
- 7.1 INTRODUCTION
-
7.2 BELOW 50 KWRISING DEMAND FOR BELOW 50 KW INVERTERS FROM RESIDENTIAL APPLICATIONS TO DRIVE MARKET
-
7.3 50–100 KWGROWING DEMAND FOR GRID-FORMING INVERTERS IN EV CHARGING INFRASTRUCTURE TO BOOST MARKET GROWTH
-
7.4 ABOVE 100 KWRISING NUMBER OF PV PLANTS AND EXPANDING AUTOMOTIVE INDUSTRY TO FUEL MARKET GROWTH
- 8.1 INTRODUCTION
-
8.2 MICRO INVERTERSADVANCED MONITORING CAPABILITIES OF MICROGRID INVERTERS TO DRIVE MARKETCENTRAL INVERTERS- Rising demand for central inverters in PV plants to fuel market growthSTRING INVERTERS- Low installation costs for solar projects in residential and commercial sectors to boost market
- 9.1 INTRODUCTION
-
9.2 SOLAR PV PLANTSGOVERNMENT-LED INITIATIVES TO PROMOTE INSTALLATION OF SOLAR POWER PLANTS TO FOSTER MARKET GROWTH
-
9.3 WIND POWER PLANTSNEED TO INTEGRATE OFFSHORE WIND POWER WITH POWER SUPPLY GRID TO PROPEL MARKET GROWTH
-
9.4 ELECTRIC VEHICLESRISING ADOPTION OF ELECTRIC VEHICLES AS NEW MODE OF TRANSPORT TO FUEL DEMAND
-
9.5 ENERGY STORAGE SYSTEMSINCREASING NEED FOR ENERGY STORAGE SYSTEMS TO SUPPORT POWER GRID TO DRIVE MARKET
- 10.1 INTRODUCTION
-
10.2 ASIA PACIFICBY POWER RATINGBY VOLTAGEBY TYPEBY APPLICATIONBY COUNTRY- China- India- Japan- Australia- South Korea- Rest of Asia PacificRECESSION IMPACT ON IN ASIA PACIFIC
-
10.3 EUROPEBY POWER RATINGBY VOLTAGEBY TYPEBY APPLICATIONBY COUNTRY- Spain- Germany- France- Netherlands- Italy- UK- Rest of EuropeRECESSION IMPACT ON GRID FORMING INVERTER MARKET IN EUROPE
-
10.4 NORTH AMERICABY POWER RATINGBY VOLTAGEBY TYPEBY APPLICATIONBY COUNTRY- US- Canada- MexicoRECESSION IMPACT ON MARKET IN NORTH AMERICA
-
10.5 SOUTH AMERICABY POWER RATINGBY VOLTAGEBY TYPEBY APPLICATIONBY COUNTRY- Brazil- Argentina- Chile- Rest of South AmericaRECESSION IMPACT ON MARKET IN SOUTH AMERICA
-
10.6 MIDDLE EAST & AFRICABY POWER RATINGBY VOLTAGEBY TYPEBY APPLICATIONBY COUNTRY- Saudi Arabia- Turkey- Egypt- South Africa- Rest of Middle East & AfricaRECESSION IMPACT ON MARKET IN MIDDLE EAST & AFRICA

- 11.1 STRATEGIES ADOPTED BY KEY PLAYERS/RIGHT TO WIN
- 11.2 MARKET SHARE ANALYSIS OF TOP FIVE PLAYERS
- 11.3 REVENUE ANALYSIS OF TOP FIVE MARKET PLAYERS
-
11.4 KEY COMPANY EVALUATION MATRIX, 2022STARSPERVASIVE PLAYERSEMERGING LEADERSPARTICIPANTS
-
11.5 STARTUPS/SMES EVALUATION MATRIX, 2022PROGRESSIVE COMPANIESRESPONSIVE COMPANIESDYNAMIC COMPANIESSTARTING BLOCKSCOMPETITIVE BENCHMARKING
- 11.6 GRID-FORMING INVERTER MARKET: COMPANY FOOTPRINT
- 11.7 COMPETITIVE SCENARIO
-
12.1 KEY PLAYERSHUAWEI TECHNOLOGIES CO., LTD.- Business and financial overview- Products/Solutions/Services offered- Recent developments- MnM viewSUNGROW- Business and financial overview- Products/Solutions/Services offered- Recent developments- MnM viewSMA SOLAR TECHNOLOGY AG- Business and financial overview- Products/Solutions/Services offered- Recent developments- MnM viewPOWER ELECTRONICS S.L.- Business and financial overview- Products/Solutions/Services offered- Recent developments- MnM viewFIMER GROUP- Business and financial overview- Products/Solutions/Services offered- Recent developments- MnM viewSOLAREDGE TECHNOLOGIES- Business and financial overview- Products/Solutions/Services offered- Recent developmentsFRONIUS INTERNATIONAL GMBH- Business and financial overview- Products/Solutions/Services offered- Recent developmentsGOODWE- Business and financial overview- Products/Solutions/Services offered- Recent developmentsENPHASE ENERGY- Business and financial overview- Products/Solutions/Services offered- Recent developmentsSCHNEIDER ELECTRIC- Business and financial overview- Products/Solutions/Services offered- Recent developmentsGENERAL ELECTRIC- Business and financial overview- Products/Solutions/Services offered- Recent developmentsDELTA ELECTRONICS, INC.- Business and financial overview- Products/Solutions/Services offered- Recent developmentsKACO NEW ENERGY- Business and financial overview- Products/Solutions/Services offered- Recent developmentsTMEIC- Business and financial overview- Products/Solutions/Services offered- Recent developmentsGAMESA ELECTRIC- Business and financial overview- Products/Solutions/Services offered- Recent developments
-
12.2 OTHER PLAYERSDELPHI TECHNOLOGIESSENSATA TECHNOLOGIES, INC.ALTENERGY POWER SYSTEM INC.GROWATT NEW ENERGYTBEA XINJIANG SUNOASIS
- 13.1 DISCUSSION GUIDE
- 13.2 KNOWLEDGESTORE: MARKETSANDMARKETS’ SUBSCRIPTION PORTAL
- 13.3 CUSTOMIZATION OPTIONS
- 13.4 RELATED REPORTS
- 13.5 AUTHOR DETAILS
- TABLE 1 GRID-FORMING INVERTER MARKET, BY POWER RATING: INCLUSIONS AND EXCLUSIONS
- TABLE 2 MARKET, BY VOLTAGE: INCLUSIONS AND EXCLUSIONS
- TABLE 3 MARKET, BY TYPE: INCLUSIONS AND EXCLUSIONS
- TABLE 4 MARKET, BY APPLICATION: INCLUSIONS AND EXCLUSIONS
- TABLE 5 MARKET SNAPSHOT
- TABLE 6 MARKET: DETAILED LIST OF CONFERENCES AND EVENTS
- TABLE 7 MARKET: PATENTS AND INNOVATIONS
- TABLE 8 ELECTRICAL STATIC CONVERTER MARKET: IMPORT STATISTICS, 2019–2021 (USD MILLION)
- TABLE 9 ELECTRICAL STATIC CONVERTER MARKET: EXPORT STATISTICS, 2019–2021 (USD MILLION)
- TABLE 10 NORTH AMERICA: LIST OF REGULATORY BODIES, GOVERNMENT AGENCIES, AND OTHER ORGANIZATIONS
- TABLE 11 EUROPE: LIST OF REGULATORY BODIES, GOVERNMENT AGENCIES, AND OTHER ORGANIZATIONS
- TABLE 12 ASIA PACIFIC: LIST OF REGULATORY BODIES, GOVERNMENT AGENCIES, AND OTHER ORGANIZATIONS
- TABLE 13 ROW: LIST OF REGULATORY BODIES, GOVERNMENT AGENCIES, AND OTHER ORGANIZATIONS
- TABLE 14 GLOBAL: LIST OF REGULATORY BODIES, GOVERNMENT AGENCIES, AND OTHER ORGANIZATIONS
- TABLE 15 GLOBAL: CODES AND REGULATIONS
- TABLE 16 GRID-FORMING INVERTER MARKET: PORTER’S FIVE FORCES ANALYSIS
- TABLE 17 INFLUENCE OF STAKEHOLDERS ON BUYING PROCESS, BY END USER (%)
- TABLE 18 KEY BUYING CRITERIA, BY END USER
- TABLE 19 MARKET, BY VOLTAGE, 2021–2028 (USD MILLION)
- TABLE 20 GRID-FORMING INVERTER MARKET, BY VOLTAGE, 2029–2033 (USD MILLION)
- TABLE 21 100–300 V: MARKET, BY REGION, 2021–2028 (USD MILLION)
- TABLE 22 100–300 V: MARKET, BY REGION, 2029–2033 (USD MILLION)
- TABLE 23 300–500 V: MARKET, BY REGION, 2021–2028 (USD MILLION)
- TABLE 24 300–500 V: MARKET, BY REGION, 2029–2033 (USD MILLION)
- TABLE 25 ABOVE 500 V: MARKET, BY REGION, 2021–2028 (USD MILLION)
- TABLE 26 ABOVE 500 V: MARKET, BY REGION, 2029–2033 (USD MILLION)
- TABLE 27 MARKET, BY POWER RATING, 2021–2028 (USD MILLION)
- TABLE 28 GRID-FORMING INVERTER MARKET, BY POWER RATING, 2029–2033 (USD MILLION)
- TABLE 29 BELOW 50 KW: MARKET, BY REGION, 2021–2028 (USD MILLION)
- TABLE 30 BELOW 50 KW: MARKET, BY REGION, 2029–2033 (USD MILLION)
- TABLE 31 50–100 KW: MARKET, BY REGION, 2021–2028 (USD MILLION)
- TABLE 32 50–100 KW: MARKET, BY REGION, 2029–2033 (USD MILLION)
- TABLE 33 ABOVE 100 KW: MARKET, BY REGION, 2021–2028 (USD MILLION)
- TABLE 34 ABOVE 100 KW: MARKET, BY REGION, 2029–2033 (USD MILLION)
- TABLE 35 GRID-FORMING INVERTER MARKET, BY TYPE, 2021–2028 (USD MILLION)
- TABLE 36 MARKET, BY TYPE, 2029–2033 (USD MILLION)
- TABLE 37 MICRO INVERTERS: MARKET, BY REGION, 2021–2028 (USD MILLION)
- TABLE 38 MICRO INVERTERS: MARKET, BY REGION, 2029–2033 (USD MILLION)
- TABLE 39 CENTRAL INVERTERS: MARKET, BY REGION, 2021–2028 (USD MILLION)
- TABLE 40 CENTRAL INVERTERS: MARKET, BY REGION, 2029–2033 (USD MILLION)
- TABLE 41 STRING INVERTERS: MARKET, BY REGION, 2021–2028 (USD MILLION)
- TABLE 42 STRING INVERTERS: MARKET, BY REGION, 2029–2033 (USD MILLION)
- TABLE 43 MARKET, BY APPLICATION, 2021–2028 (USD MILLION)
- TABLE 44 GRID-FORMING INVERTER MARKET, BY APPLICATION, 2029–2033 (USD MILLION)
- TABLE 45 SOLAR PV PLANTS: MARKET, BY REGION, 2021–2028 (USD MILLION)
- TABLE 46 SOLAR PV PLANTS: MARKET, BY REGION, 2029–2033 (USD MILLION)
- TABLE 47 WIND POWER PLANTS: MARKET, BY REGION, 2021–2028 (USD MILLION)
- TABLE 48 WIND POWER PLANTS: MARKET, BY REGION, 2029–2033 (USD MILLION)
- TABLE 49 ELECTRIC VEHICLES: MARKET, BY REGION, 2021–2028 (USD MILLION)
- TABLE 50 ELECTRIC VEHICLES: MARKET, BY REGION, 2029–2033 (USD MILLION)
- TABLE 51 ENERGY STORAGE SYSTEMS: MARKET, BY REGION, 2021–2028 (USD MILLION)
- TABLE 52 ENERGY STORAGE SYSTEMS: MARKET, BY REGION, 2029–2033 (USD MILLION)
- TABLE 53 GRID-FORMING INVERTER MARKET, BY REGION, 2021–2028 (USD MILLION)
- TABLE 54 MARKET, BY REGION, 2029–2033 (USD MILLION)
- TABLE 55 ASIA PACIFIC: GRID-FORMING INVERTER MARKET, BY POWER RATING, 2021–2028 (USD MILLION)
- TABLE 56 ASIA PACIFIC: MARKET, BY POWER RATING, 2029–2033 (USD MILLION)
- TABLE 57 ASIA PACIFIC: MARKET, BY VOLTAGE, 2021–2028 (USD MILLION)
- TABLE 58 ASIA PACIFIC: MARKET, BY VOLTAGE, 2029–2033 (USD MILLION)
- TABLE 59 ASIA PACIFIC: MARKET, BY TYPE, 2021–2028 (USD MILLION)
- TABLE 60 ASIA PACIFIC: MARKET, BY TYPE, 2029–2033 (USD MILLION)
- TABLE 61 ASIA PACIFIC: MARKET, BY APPLICATION, 2021–2028 (USD MILLION)
- TABLE 62 ASIA PACIFIC: MARKET, BY APPLICATION, 2029–2033 (USD MILLION)
- TABLE 63 ASIA PACIFIC: MARKET, BY COUNTRY, 2021–2028 (USD MILLION)
- TABLE 64 ASIA PACIFIC: MARKET, BY COUNTRY, 2029–2033 (USD MILLION)
- TABLE 65 CHINA: MARKET, BY APPLICATION, 2021–2028 (USD MILLION)
- TABLE 66 CHINA: MARKET, BY APPLICATION, 2029–2033 (USD MILLION)
- TABLE 67 INDIA: MARKET, BY APPLICATION, 2021–2028 (USD MILLION)
- TABLE 68 INDIA: MARKET, BY APPLICATION, 2029–2033 (USD MILLION)
- TABLE 69 JAPAN: MARKET, BY APPLICATION, 2021–2028 (USD MILLION)
- TABLE 70 JAPAN: MARKET, BY APPLICATION, 2029–2033 (USD MILLION)
- TABLE 71 AUSTRALIA: MARKET, BY APPLICATION, 2021–2028 (USD MILLION)
- TABLE 72 AUSTRALIA: MARKET, BY APPLICATION, 2029–2033 (USD MILLION)
- TABLE 73 SOUTH KOREA: MARKET, BY APPLICATION, 2021–2028 (USD MILLION)
- TABLE 74 SOUTH KOREA: MARKET, BY APPLICATION, 2029–2033 (USD MILLION)
- TABLE 75 REST OF ASIA PACIFIC: MARKET, BY APPLICATION, 2021–2028 (USD MILLION)
- TABLE 76 REST OF ASIA PACIFIC: MARKET, BY APPLICATION, 2029–2033 (USD MILLION)
- TABLE 77 EUROPE: GRID-FORMING INVERTER MARKET, BY POWER RATING, 2021–2028 (USD MILLION)
- TABLE 78 EUROPE: MARKET, BY POWER RATING, 2029–2033 (USD MILLION)
- TABLE 79 EUROPE: MARKET, BY VOLTAGE, 2021–2028 (USD MILLION)
- TABLE 80 EUROPE: MARKET, BY VOLTAGE, 2029–2033 (USD MILLION)
- TABLE 81 EUROPE: MARKET, BY TYPE, 2021–2028 (USD MILLION)
- TABLE 82 EUROPE: MARKET, BY TYPE, 2029–2033 (USD MILLION)
- TABLE 83 EUROPE: MARKET, BY APPLICATION, 2021–2028 (USD MILLION)
- TABLE 84 EUROPE: MARKET, BY APPLICATION, 2029–2033 (USD MILLION)
- TABLE 85 EUROPE: MARKET, BY COUNTRY, 2021–2028 (USD MILLION)
- TABLE 86 EUROPE: MARKET, BY COUNTRY, 2029–2033 (USD MILLION)
- TABLE 87 SPAIN: MARKET, BY APPLICATION, 2021–2028 (USD MILLION)
- TABLE 88 SPAIN: MARKET, BY APPLICATION, 2029–2033 (USD MILLION)
- TABLE 89 GERMANY: MARKET, BY APPLICATION, 2021–2028 (USD MILLION)
- TABLE 90 GERMANY: MARKET, BY APPLICATION, 2029–2033 (USD MILLION)
- TABLE 91 FRANCE: MARKET, BY APPLICATION, 2021–2028 (USD MILLION)
- TABLE 92 FRANCE: MARKET, BY APPLICATION, 2029–2033 (USD MILLION)
- TABLE 93 NETHERLANDS: MARKET, BY APPLICATION, 2021–2028 (USD MILLION)
- TABLE 94 NETHERLANDS: MARKET, BY APPLICATION, 2029–2033 (USD MILLION)
- TABLE 95 ITALY: MARKET, BY APPLICATION, 2021–2028 (USD MILLION)
- TABLE 96 ITALY: MARKET, BY APPLICATION, 2029–2033 (USD MILLION)
- TABLE 97 UK: MARKET, BY APPLICATION, 2021–2028 (USD MILLION)
- TABLE 98 UK: MARKET, BY APPLICATION, 2029–2033 (USD MILLION)
- TABLE 99 REST OF EUROPE: MARKET, BY APPLICATION, 2021–2028 (USD MILLION)
- TABLE 100 REST OF EUROPE: MARKET, BY APPLICATION, 2029–2033 (USD MILLION)
- TABLE 101 NORTH AMERICA: GRID-FORMING INVERTER MARKET, BY POWER RATING, 2021–2028 (USD MILLION)
- TABLE 102 NORTH AMERICA: MARKET, BY POWER RATING, 2029–2033 (USD MILLION)
- TABLE 103 NORTH AMERICA: MARKET, BY VOLTAGE, 2021–2028 (USD MILLION)
- TABLE 104 NORTH AMERICA: MARKET, BY VOLTAGE, 2029–2033 (USD MILLION)
- TABLE 105 NORTH AMERICA: MARKET, BY TYPE, 2021–2028 (USD MILLION)
- TABLE 106 NORTH AMERICA: MARKET, BY TYPE, 2029–2033 (USD MILLION)
- TABLE 107 NORTH AMERICA: MARKET, BY APPLICATION, 2021–2028 (USD MILLION)
- TABLE 108 NORTH AMERICA: MARKET, BY APPLICATION, 2029–2033 (USD MILLION)
- TABLE 109 NORTH AMERICA: MARKET, BY COUNTRY, 2021–2028 (USD MILLION)
- TABLE 110 NORTH AMERICA: MARKET, BY COUNTRY, 2029–2033 (USD MILLION)
- TABLE 111 US: GRID FORMING INVERTER MARKET, BY APPLICATION, 2021–2028 (USD MILLION)
- TABLE 112 US: MARKET, BY APPLICATION, 2029–2033 (USD MILLION)
- TABLE 113 CANADA: MARKET, BY APPLICATION, 2021–2028 (USD MILLION)
- TABLE 114 CANADA: MARKET, BY APPLICATION, 2029–2033 (USD MILLION)
- TABLE 115 MEXICO: MARKET, BY APPLICATION, 2021–2028 (USD MILLION)
- TABLE 116 MEXICO: MARKET, BY APPLICATION, 2029–2033 (USD MILLION)
- TABLE 117 SOUTH AMERICA: GRID-FORMING INVERTER MARKET, BY POWER RATING, 2021–2028 (USD MILLION)
- TABLE 118 SOUTH AMERICA: MARKET, BY POWER RATING, 2029–2033 (USD MILLION)
- TABLE 119 SOUTH AMERICA: MARKET, BY VOLTAGE, 2021–2028 (USD MILLION)
- TABLE 120 SOUTH AMERICA: MARKET, BY VOLTAGE, 2029–2033 (USD MILLION)
- TABLE 121 SOUTH AMERICA: MARKET, BY TYPE, 2021–2028 (USD MILLION)
- TABLE 122 SOUTH AMERICA: MARKET, BY TYPE, 2029–2033 (USD MILLION)
- TABLE 123 SOUTH AMERICA: MARKET, BY APPLICATION, 2021–2028 (USD MILLION)
- TABLE 124 SOUTH AMERICA: MARKET, BY APPLICATION, 2029–2033 (USD MILLION)
- TABLE 125 SOUTH AMERICA: MARKET, BY COUNTRY, 2021–2028 (USD MILLION)
- TABLE 126 SOUTH AMERICA: MARKET, BY COUNTRY, 2029–2033 (USD MILLION)
- TABLE 127 BRAZIL: MARKET, BY APPLICATION, 2021–2028 (USD MILLION)
- TABLE 128 BRAZIL: MARKET, BY APPLICATION, 2029–2033 (USD MILLION)
- TABLE 129 ARGENTINA: MARKET, BY APPLICATION, 2021–2028 (USD MILLION)
- TABLE 130 ARGENTINA: MARKET, BY APPLICATION, 2029–2033 (USD MILLION)
- TABLE 131 CHILE: MARKET, BY APPLICATION, 2021–2028 (USD MILLION)
- TABLE 132 CHILE: MARKET, BY APPLICATION, 2029–2033 (USD MILLION)
- TABLE 133 REST OF SOUTH AMERICA: MARKET, BY APPLICATION, 2021–2028 (USD MILLION)
- TABLE 134 REST OF SOUTH AMERICA: MARKET, BY APPLICATION, 2029–2033 (USD MILLION)
- TABLE 135 MIDDLE EAST & AFRICA: GRID-FORMING INVERTER MARKET, BY POWER RATING, 2021–2028 (USD MILLION)
- TABLE 136 MIDDLE EAST & AFRICA: MARKET, BY POWER RATING, 2029–2033 (USD MILLION)
- TABLE 137 MIDDLE EAST & AFRICA: MARKET, BY VOLTAGE, 2021–2028 (USD MILLION)
- TABLE 138 MIDDLE EAST & AFRICA: MARKET, BY VOLTAGE, 2029–2033 (USD MILLION)
- TABLE 139 MIDDLE EAST & AFRICA: MARKET, BY TYPE, 2021–2028 (USD MILLION)
- TABLE 140 MIDDLE EAST & AFRICA: MARKET, BY TYPE, 2029–2033 (USD MILLION)
- TABLE 141 MIDDLE EAST & AFRICA: MARKET, BY APPLICATION, 2021–2028 (USD MILLION)
- TABLE 142 MIDDLE EAST & AFRICA: MARKET, BY APPLICATION, 2029–2033 (USD MILLION)
- TABLE 143 MIDDLE EAST & AFRICA: MARKET, BY COUNTRY, 2021–2028 (USD MILLION)
- TABLE 144 MIDDLE EAST & AFRICA: MARKET, BY COUNTRY, 2029–2033 (USD MILLION)
- TABLE 145 SAUDI ARABIA: MARKET, BY APPLICATION, 2021–2028 (USD MILLION)
- TABLE 146 SAUDI ARABIA: MARKET, BY APPLICATION, 2029–2033 (USD MILLION)
- TABLE 147 TURKEY: MARKET, BY APPLICATION, 2021–2028 (USD MILLION)
- TABLE 148 TURKEY: MARKET, BY APPLICATION, 2029–2033 (USD MILLION)
- TABLE 149 EGYPT: MARKET, BY APPLICATION, 2021–2028 (USD MILLION)
- TABLE 150 EGYPT: MARKET, BY APPLICATION, 2029–2033 (USD MILLION)
- TABLE 151 SOUTH AFRICA: GRID-FORMING INVERTER MARKET, BY APPLICATION, 2021–2028 (USD MILLION)
- TABLE 152 SOUTH AFRICA: MARKET, BY APPLICATION, 2029–2033 (USD MILLION)
- TABLE 153 REST OF MIDDLE EAST & AFRICA: MARKET, BY APPLICATION, 2021–2028 (USD MILLION)
- TABLE 154 REST OF MIDDLE EAST & AFRICA: MARKET, BY APPLICATION, 2029–2033 (USD MILLION)
- TABLE 155 OVERVIEW OF STRATEGIES ADOPTED BY TOP PLAYERS, JANUARY 2019–MARCH 2023
- TABLE 156 GRID-FORMING INVERTER MARKET: DETAILED LIST OF KEY STARTUPS/SMES
- TABLE 157 GRID FORMING INVERTER MARKET: COMPETITIVE BENCHMARKING OF KEY STARTUPS/SMES
- TABLE 158 COMPANY FOOTPRINT, BY TYPE
- TABLE 159 COMPANY FOOTPRINT, BY POWER RATING
- TABLE 160 COMPANY FOOTPRINT, BY REGION
- TABLE 161 COMPANY FOOTPRINT
- TABLE 162 GRID-FORMING INVERTER MARKET: PRODUCT LAUNCHES, SEPTEMBER 2019–JULY 2023
- TABLE 163 MARKET: DEALS, NOVEMBER 2019–JULY 2023
- TABLE 164 MARKET: OTHERS, NOVEMBER 2021–JULY 2023
- TABLE 165 HUAWEI TECHNOLOGIES CO., LTD.: BUSINESS OVERVIEW
- TABLE 166 HUAWEI TECHNOLOGIES CO., LTD.: PRODUCT/SOLUTION/SERVICE OFFERED
- TABLE 167 HUAWEI TECHNOLOGIES CO., LTD.: PRODUCT LAUNCH
- TABLE 168 HUAWEI TECHNOLOGIES CO., LTD.: DEAL
- TABLE 169 SUNGROW: BUSINESS OVERVIEW
- TABLE 170 SUNGROW: PRODUCT/SOLUTION/SERVICE OFFERED
- TABLE 171 SUNGROW: PRODUCT LAUNCH
- TABLE 172 SUNGROW: DEAL
- TABLE 173 SUNGROW: OTHER
- TABLE 174 SMA SOLAR TECHNOLOGY AG: BUSINESS OVERVIEW
- TABLE 175 SMA SOLAR TECHNOLOGY AG: PRODUCT/SOLUTION/SERVICE OFFERED
- TABLE 176 SMA SOLAR TECHNOLOGY AG: PRODUCT LAUNCH
- TABLE 177 SMA SOLAR TECHNOLOGY AG: DEAL
- TABLE 178 SMA SOLAR TECHNOLOGY AG: OTHER
- TABLE 179 POWER ELECTRONICS S.L.: BUSINESS OVERVIEW
- TABLE 180 POWER ELECTRONICS S.L.: PRODUCT/SOLUTION/SERVICE OFFERED
- TABLE 181 POWER ELECTRONICS S.L.: PRODUCT LAUNCH
- TABLE 182 FIMER GROUP: BUSINESS OVERVIEW
- TABLE 183 FIMER GROUP: PRODUCT/SOLUTION/SERVICE OFFERED
- TABLE 184 FIMER: DEAL
- TABLE 185 FIMER: OTHER
- TABLE 186 SOLAREDGE TECHNOLOGIES: BUSINESS OVERVIEW
- TABLE 187 SOLAREDGE TECHNOLOGIES: PRODUCT/SOLUTION/SERVICE OFFERED
- TABLE 188 SOLAREDGE TECHNOLOGIES: PRODUCT LAUNCH
- TABLE 189 SOLAREDGE TECHNOLOGIES: DEALS
- TABLE 190 FRONIUS INTERNATIONAL GMBH: BUSINESS OVERVIEW
- TABLE 191 FRONIUS INTERNATIONAL GMBH: PRODUCT/SOLUTION/SERVICE OFFERED
- TABLE 192 FRONIUS INTERNATIONAL GMBH: DEAL
- TABLE 193 GOODWE: BUSINESS OVERVIEW
- TABLE 194 GOODWE: PRODUCT/SOLUTION/SERVICE OFFERED
- TABLE 195 GOODWE: OTHERS
- TABLE 196 ENPHASE ENERGY: BUSINESS OVERVIEW
- TABLE 197 ENPHASE ENERGY: PRODUCT/SOLUTION/SERVICE OFFERED
- TABLE 198 ENPHASE ENERGY: PRODUCT LAUNCH
- TABLE 199 ENPHASE ENERGY: DEAL
- TABLE 200 SCHNEIDER ELECTRIC: BUSINESS OVERVIEW
- TABLE 201 SCHNEIDER ELECTRIC: PRODUCT/SOLUTION/SERVICE OFFERED
- TABLE 202 SCHNEIDER ELECTRIC: DEAL
- TABLE 203 SCHNEIDER ELECTRIC: OTHER
- TABLE 204 GENERAL ELECTRIC: BUSINESS OVERVIEW
- TABLE 205 GENERAL ELECTRIC: PRODUCT/SOLUTION/SERVICE OFFERED
- TABLE 206 GENERAL ELECTRIC: OTHER
- TABLE 207 DELTA ELECTRONICS, INC.: BUSINESS OVERVIEW
- TABLE 208 DELTA ELECTRONICS: PRODUCT/SOLUTION/SERVICE OFFERED
- TABLE 209 DELTA ELECTRONICS: PRODUCT LAUNCH
- TABLE 210 DELTA ELECTRONICS: DEAL
- TABLE 211 DELTA ELECTRONICS: OTHER
- TABLE 212 KACO NEW ENERGY: BUSINESS OVERVIEW
- TABLE 213 KACO NEW ENERGY: PRODUCT/SOLUTION/SERVICE OFFERED
- TABLE 214 KACO NEW ENERGY: PRODUCT LAUNCH
- TABLE 215 KACO NEW ENERGY: DEAL
- TABLE 216 TMEIC: BUSINESS OVERVIEW
- TABLE 217 TMEIC: PRODUCT/SOLUTION/SERVICE OFFERED
- TABLE 218 TMEIC: DEAL
- TABLE 219 GAMESA ELECTRIC: BUSINESS OVERVIEW
- TABLE 220 GAMESA ELECTRIC: PRODUCT/SOLUTION/SERVICE OFFERED
- TABLE 221 GAMESA ELECTRIC: PRODUCT LAUNCH
- FIGURE 1 GRID FORMING INVERTER MARKET SEGMENTATION
- FIGURE 2 GRID-FORMING INVERTER MARKET: RESEARCH DESIGN
- FIGURE 3 DATA TRIANGULATION METHODOLOGY
- FIGURE 4 MAIN METRICS CONSIDERED TO ANALYZE AND ASSESS DEMAND FOR GRID-FORMING INVERTERS
- FIGURE 5 MARKET SIZE ESTIMATION METHODOLOGY: BOTTOM-UP APPROACH
- FIGURE 6 MARKET SIZE ESTIMATION METHODOLOGY: TOP-DOWN APPROACH
- FIGURE 7 KEY STEPS CONSIDERED TO ASSESS SUPPLY OF GRID-FORMING INVERTERS
- FIGURE 8 MARKET: SUPPLY-SIDE ANALYSIS
- FIGURE 9 COMPANY REVENUE ANALYSIS, 2022
- FIGURE 10 BELOW 50 KW SEGMENT TO DOMINATE MARKET, BY POWER RATING, IN 2028
- FIGURE 11 300–500 V TO BE FASTEST-GROWING SEGMENT IN MARKET, BY VOLTAGE, DURING 2023–2028
- FIGURE 12 CENTRAL INVERTERS TO EXHIBIT HIGHEST CAGR IN GRID-FORMING INVERTER MARKET, BY TYPE, DURING FORECAST PERIOD
- FIGURE 13 SOLAR PV PLANTS TO HOLD LARGEST SHARE OF MARKET, BY APPLICATION, IN 2028
- FIGURE 14 ASIA PACIFIC ACCOUNTED FOR LARGEST SHARE OF GRID FORMING INVERTER MARKET IN 2022
- FIGURE 15 INCREASING INSTALLATION OF RENEWABLE ENERGY PROJECTS AND INTEGRATION OF CLEAN POWER INTO GRIDS TO CREATE OPPORTUNITIES FOR PLAYERS IN GRID FORMING INVERTER MARKET
- FIGURE 16 SOLAR PV PLANTS AND CHINA TO HOLD LARGEST SHARES OF GRID FORMING INVERTER MARKET IN ASIA PACIFIC IN 2033
- FIGURE 17 BELOW 50 KW SEGMENT TO DOMINATE MARKET IN 2033
- FIGURE 18 ABOVE 500 V SEGMENT TO HOLD LARGEST SHARE OF GRID-FORMING INVERTER MARKET IN 2033
- FIGURE 19 CENTRAL INVERTERS TO LEAD MARKET IN 2033
- FIGURE 20 SOLAR PV PLANTS TO LEAD MARKET IN 2033
- FIGURE 21 GRID-FORMING INVERTER MARKET: DRIVERS, RESTRAINTS, OPPORTUNITIES, AND CHALLENGES
- FIGURE 22 GLOBAL INVESTMENTS IN RENEWABLE ENERGY SECTOR
- FIGURE 23 GLOBAL SOLAR PV ELECTRICITY GENERATION
- FIGURE 24 ANNUAL CLEAN ENERGY INVESTMENTS IN ELECTRIC VEHICLES
- FIGURE 25 REVENUE SHIFT AND NEW REVENUE POCKETS FOR PLAYERS IN MARKET
- FIGURE 26 GRID-FORMING INVERTER MARKET MAP
- FIGURE 27 MARKET VALUE CHAIN
- FIGURE 28 AVERAGE SELLING PRICE OF GRID-FORMING INVERTERS OF DIFFERENT OUTPUT POWER RATINGS
- FIGURE 29 MARKET: PORTER’S FIVE FORCES ANALYSIS
- FIGURE 30 INFLUENCE OF STAKEHOLDERS ON BUYING PROCESS, BY END USER
- FIGURE 31 KEY BUYING CRITERIA FOR END USERS
- FIGURE 32 GRID-FORMING INVERTER MARKET SHARE, BY VOLTAGE, 2022
- FIGURE 33 GRID-FORMING INVERTER MARKET SHARE, BY POWER RATING, 2022
- FIGURE 34 GRID-FORMING INVERTER MARKET SHARE, BY TYPE, 2022
- FIGURE 35 GRID-FORMING INVERTER MARKET SHARE, BY APPLICATION, 2022
- FIGURE 36 MARKET, BY REGION, 2022
- FIGURE 37 MARKET IN ASIA PACIFIC TO REGISTER HIGHEST CAGR FROM 2023 TO 2028
- FIGURE 38 ASIA PACIFIC: GRID FORMING INVERTER MARKET SNAPSHOT
- FIGURE 39 EUROPE: MARKET SNAPSHOT
- FIGURE 40 GRID-FORMING INVERTER MARKET SHARE ANALYSIS, 2022
- FIGURE 41 TOP PLAYERS IN MARKET FROM 2018 TO 2022
- FIGURE 42 MARKET (GLOBAL): KEY COMPANY EVALUATION MATRIX, 2022
- FIGURE 43 MARKET: STARTUPS/SMES EVALUATION MATRIX, 2022
- FIGURE 44 HUAWEI TECHNOLOGIES CO., LTD.: COMPANY SNAPSHOT
- FIGURE 45 SUNGROW: COMPANY SNAPSHOT
- FIGURE 46 SMA SOLAR TECHNOLOGY AG: COMPANY SNAPSHOT
- FIGURE 47 SOLAREDGE TECHNOLOGIES: COMPANY SNAPSHOT
- FIGURE 48 ENPHASE ENERGY: COMPANY SNAPSHOT
- FIGURE 49 SCHNEIDER ELECTRIC: COMPANY SNAPSHOT
- FIGURE 50 GENERAL ELECTRIC: COMPANY SNAPSHOT
- FIGURE 51 DELTA ELECTRONICS, INC.: COMPANY SNAPSHOT
- FIGURE 52 INSIGHTS FROM INDUSTRY EXPERTS
This study involved major activities in estimating the current size of the grid-forming inverter market. Comprehensive secondary research was done to collect information on the market, peer market, and parent market. The next step involved was the validation of these findings, assumptions, and market sizing with industry experts across the value chain through primary research. The total market size was estimated through country-wise analysis. Then, the market breakdown and data triangulation were performed to estimate the market size of the segments and sub-segments.
Secondary Research
The secondary research involved the use of extensive secondary sources, directories, and databases, such as Hoover’s, Bloomberg BusinessWeek, Factiva, and OneSource, to identify and collect information useful for a technical, market-oriented, and commercial study of the global grid forming inverter market. The other secondary sources comprised press releases & investor presentations of companies, white papers, certified publications, articles by recognized authors, manufacturers, associations, trade directories, and databases.
Primary Research
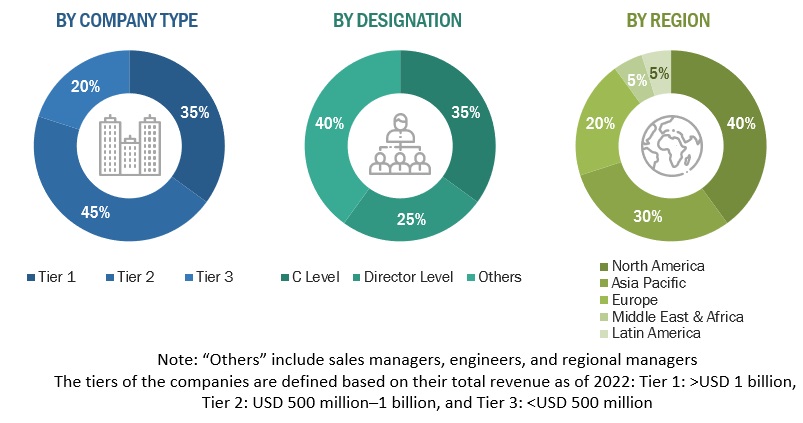
The grid-forming inverter market comprises several stakeholders, such as component providers, product manufacturers, distributors, and end-users in the supply chain. The demand side of this market is characterized by industrial end-users. Moreover, the demand is also fueled by the growing demand of the renewable energy sector. The supply side is characterized by rising demand for contracts from the industrial sector, and mergers & acquisitions among big players. Various primary sources from both the supply and demand sides of the market were interviewed to obtain qualitative and quantitative information. Following is the breakdown of primary respondents:
To know about the assumptions considered for the study, download the pdf brochure
Market Size Estimation
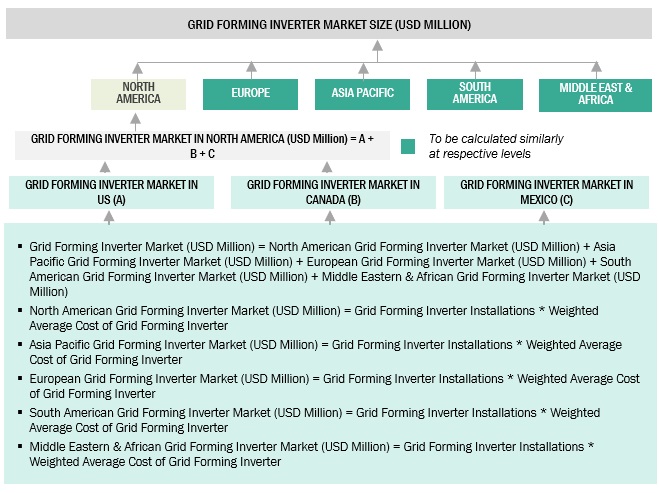
- The bottom-up and top down approach has been used to estimate and validate the size of the grid forming inverter market.
- In this approach, the grid-forming inverter installation statistics for each product type have been considered at a country and regional level.
- Extensive secondary and primary research has been carried out to understand the global market scenario for various types of grid-forming inverters.
- Several primary interviews have been conducted with key opinion leaders related to grid forming inverters development, including key OEMs and Tier I suppliers.
- Qualitative aspects such as market drivers, restraints, opportunities, and challenges have been taken into consideration while calculating and forecasting the market size.
Grid Forming Inverter Market Size: Top-Down and Bottom-Up Approach
To know about the assumptions considered for the study, Request for Free Sample Report
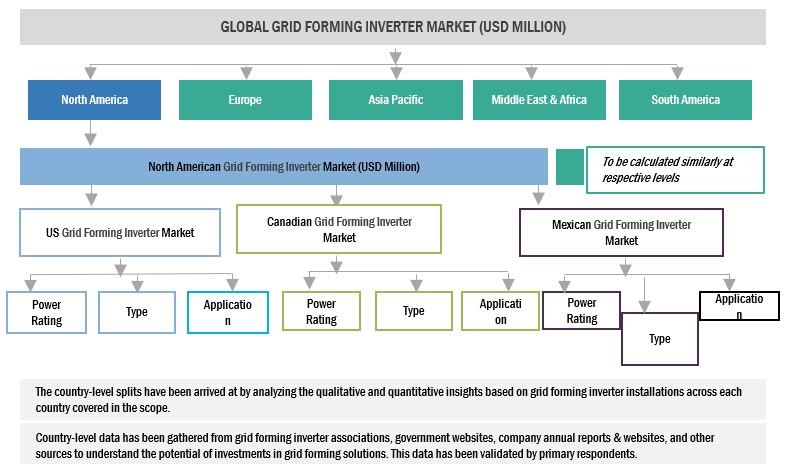
Data Triangulation
The overall market size is estimated using the market size estimation processes as explained above, followed by splitting of the market into several segments and subsegments. To complete the overall market engineering process and arrive at the exact statistics of each market segment and subsegment, data triangulation, and market breakdown procedures were employed, wherever applicable. The data was triangulated by studying various factors and trends from both the demand and supply sides in the grid-forming inverters market ecosystem.
Market Defenition
A grid-forming inverter is a specialized power electronic device that can autonomously create and maintain a stable electrical grid without the need for a pre-existing grid connection. It is designed to control and synchronize voltage and frequency, enabling the integration of renewable energy sources and supporting grid stability in both grid-connected and off-grid operation.
The growth of the grid-forming inverters market during the forecast period can be attributed to the planned grid infrastructure programs across major countries in North America, South America, Europe, Asia Pacific, and the Middle East & Africa.
Key Stakeholders
- Analytics Vendors
- Communication Vendors
- Consulting Companies In The Energy And Power Sector
- DISCOMS
- Electric Utilities
- Energy & Power Sector Consulting Companies
- Energy Regulators
- Government & Research Organizations
- Government Utility Providers
- Independent Power Producers
- Investment Banks
- IT Vendors
- Managed Service Vendors
- Private Utility Providers
- Renewable Energy Generators
- Venture Capital Firms
Objectives of the Study
- To define, describe, and forecast the size of the grid forming inverter market by type, application, voltage, power rating, and region, in terms of value
- To estimate and forecast the global grid forming inverter market for various segments with respect to 5 main regions, namely, North America, Europe, Asia Pacific (APAC), South America, Middle East & Africa, in terms of value
- To provide comprehensive information about the drivers, restraints, opportunities, and industry-specific challenges that affect the market growth
- To provide a detailed overview of the grid forming inverter value chain, along with industry trends, use cases, security standards, and Porter’s five forces
- To strategically analyze micromarkets with respect to individual growth trends, prospects, and contribution to the total market
- To analyze the opportunities in the market for stakeholders by identifying high-growth segments and detail the competitive landscape for market players
- To strategically profile key players and comprehensively analyze their market rankings and core competencies
- To analyze competitive developments, such as joint ventures, mergers and acquisitions, contracts, and agreements, and new product launches, in the grid forming inverter market
- To benchmark players within the market using the proprietary competitive leadership mapping framework, which analyzes market players on various parameters within the broad categories of business strategy excellence and strength of product portfolio
- This report covers the grid forming inverter market size in terms of value.
Available Customizations:
With the given market data, MarketsandMarkets offers customizations according to the specific requirements of companies. The following customization options are available for the report:
Product Analysis
- Product Matrix, which provides a detailed comparison of the product portfolio of each company
Company Information
- Detailed analyses and profiling of additional market players


Growth opportunities and latent adjacency in Grid-forming Inverter Market