Inverter Market by Type (Solar Inverters, Vehicle Inverter), Output Power Rating (Upto 10 kW, 10-50 kW, 51-100 kW, above 100 kW), End User (PV Plants, Residential, Automotive), Connection, Voltage, Sales Channel & Region - Global Forecast to 2028
[293 Pages Report] The Inverter market is expected to grow from an estimated USD 39.6 billion by 2028 from an estimated USD 18.9 billion in 2023, at a CAGR of 16.0% during the forecast period. The demand for renewable sources like solar and wind energy have increased which further drive the demand for inverters. Apart from that, increased infiltration of electric vehicles, technological innovation in inverters, and energy efficiency policies are likely to drive the demand for inverter applications from residential and commercial and industrial segments. The technologies of inverter are crucially important as it controls the flow of energy from the battery to grid or vice-versa. In addition, growing battery storage systems also increase the demand for an inverter.
To know about the assumptions considered for the study, Request for Free Sample Report
To know about the assumptions considered for the study, download the pdf brochure
Inverter Market Dynamics
Driver: Increasing investments in renewable energy sector
The developed and emerging economies, like the US, Japan, India, and China, continuously revise their respective energy policies to ensure that a considerable portion of their energy generation comes from renewable energy sources such as wind and solar. These are government bodies that financially support clean energy and, therefore, associated returns are assured, which has resulted in increasing investments in the global renewable energy sector. In this regard, it is alleged that renewable energy sources have gained exceptional momentum in the last couple of decades as the preferred option to expand, upgrade, and modernize power systems throughout the world. According to the estimate of the International Energy Agency 2022, investment in energy has reached approximately USD 2.8 trillion in 2023. Over USD 1.7 trillion is invested in clean energy, which includes renewable energy, nuclear power, grids, storage, low-emission fuels, efficiency improvements, and end-use renewables and electrification. The remainder, over USD 1 trillion is dedicated to unrestrained fossil fuel supply and power, of which coal accounts for about 15%, and oil and gas for the rest. For every dollar spent on fossil fuel today, 1.7 dollars are spent on clean energy. This was 1:1 five years ago. This huge shift toward clean energy investments, as highlighted from the information provided, is likely to be very favorable for the global inverter market. Inverter manufacturers see an opportunity in growing demand from renewable energy, grid modernization, and energy storage, while focusing on industrial strategy. Policy momentum and economics also champion clean energy and thus the technologies that enable it, like inverters, as increasing hefts of good investment.
According to the International Energy Agency, investments in the energy sector in the year 2023 will be at approximately USD 2.8 trillion, reaching the high rate of USD 2.4 trillion, in excess of USD 1.7 trillion going into renewable power, nuclear, grids, storage, low-emission fuels, efficiency improvement, and end-use renewables and electrification. Within the power sector, investments have seen most recent growth, especially in renewables and grids. Until recently, clean energy investment had been slow to accelerate; it surpassed USD 1.4 trillion in 2022, making up nearly three-quarters of overall energy investment growth. At the country level, China was the leader in investment in clean energy in 2022, with USD 184 billion invested, followed by the European Union at USD 154 billion and the US with USD 97 billion.
Currently, solar and wind are two major renewable sources of energy that have to solve the mismatch between demand and supply. Solar energy, being highly vulnerable to external factors, has its associated problems of inadequate supply of energy removed once solar inverter market are in operation. These allow end users to generate maximum electricity and release it to the grids when required. Inverters overcome the issues of mismatch between supply and demand and intermittent problems associated with renewable energy resources. They exhibit a long life in operation, offer optimal power generation, and provide scalability, flexibility, and safety of power devices. Solar inverters, therefore, have wide applications in renewable solar PV energy applications.
Restraints: Hazards associated with elevated DC voltages
In traditional Photovoltaic systems, PV Inverter Market, wires, and associated equipment are all powered up with high DC voltages. Such a high voltage class presents a risk to installers, maintenance personnel, and even firefighters. Because solar inverters and their associated PV arrays include high DC voltages, isolation of electric DC devices from the arrays is more difficult with DC isolation switches. High voltage results as PV modules are series connected, which is dangerous even for installers who would install the system. High DC voltages are an important factor to the functionality of inverters; however, huge safety hazards arise with the same and therefore act as one of the major growth restraining factors for the market. These involve personnel risks in the form of electric shock and arc flash, equipment damage by way of voltage surges and insulation breakdown, to even regulatory hurdles in terms of strict safety compliances. Consequentially, the cost of inverter development increases, installation and maintenance become costlier, access to markets becomes restricted, and public concerns about the technology dampen consumer adoptions. However, the uninterruptedly pursued work relating to technological development, updating of regulations, and improving safety training stands to provide promising solutions that minimize risks and open ways towards a safer and more robust inverter market share.
During a short-circuit current situation, there is a possibility of electric arcs, which may therefore result in fires and hence endangering people around a Photovoltaic system. These DC arcs are rather difficult to extinguish and pose a danger for the firefighters. The fire that results from this can destroy DC cables in PV arrays, making inverters shut down automatically with the manual isolation of DC cables and other parts. Thus, such factors could restrict the growth of the market.
Opportunity: Growing demand for electric vehicles
In the realm of automotive applications, inverters play a crucial role, particularly in Electric Vehicle (EV) powertrains. These devices are responsible for converting the DC power sourced from a vehicle's batteries into usable AC. Vehicle inverters find application in powering the onboard electronic systems and motors of vehicles. Noteworthy manufacturers and providers of vehicle inverters include Continental (Germany), Delphi Technologies (UK), Toyota Industries (Japan), Sensata Technologies (US), Samlex Europe (Netherlands), and BESTEK (US).
As per the Global EV Outlook 2023 by International Energy Agency’s executive summary,
In 2022, electric vehicles constituted 14% of all new vehicle sales, a notable increase from approximately 9% in 2021 and less than 5% in 2020. The global landscape of electric vehicle sales was dominated by three key markets. China, once again, emerged as the leader, representing nearly 60% of the worldwide electric vehicle sales. China already boasts more than half of all electric vehicles globally, surpassing its 2025 target for new energy vehicle sales. In Europe, the second-largest market, electric car sales surged by over 15% in 2022, suggesting that more than one in every five automobiles sold was electric. The United States, the third-largest market, witnessed a 55% increase in electric car sales in 2022, achieving an 8% sales share.
Developments in automotive technology also mean that the electronic systems in vehicles are increasingly in demand owing to the latest trends of connected, autonomous, and electric vehicles. The global electric vehicle market has seen tremendous growth on account of rising environmental regulations. Growth in this market has directly influenced related markets. The usage preference by consumers regarding electric vehicles will drive up the demand for vehicle inverters. Ambitious targets for electric vehicles mandated by various governments, supported by favorable policies, result in cost reductions, increasing vehicle ranges, and the development of better charging infrastructures-thus increasing demand for electric vehicles across the world. All these trends are foreseen to present good opportunities for the vehicle inverter providers in the near future.
Challenges: Availability of low-quality and cheap products in gray market and pricing pressure on manufactures
The inverter market exhibits significant fragmentation with a multitude of both local and international players. Distinction in product quality serves as a crucial factor for market differentiation. The organized sector primarily caters to industrial buyers, upholding elevated product standards in accordance with various industrial norms. Concurrently, the unorganized sector offers more economical alternatives. Local manufacturers in many countries focus on the unorganized sector, fiercely competing with global suppliers in their respective markets. The prominent market players currently grapple with intense competition from emerging players in the unorganized market, delivering inexpensive and lower-quality products. These gray market entities outperform major players in terms of price competitiveness and local distribution networks, posing a significant challenge for those operating in the inverter market.
The urge to become green power generators rather than depending on grid electricity has increased the demand for Solar PV inverter market systems globally. Since the inverter market prices of solar modules continue to fall, the main cost of installation rests on the inverter. This puts a downward pressure on inverter manufacturers since they are being pushed to advance the prices of their products. This, in turn, has placed pressure on inverter companies to reduce their prices due to the overall declining prices of solar systems in residential, commercial, and utility sectors. In this sense, solar module manufacturers have a higher pressure to reduce the prices of their products compared with solar inverter market share manufacturers. This trend is difficult to which the solar inverter manufacturers can get adapted and cut prices accordingly. These reductions are largely due to the emergences of low-cost equipment, and the squeezing of profit margins-the signs that mark an imminent fall in the prices of inverters within a short time into the future.
Inverter Market Ecosystem
Notable players in this industry comprise long-standing, financially robust manufacturers of Inverter Market and related components. These companies have a significant track record in the market, offering a wide range of products, employing cutting-edge technologies, and maintaining robust global sales and marketing networks. Prominent companies in this market include Huawei Technologies Co., Ltd. (China), SUNGROW (China), SMA Solar Technology AG (Germany), Power Electronics S.L. (Spain), and Fimer Group (Italy).
Solar Inverter, is expected to be the largest market, based on type
The solar inverter segment is the largest market in the inverter business, owing to the increasing usage of solar energy all over the world. Through 2023, the US has installed more than 200 GW of solar capacity to power more than 36 million homes, according to the Solar Energy Industries Association. Solar inverters will continue to play an important role in residential and commercial installations for converting DC, which is photovoltaically generated, into usable AC. The main driving factors for the growth of this market include government subsidies, falling prices of solar panels, and a growing consciousness towards the environment. With the global increase in momentum toward clean energy solutions, the market for solar inverters remains instrumental in supplying the growing demand for efficient integration of solar power.
Automotive, by end user, to hold the second-largest market share during the forecast period
In inverter market, the automotive segment is gaining momentum, much faster, especially when the globe is taking a tremendous shift toward electric vehicles. Inverters form one of the crucial components in electric vehicles to convert DC power from the battery into AC for the electric motor. Pushed by this very fact, higher-power and more efficient inverters will see a surge in demand in the near future, with the automotive world fast accelerating its electric mobility. For instance, according to IEA in 2024, electric car sales in the United States are projected to rise by 20% compared to the previous year, translating to almost half a million more sales, relative to 2023. Such sales figures is expected to also augment the inverter market.
North America is expected to account for the second-largest market during the forecast period.
North American consumers and businesses are driving the inverter market into rapid growth due to sustainability concerns. The technological innovations and regulatory support act as pivotal points in this dynamic evolution and the regionally expanding landscape for clean energy solutions. These key factors make North America the second-fastest-growing market for inverters. The region is also going green, driven by the renewable projects in especially solar and wind energy initiated by the government through very attractive policies and tax incentives. Hence, the United States is the major country in terms of adopting clean energy solutions that comprise inverters at solar installations. Other demands come from increased utilization of smart grid technologies and electrification in industries. Growth in the adoption of EVs increases the demand for inverters in charging infrastructure. This propels the demand for an inverter during charging in infrastructure in growth.
Key Market Players
The Inverter market is dominated by a few major players that have a wide regional presence. The major players in the Inverter market are Huawei Technologies Co., Ltd. (China), SUNGROW (China), SMA Solar Technology AG (Germany), Power Electronics S.L. (Spain), and Fimer Group (Italy). Between 2019 and 2023, Strategies such as product launches, contracts, agreements, partnerships, collaborations, alliances, acquisitions, and expansions are followed by these companies to capture a larger share of the Inverter market.
Want to explore hidden markets that can drive new revenue in Inverter Market?
Scope of the Report
Want to explore hidden markets that can drive new revenue in Inverter Market?
Report Metric |
Details |
Market size available for years |
2020–2028 |
Base year considered |
2023 |
Forecast period |
2024–2028 |
Forecast units |
Value (USD Billion) |
Segments covered |
Output Power Rating, End User, Type, Output Voltage, Connection Type, Sales Channel, and Region |
Geographies covered |
Asia Pacific, North America, Europe, Middle East & Africa, and South America |
Companies covered |
Huawei Technologies Co., Ltd. (China), SUNGROW (China), SMA Solar Technology AG (Germany), Power Electronics S.L. (Spain), Fimer Group (Italy), SolarEdge (Israel), Fronius International GmbH (Austria), Altenergy Power System Inc., (US), Enphase Energy (US), DARFON (China), Schneider Electric (France), General Electric (US) and Delta Electronics, Ltd (Taiwan). |
This research report categorizes the Inverter market by output power rating, end user, type, output voltage, connection type, sales channel, and region
On the basis of output power rating:
- Below 10 kW
- 10–50 kW
- 51–100 kW
- Above 100 kW
On the basis of end user:
- Residential
- Photovoltaic (PV) Plants
- Automotive
- Others
On the basis of by type:
- Solar inverter
- Vehicle inverter
- Others
On the basis of by output voltage:
- 100–300 V
- 301–500 V
- Above 500 V
On the basis of by connection type:
- Standalone
- Grid-tied
On the basis of by sales channel:
- Direct
- Indirect
On the basis of region:
- Asia Pacific
- Europe
- North America
- Middle East & Africa
- South America
Recent Developments
- In November 2023, Enphase Energy has started shipping IQ8P Microinverters, with a peak output AC power of 480 W, to Mexico to support newer high-powered solar modules. The company has also started the commercial production of IQ8 Microinverters in North America, Europe, and Romania.
- In October 2023, During REI 2023, SUNGROW demonstrated its entire portfolio of renewable energy solutions and introduced new goods to India. India's energy revolution is at a crossroads, and SUNGROW's unique products and solutions will help the country enhance its energy structure and boost the use of efficient, safe, and clean energy.
- In July 2023, SUNGROW reached an agreement with Sonnedix, an international manufacturer of renewable energies, providing inverter solutions to 750 MWp PV projects. According to this agreement, SUNGROW will supply string inverters, central inverters, and medium-voltage stations to SONNEDIX. SUNGROW will further support expansion by Sonnedix in Europe with professional services such as personnel training.
- In May 2023, Fimer Group built a new plant near Modena. It installed a new 860.52 kWp photovoltaic plant equipped with FIMER inverters. The plant will produce about 1,100 MWh/year of renewable energy, saving 210 TOE/year in fossil fuel consumption.
Frequently Asked Questions (FAQ):
What is the current size of the Inverter market?
The current market size of global Inverter market is USD 18.9 billion in 2023.
What is the major drivers for Inverter market?
The global Inverter market is driven by i Increasing investments in renewable energy sector.
Which is the fastest-growing region during the forecasted period in Inverter market?
Asia Pacific is a fastest market the Asia Pacific region emerged as a notably expanding market for Inverter market.
Which is the largest segment, by type during the forecasted period in Inverter market?
Solar Inverter dominate the inverter market by type segment due to increasing global adoption of solar energy. With rising environmental awareness, government incentives, and decreasing solar panel costs, demand for solar inverters is expanding rapidly.
Which is the largest segment, by output power rating during the forecasted period in Inverter market?
Output power rating are the most important section of the Inverter market since they are the most crucial components of power networks. Below 10 kw is the largest segment due to its dominance in residential solar installations. The segment caters to the growing demand for small-scale solar power generation in homes. .
To speak to our analyst for a discussion on the above findings, click Speak to Analyst
Exclusive indicates content/data unique to MarketsandMarkets and not available with any competitors.
- 5.1 INTRODUCTION
-
5.2 MARKET DYNAMICSDRIVERS- Increasing investments in renewable energy sector- Rising number of solar installations attributed to government-led initiatives and schemes- Increasing residential solar rooftop installationsRESTRAINTS- Safety risks associated with high DC voltages- Strain on batteries due to prolonged use of invertersOPPORTUNITIES- Growing demand for electric vehicles- Increasing investments in development of smart grids- Demand for high-power density invertersCHALLENGES- Availability of cost-effective products in gray market leading to pricing pressure on manufacturers
- 5.3 TRENDS/DISRUPTIONS IMPACTING CUSTOMERS’ BUSINESSES
- 5.4 ECOSYSTEM MAPPING
-
5.5 VALUE CHAIN ANALYSISRAW MATERIAL PROVIDERS/COMPONENT MANUFACTURERS/SUPPLIERSINVERTER MANUFACTURERS/ASSEMBLERSDISTRIBUTORS/RESELLERSEND USERSMAINTENANCE/SERVICE PROVIDERS
-
5.6 TECHNOLOGY ANALYSISZ-SOURCE INVERTERSSOLAR MICRO INVERTERSSMART INVERTERS
- 5.7 PATENT ANALYSIS
-
5.8 TRADE ANALYSISIMPORT SCENARIOEXPORT SCENARIO
- 5.9 PRICING ANALYSIS
-
5.10 TARIFFS, STANDARDS, AND REGULATORY LANDSCAPEREGULATORY BODIES, GOVERNMENT AGENCIES, AND OTHER ORGANIZATIONSSTANDARDSTARIFFS
-
5.11 PORTER’S FIVE FORCES ANALYSISTHREAT OF SUBSTITUTESBARGAINING POWER OF SUPPLIERSBARGAINING POWER OF BUYERSTHREAT OF NEW ENTRANTSINTENSITY OF COMPETITIVE RIVALRY
-
5.12 CASE STUDY ANALYSISSOLAR POWER PLANT IN BARGAS, SPAIN, TO DEPLOY TURNKEY SOLUTION BY SUNGROWMAN TRUCKS & BUSES, SOUTH AFRICA, TO GO GREEN WITH GOODWE INVERTERSFIVE MID-LARGE SCALE SOLAR FARM PROJECTS IN REGIONAL SOUTH AUSTRALIA TO USE INVERTER BY FIMER
-
5.13 KEY STAKEHOLDERS AND BUYING CRITERIAKEY STAKEHOLDERS IN BUYING PROCESSBUYING CRITERIA
- 5.14 KEY CONFERENCES AND EVENTS, 2024
- 6.1 INTRODUCTION
-
6.2 BELOW 10 KWRISING DEMAND FROM RESIDENTIAL SECTOR TO CONTRIBUTE TO MARKET GROWTH
-
6.3 10–50 KWINCREASING DEPLOYMENT IN EXPANDING COMMERCIAL SECTOR TO FUEL DEMAND
-
6.4 51–100 KWGROWING DEMAND FROM PV PLANTS AND VARIOUS INDUSTRIES TO BOOST MARKET GROWTH
-
6.5 ABOVE 100 KWRISING NUMBER OF PV PLANTS AND EXPANDING AUTOMOTIVE INDUSTRY TO DRIVE MARKET
- 7.1 INTRODUCTION
-
7.2 RESIDENTIALRISING GOVERNMENT INITIATIVES TO INCREASE RENEWABLE ENERGY ACCESS FOR HOUSEHOLDS TO DRIVE MARKET
-
7.3 AUTOMOTIVEGROWING ADOPTION OF ELECTRIC VEHICLES TO FUEL DEMAND
-
7.4 PHOTOVOLTAIC (PV) PLANTSINCREASING IMPLEMENTATION OF RENEWABLE ENERGY POLICIES IN SEVERAL COUNTRIES TO FOSTER MARKET GROWTH
- 7.5 OTHERS
- 8.1 INTRODUCTION
-
8.2 SOLAR INVERTERCENTRAL INVERTER- Rising demand from PV plants to drive marketSTRING INVERTER- Rising installation of solar panels in residential and commercial sectors to boost market growthMICRO INVERTER- Increasing demand for micro inverters in residential sector to fuel market growthHYBRID INVERTER- Multiple benefits of hybrid inverters to drive market
-
8.3 VEHICLE INVERTERBATTERY ELECTRIC VEHICLE (BEV)- Favorable government initiatives related to EVs to propel marketHYBRID ELECTRIC VEHICLE (HEV)- Increased demand for fuel-efficient vehicles and implementation of stringent emission norms to fuel market growthPLUG-IN HYBRID ELECTRIC VEHICLE (PHEV)- Rising demand for EVs to boost market growth
- 8.4 OTHERS
- 9.1 INTRODUCTION
-
9.2 100–300 VRISING ELECTRICITY DEMAND DUE TO URBANIZATION TO DRIVE MARKET
-
9.3 301–500 VGROWING REQUIREMENT FOR UNINTERRUPTED POWER SUPPLY FROM COMMERCIAL AND INDUSTRIAL SECTORS TO FUEL MARKET GROWTH
-
9.4 ABOVE 500 VINCREASING INVESTMENTS IN POWER INFRASTRUCTURE DEVELOPMENT TO CONTRIBUTE TO MARKET GROWTH
- 10.1 INTRODUCTION
-
10.2 STANDALONERISING ELECTRICITY CONSUMPTION AND DEPENDENCE ON ELECTRONIC DEVICES TO BOOST MARKET
-
10.3 GRID-TIEDCONVENTIONAL INVERTER- Increasing installation of solar PV systems in residential and commercial sectors to propel marketSMART INVERTER- Technological advancements in grid-tied inverters to drive market
- 11.1 INTRODUCTION
-
11.2 DIRECTRISING PREFERENCE FOR DIRECT PROCUREMENT OF VEHICLE INVERTERS AMONG AUTOMOBILE MANUFACTURERS TO DRIVE MARKET
-
11.3 INDIRECTINCREASING ADOPTION OF INVERTERS IN RESIDENTIAL SECTOR AND PV PLANTS TO CONTRIBUTE TO MARKET GROWTH
- 12.1 INTRODUCTION
-
12.2 NORTH AMERICAIMPACT OF RECESSION ON INVERTER MARKET IN NORTH AMERICA- US- Canada- Mexico
-
12.3 MIDDLE EAST & AFRICAIMPACT OF RECESSION ON INVERTER MARKET IN MIDDLE EAST & AFRICAGCC COUNTRIES- Saudi Arabia- UAESOUTH AFRICA- Expanding automotive industry and establishment of PV plants to contribute to market growthREST OF MIDDLE EAST & AFRICA
-
12.4 SOUTH AMERICAIMPACT OF RECESSION ON INVERTER MARKET IN SOUTH AMERICA- Brazil- Argentina- Rest of South America
-
12.5 ASIA PACIFICIMPACT OF RECESSION ON INVERTER MARKET IN ASIA PACIFIC- China- India- Australia- Japan- Rest of Asia Pacific
-
12.6 EUROPEIMPACT OF RECESSION ON INVERTER MARKET IN EUROPE- Germany- UK- ITALY- France- Spain- Rest of Europe
- 13.1 OVERVIEW
- 13.2 STRATEGIES ADOPTED BY KEY PLAYERS, 2018–2023
- 13.3 MARKET SHARE ANALYSIS, 2022
- 13.4 REVENUE ANALYSIS OF KEY PLAYERS, 2018–2022
-
13.5 COMPANY EVALUATION MATRIX, 2022STARSEMERGING LEADERSPERVASIVE PLAYERSPARTICIPANTSCOMPANY FOOTPRINT
-
13.6 START-UP/SMALL AND MEDIUM-SIZED ENTERPRISE (SME) EVALUATION MATRIX, 2022PROGRESSIVE COMPANIESRESPONSIVE COMPANIESDYNAMIC COMPANIESSTARTING BLOCKSCOMPETITIVE BENCHMARKING
-
13.7 COMPETITIVE SCENARIOS AND TRENDSDEALSOTHERS
-
14.1 KEY PLAYERSHUAWEI TECHNOLOGIES CO., LTD.- Business overview- Products/Solutions/Services offered- Recent developments- MnM viewSUNGROW- Business overview- Products/Solutions/Services offered- Recent developments- MnM viewSMA SOLAR TECHNOLOGY AG- Business overview- Products/Solutions/Services offered- Recent developments- MnM viewPOWER ELECTRONICS S.L.- Business overview- Products/Solutions/Services offered- Recent developments- MnM viewFIMER GROUP- Business overview- Products/Solutions/Services offered- Recent developments- MnM viewSOLAREDGE- Business overview- Products/Solutions/Services offered- Recent developmentsFRONIUS INTERNATIONAL GMBH- Business overview- Products/Solutions/Services offered- Recent developmentsALTENERGY POWER SYSTEM INC.- Business overview- Products/Solutions/Services offered- Recent developmentsENPHASE ENERGY- Business overview- Products/Solutions/Services offered- Recent developmentsDARFON- Business overview- Products/Solutions/Services offered- Recent developmentsSCHNEIDER ELECTRIC- Business overview- Products/Solutions/Services offered- Recent developmentsGENERAL ELECTRIC- Business overview- Products/Solutions/Services offered- Recent developmentsDELTA ELECTRONICS, INC.- Business overview- Products/Solutions/Services offered- Recent developmentsEXIDE INDUSTRIES LTD.- Business overview- Products/Solutions/Services offered- Recent developments
-
14.2 OTHER PLAYERSCONTINENTAL ENGINEERING SERVICESDELPHI TECHNOLOGIESSENSATA TECHNOLOGIESSAMLEX EUROPE BVBESTEKGOODWETMEIC (TOSHIBA MITSUBISHI-ELECTRIC INDUSTRIAL SYSTEMS CORPORATION)YASKAWA-SOLECTRIA SOLARKACO NEW ENERGYGROWATT NEW ENERGYTBEA
- 15.1 INSIGHTS FROM INDUSTRY EXPERTS
- 15.2 DISCUSSION GUIDE
- 15.3 KNOWLEDGESTORE: MARKETSANDMARKETS’ SUBSCRIPTION PORTAL
- 15.4 CUSTOMIZATION OPTIONS
- 15.5 RELATED REPORTS
- 15.6 AUTHOR DETAILS
- TABLE 1 INVERTER MARKET SNAPSHOT
- TABLE 2 ROLE OF PLAYERS IN INVERTER ECOSYSTEM
- TABLE 3 MARKET: INNOVATIONS AND PATENT REGISTRATIONS, 2019–2023
- TABLE 4 IMPORT DATA FOR HS CODE 850440-COMPLIANT PRODUCTS, BY COUNTRY, 2020–2022 (USD THOUSAND)
- TABLE 5 EXPORT DATA FOR HS CODE 850440-COMPLIANT PRODUCTS, BY COUNTRY, 2020–2022 (USD THOUSAND)
- TABLE 6 AVERAGE SELLING PRICE (ASP) TREND OF INVERTERS, BY TYPE, 2021–2023 (USD/UNIT)
- TABLE 7 AVERAGE SELLING PRICE (ASP) TREND OF INVERTERS, BY REGION, 2021–2023 (USD/UNIT)
- TABLE 8 NORTH AMERICA: LIST OF REGULATORY BODIES, GOVERNMENT AGENCIES, AND OTHER ORGANIZATIONS
- TABLE 9 EUROPE: LIST OF REGULATORY BODIES, GOVERNMENT AGENCIES, AND OTHER ORGANIZATIONS
- TABLE 10 ASIA PACIFIC: LIST OF REGULATORY BODIES, GOVERNMENT AGENCIES, AND OTHER ORGANIZATIONS
- TABLE 11 ROW: LIST OF REGULATORY BODIES, GOVERNMENT AGENCIES, AND OTHER ORGANIZATIONS
- TABLE 12 GLOBAL: LIST OF REGULATORY BODIES, GOVERNMENT AGENCIES, AND OTHER ORGANIZATIONS
- TABLE 13 GLOBAL: STANDARDS
- TABLE 14 IMPORT TARIFF FOR HS CODE 850440-COMPLIANT PRODUCTS, 2022
- TABLE 15 MARKET: PORTER’S FIVE FORCES ANALYSIS
- TABLE 16 INFLUENCE OF KEY STAKEHOLDERS ON BUYING PROCESS FOR TOP THREE END USERS
- TABLE 17 KEY BUYING CRITERIA FOR TOP THREE END USERS
- TABLE 18 MARKET: LIST OF KEY CONFERENCES AND EVENTS, 2024
- TABLE 19 MARKET, BY OUTPUT POWER RATING, 2020–2022 (USD MILLION)
- TABLE 20 MARKET, BY OUTPUT POWER RATING, 2023–2028 (USD MILLION)
- TABLE 21 BELOW 10 KW: MARKET, BY REGION, 2020–2022 (USD MILLION)
- TABLE 22 BELOW 10 KW: MARKET, BY REGION, 2023–2028 (USD MILLION)
- TABLE 23 10–50 KW: MARKET, BY REGION, 2020–2022 (USD MILLION)
- TABLE 24 10–50 KW: MARKET, BY REGION, 2023–2028 (USD MILLION)
- TABLE 25 51–100 KW: MARKET, BY REGION, 2020–2022 (USD MILLION)
- TABLE 26 51–100 KW: MARKET, BY REGION, 2023–2028 (USD MILLION)
- TABLE 27 ABOVE 100 KW: MARKET, BY REGION, 2020–2022 (USD MILLION)
- TABLE 28 ABOVE 100 KW: MARKET, BY REGION, 2023–2028 (USD MILLION)
- TABLE 29 MARKET, BY END USER, 2020–2022 (USD MILLION)
- TABLE 30 MARKET, BY END USER, 2023–2028 (USD MILLION)
- TABLE 31 RESIDENTIAL: MARKET, BY REGION, 2020–2022 (USD MILLION)
- TABLE 32 RESIDENTIAL: MARKET, BY REGION, 2023–2028 (USD MILLION)
- TABLE 33 AUTOMOTIVE: MARKET, BY REGION, 2020–2022 (USD MILLION)
- TABLE 34 AUTOMOTIVE: MARKET, BY REGION, 2023–2028 (USD MILLION)
- TABLE 35 PHOTOVOLTAIC (PV) PLANTS: MARKET, BY REGION, 2020–2022 (USD MILLION)
- TABLE 36 PHOTOVOLTAIC (PV) PLANTS: MARKET, BY REGION, 2023–2028 (USD MILLION)
- TABLE 37 OTHERS: MARKET, BY REGION, 2020–2022 (USD MILLION)
- TABLE 38 OTHERS: MARKET, BY REGION, 2023–2028 (USD MILLION)
- TABLE 39 MARKET, BY TYPE, 2020–2022 (USD MILLION)
- TABLE 40 MARKET, BY TYPE, 2023–2028 (USD MILLION)
- TABLE 41 MARKET, BY TYPE, 2020–2022 (THOUSAND UNITS)
- TABLE 42 MARKET, BY TYPE, 2023–2028 (THOUSAND UNITS)
- TABLE 43 SOLAR INVERTER: MARKET, BY REGION, 2020–2022 (USD MILLION)
- TABLE 44 SOLAR INVERTER: MARKET, BY REGION, 2023–2028 (USD MILLION)
- TABLE 45 SOLAR INVERTER: MARKET, BY SUB-TYPE, 2020–2022 (USD MILLION)
- TABLE 46 SOLAR INVERTER: MARKET, BY SUB-TYPE, 2023–2028 (USD MILLION)
- TABLE 47 CENTRAL INVERTER: MARKET, BY REGION, 2020–2022 (USD MILLION)
- TABLE 48 CENTRAL INVERTER: MARKET, BY REGION, 2023–2028 (USD MILLION)
- TABLE 49 STRING INVERTER: MARKET, BY REGION, 2020–2022 (USD MILLION)
- TABLE 50 STRING INVERTER: MARKET, BY REGION, 2023–2028 (USD MILLION)
- TABLE 51 MICRO INVERTER: MARKET, BY REGION, 2020–2022 (USD MILLION)
- TABLE 52 MICRO INVERTER: MARKET, BY REGION, 2023–2028 (USD MILLION)
- TABLE 53 HYBRID INVERTER: MARKET, BY REGION, 2020–2022 (USD MILLION)
- TABLE 54 HYBRID INVERTER: MARKET, BY REGION, 2023–2028 (USD MILLION)
- TABLE 55 VEHICLE INVERTER: MARKET, BY REGION, 2020–2022 (USD MILLION)
- TABLE 56 VEHICLE INVERTER: MARKET, BY REGION, 2023–2028 (USD MILLION)
- TABLE 57 VEHICLE INVERTER: MARKET, BY SUB-TYPE, 2020–2022 (USD MILLION)
- TABLE 58 VEHICLE INVERTER: MARKET, BY SUB-TYPE, 2023–2028 (USD MILLION)
- TABLE 59 BATTERY ELECTRIC VEHICLE (BEV): MARKET, BY REGION, 2020–2022 (USD MILLION)
- TABLE 60 BATTERY ELECTRIC VEHICLE (BEV): MARKET, BY REGION, 2023–2028 (USD MILLION)
- TABLE 61 HYBRID ELECTRIC VEHICLE (HEV): MARKET, BY REGION, 2020–2022 (USD MILLION)
- TABLE 62 HYBRID ELECTRIC VEHICLE (BEV): MARKET, BY REGION, 2023–2028 (USD MILLION)
- TABLE 63 PLUG-IN HYBRID ELECTRIC VEHICLE (PHEV): MARKET, BY REGION, 2020–2022 (USD MILLION)
- TABLE 64 PLUG-IN HYBRID ELECTRIC VEHICLE (PHEV): MARKET, BY REGION, 2023–2028 (USD MILLION)
- TABLE 65 OTHERS: MARKET, BY REGION, 2020–2022 (USD MILLION)
- TABLE 66 OTHERS: MARKET, BY REGION, 2023–2028 (USD MILLION)
- TABLE 67 MARKET, BY OUTPUT VOLTAGE, 2020–2022 (USD MILLION)
- TABLE 68 MARKET, BY OUTPUT VOLTAGE, 2023–2028 (USD MILLION)
- TABLE 69 100–300 V: MARKET, BY REGION, 2020–2022 (USD MILLION)
- TABLE 70 100–300 V: MARKET, BY REGION, 2023–2028 (USD MILLION)
- TABLE 71 301–500 V: MARKET, BY REGION, 2020–2022 (USD MILLION)
- TABLE 72 301–500 V: MARKET, BY REGION, 2023–2028 (USD MILLION)
- TABLE 73 500 V: MARKET, BY REGION, 2020–2022 (USD MILLION)
- TABLE 74 500 V: MARKET, BY REGION, 2023–2028 (USD MILLION)
- TABLE 75 MARKET, BY CONNECTION TYPE, 2020–2022 (USD MILLION)
- TABLE 76 MARKET, BY CONNECTION TYPE, 2023–2028 (USD MILLION)
- TABLE 77 STANDALONE: MARKET, BY REGION, 2020–2022 (USD MILLION)
- TABLE 78 STANDALONE: MARKET, BY REGION, 2023–2028 (USD MILLION)
- TABLE 79 GRID-TIED: MARKET, BY SUB-TYPE, 2020–2022 (USD MILLION)
- TABLE 80 GRID-TIED: MARKET, BY SUB-TYPE, 2023–2028 (USD MILLION)
- TABLE 81 CONVENTIONAL INVERTER: MARKET, BY REGION, 2020–2022 (USD MILLION)
- TABLE 82 CONVENTIONAL INVERTER: MARKET, BY REGION, 2023–2028 (USD MILLION)
- TABLE 83 SMART INVERTER: MARKET, BY REGION, 2020–2022 (USD MILLION)
- TABLE 84 SMART INVERTER: MARKET, BY REGION, 2023–2028 (USD MILLION)
- TABLE 85 MARKET, BY SALES CHANNEL, 2020–2022 (USD MILLION)
- TABLE 86 MARKET, BY SALES CHANNEL, 2023–2028 (USD MILLION)
- TABLE 87 DIRECT: MARKET, BY REGION, 2020–2022 (USD MILLION)
- TABLE 88 DIRECT: MARKET, BY REGION, 2023–2028 (USD MILLION)
- TABLE 89 INDIRECT: MARKET, BY REGION, 2020–2022 (USD MILLION)
- TABLE 90 INDIRECT: MARKET, BY REGION, 2023–2028 (USD MILLION)
- TABLE 91 MARKET, BY REGION, 2020–2022 (USD MILLION)
- TABLE 92 MARKET, BY REGION, 2023–2028 (USD MILLION)
- TABLE 93 MARKET, BY REGION, 2020–2022 (THOUSAND UNITS)
- TABLE 94 MARKET, BY REGION, 2023–2028 (THOUSAND UNITS)
- TABLE 95 MARKET, BY OUTPUT POWER RATING, 2020–2022 (USD MILLION)
- TABLE 96 MARKET, BY OUTPUT POWER RATING, 2023–2028 (USD MILLION)
- TABLE 97 MARKET, BY OUTPUT VOLTAGE, 2020–2022 (USD MILLION)
- TABLE 98 MARKET, BY OUTPUT VOLTAGE, 2023–2028 (USD MILLION)
- TABLE 99 MARKET, BY END USER, 2020–2022 (USD MILLION)
- TABLE 100 MARKET, BY END USER, 2023–2028 (USD MILLION)
- TABLE 101 MARKET, BY TYPE, 2020–2022 (USD MILLION)
- TABLE 102 MARKET, BY TYPE, 2023–2028 (USD MILLION)
- TABLE 103 MARKET, BY TYPE, 2020–2022 (THOUSAND UNITS)
- TABLE 104 MARKET, BY TYPE, 2023–2028 (THOUSAND UNITS)
- TABLE 105 MARKET, BY CONNECTION TYPE, 2020–2022 (USD MILLION)
- TABLE 106 MARKET, BY CONNECTION TYPE, 2023–2028 (USD MILLION)
- TABLE 107 MARKET, BY SALES CHANNEL, 2020–2022 (USD MILLION)
- TABLE 108 MARKET, BY SALES CHANNEL, 2023–2028 (USD MILLION)
- TABLE 109 NORTH AMERICA: MARKET, BY OUTPUT POWER RATING, 2020–2022 (USD MILLION)
- TABLE 110 NORTH AMERICA: MARKET, BY OUTPUT POWER RATING, 2023–2028 (USD MILLION)
- TABLE 111 NORTH AMERICA: MARKET, BY OUTPUT VOLTAGE, 2020–2022 (USD MILLION)
- TABLE 112 NORTH AMERICA: MARKET, BY OUTPUT VOLTAGE, 2023–2028 (USD MILLION)
- TABLE 113 NORTH AMERICA: MARKET, BY END USER, 2020–2022 (USD MILLION)
- TABLE 114 NORTH AMERICA: MARKET, BY END USER, 2023–2028 (USD MILLION)
- TABLE 115 NORTH AMERICA: MARKET, BY TYPE, 2020–2022 (USD MILLION)
- TABLE 116 NORTH AMERICA: MARKET, BY TYPE, 2023–2028 (USD MILLION)
- TABLE 117 NORTH AMERICA: MARKET, BY TYPE, 2020–2022 (THOUSAND UNITS)
- TABLE 118 NORTH AMERICA: MARKET, BY TYPE, 2023–2028 (THOUSAND UNITS)
- TABLE 119 NORTH AMERICA: MARKET, BY CONNECTION TYPE, 2020–2022 (USD MILLION)
- TABLE 120 NORTH AMERICA: MARKET, BY CONNECTION TYPE, 2023–2028 (USD MILLION)
- TABLE 121 NORTH AMERICA: MARKET, BY SALES CHANNEL, 2020–2022 (USD MILLION)
- TABLE 122 NORTH AMERICA: MARKET, BY SALES CHANNEL, 2023–2028 (USD MILLION)
- TABLE 123 NORTH AMERICA: MARKET, BY COUNTRY, 2020–2022 (USD MILLION)
- TABLE 124 NORTH AMERICA: MARKET, BY COUNTRY, 2023–2028 (USD MILLION)
- TABLE 125 US: MARKET, BY END USER, 2020–2022 (USD MILLION)
- TABLE 126 US: MARKET, BY END USER, 2023–2028 (USD MILLION)
- TABLE 127 CANADA: MARKET, BY END USER, 2020–2022 (USD MILLION)
- TABLE 128 CANADA: MARKET, BY END USER, 2023–2028 (USD MILLION)
- TABLE 129 MEXICO: MARKET, BY END USER, 2020–2022 (USD MILLION)
- TABLE 130 MEXICO: MARKET, BY END USER, 2023–2028 (USD MILLION)
- TABLE 131 MIDDLE EAST & AFRICA: MARKET, BY OUTPUT POWER RATING, 2020–2022 (USD MILLION)
- TABLE 132 MIDDLE EAST & AFRICA: MARKET, BY OUTPUT POWER RATING, 2023–2028 (USD MILLION)
- TABLE 133 MIDDLE EAST & AFRICA: MARKET, BY OUTPUT VOLTAGE, 2020–2022 (USD MILLION)
- TABLE 134 MIDDLE EAST & AFRICA: MARKET, BY OUTPUT VOLTAGE, 2023–2028 (USD MILLION)
- TABLE 135 MIDDLE EAST & AFRICA: MARKET, BY END USER, 2020–2022 (USD MILLION)
- TABLE 136 MIDDLE EAST & AFRICA: MARKET, BY END USER, 2023–2028 (USD MILLION)
- TABLE 137 MIDDLE EAST & AFRICA: MARKET, BY TYPE, 2020–2022 (USD MILLION)
- TABLE 138 MIDDLE EAST & AFRICA: MARKET, BY TYPE, 2023–2028 (USD MILLION)
- TABLE 139 MIDDLE EAST & AFRICA: MARKET, BY TYPE, 2020–2022 (THOUSAND UNITS)
- TABLE 140 MIDDLE EAST & AFRICA: MARKET, BY TYPE, 2023–2028 (THOUSAND UNITS)
- TABLE 141 MIDDLE EAST & AFRICA: MARKET, BY CONNECTION TYPE, 2020–2022 (USD MILLION)
- TABLE 142 MIDDLE EAST & AFRICA: MARKET, BY CONNECTION TYPE, 2023–2028 (USD MILLION)
- TABLE 143 MIDDLE EAST & AFRICA: MARKET, BY SALES CHANNEL, 2020–2022 (USD MILLION)
- TABLE 144 MIDDLE EAST & AFRICA: MARKET, BY SALES CHANNEL, 2023–2028 (USD MILLION)
- TABLE 145 MIDDLE EAST & AFRICA: MARKET, BY COUNTRY, 2020–2022 (USD MILLION)
- TABLE 146 MIDDLE EAST & AFRICA: MARKET, BY COUNTRY, 2023–2028 (USD MILLION)
- TABLE 147 SAUDI ARABIA: MARKET, BY END USER, 2020–2022 (USD MILLION)
- TABLE 148 SAUDI ARABIA: MARKET, BY END USER, 2023–2028 (USD MILLION)
- TABLE 149 UAE: MARKET, BY END USER, 2020–2022 (USD MILLION)
- TABLE 150 UAE: MARKET, BY END USER, 2023–2028 (USD MILLION)
- TABLE 151 SOUTH AFRICA: MARKET, BY END USER, 2020–2022 (USD MILLION)
- TABLE 152 SOUTH AFRICA: MARKET, BY END USER, 2023–2028 (USD MILLION)
- TABLE 153 REST OF MIDDLE EAST & AFRICA: MARKET, BY END USER, 2020–2022 (USD MILLION)
- TABLE 154 REST OF MIDDLE EAST & AFRICA: MARKET, BY END USER, 2023–2028 (USD MILLION)
- TABLE 155 SOUTH AMERICA: MARKET, BY OUTPUT POWER RATING, 2020–2022 (USD MILLION)
- TABLE 156 SOUTH AMERICA: MARKET, BY OUTPUT POWER RATING, 2023–2028 (USD MILLION)
- TABLE 157 SOUTH AMERICA: MARKET, BY OUTPUT VOLTAGE, 2020–2022 (USD MILLION)
- TABLE 158 SOUTH AMERICA: MARKET, BY OUTPUT VOLTAGE, 2023–2028 (USD MILLION)
- TABLE 159 SOUTH AMERICA: MARKET, BY END USER, 2020–2022 (USD MILLION)
- TABLE 160 SOUTH AMERICA: MARKET, BY END USER, 2023–2028 (USD MILLION)
- TABLE 161 SOUTH AMERICA: MARKET, BY TYPE, 2020–2022 (USD MILLION)
- TABLE 162 SOUTH AMERICA: MARKET, BY TYPE, 2023–2028 (USD MILLION)
- TABLE 163 SOUTH AMERICA: MARKET, BY TYPE, 2020–2022 (THOUSAND UNITS)
- TABLE 164 SOUTH AMERICA: MARKET, BY TYPE, 2023–2028 (THOUSAND UNITS)
- TABLE 165 SOUTH AMERICA: MARKET, BY CONNECTION TYPE, 2020–2022 (USD MILLION)
- TABLE 166 SOUTH AMERICA: MARKET, BY CONNECTION TYPE, 2023–2028 (USD MILLION)
- TABLE 167 SOUTH AMERICA: MARKET, BY SALES CHANNEL, 2020–2022 (USD MILLION)
- TABLE 168 SOUTH AMERICA: MARKET, BY SALES CHANNEL, 2023–2028 (USD MILLION)
- TABLE 169 SOUTH AMERICA: MARKET, BY COUNTRY, 2020–2022 (USD MILLION)
- TABLE 170 SOUTH AMERICA: MARKET, BY COUNTRY, 2023–2028 (USD MILLION)
- TABLE 171 BRAZIL: MARKET, BY END USER, 2020–2022 (USD MILLION)
- TABLE 172 BRAZIL: MARKET, BY END USER, 2023–2028 (USD MILLION)
- TABLE 173 ARGENTINA: MARKET, BY END USER, 2020–2022 (USD MILLION)
- TABLE 174 ARGENTINA: MARKET, BY END USER, 2023–2028 (USD MILLION)
- TABLE 175 REST OF SOUTH AMERICA: MARKET, BY END USER, 2020–2022 (USD MILLION)
- TABLE 176 REST OF SOUTH AMERICA: MARKET, BY END USER, 2023–2028 (USD MILLION)
- TABLE 177 ASIA PACIFIC: MARKET, BY OUTPUT POWER RATING, 2020–2022 (USD MILLION)
- TABLE 178 ASIA PACIFIC: MARKET, BY OUTPUT POWER RATING, 2023–2028 (USD MILLION)
- TABLE 179 ASIA PACIFIC: MARKET, BY OUTPUT VOLTAGE, 2020–2022 (USD MILLION)
- TABLE 180 ASIA PACIFIC: MARKET, BY OUTPUT VOLTAGE, 2023–2028 (USD MILLION)
- TABLE 181 ASIA PACIFIC: MARKET, BY END USER, 2020–2022 (USD MILLION)
- TABLE 182 ASIA PACIFIC: MARKET, BY END USER, 2023–2028 (USD MILLION)
- TABLE 183 ASIA PACIFIC: MARKET, BY TYPE, 2020–2022 (USD MILLION)
- TABLE 184 ASIA PACIFIC: MARKET, BY TYPE, 2023–2028 (USD MILLION)
- TABLE 185 ASIA PACIFIC: MARKET, BY TYPE, 2020–2022 (THOUSAND UNITS)
- TABLE 186 ASIA PACIFIC: MARKET, BY TYPE, 2023–2028 (THOUSAND UNITS)
- TABLE 187 ASIA PACIFIC: MARKET, BY CONNECTION TYPE, 2020–2022 (USD MILLION)
- TABLE 188 ASIA PACIFIC: MARKET, BY CONNECTION TYPE, 2023–2028 (USD MILLION)
- TABLE 189 ASIA PACIFIC: MARKET, BY SALES CHANNEL, 2020–2022 (USD MILLION)
- TABLE 190 ASIA PACIFIC: MARKET, BY SALES CHANNEL, 2023–2028 (USD MILLION)
- TABLE 191 ASIA PACIFIC: MARKET, BY COUNTRY, 2020–2022 (USD MILLION)
- TABLE 192 ASIA PACIFIC: MARKET, BY COUNTRY, 2023–2028 (USD MILLION)
- TABLE 193 CHINA: MARKET, BY END USER, 2020–2022 (USD MILLION)
- TABLE 194 CHINA: MARKET, BY END USER, 2023–2028 (USD MILLION)
- TABLE 195 INDIA: MARKET, BY END USER, 2020–2022 (USD MILLION)
- TABLE 196 INDIA: MARKET, BY END USER, 2023–2028 (USD MILLION)
- TABLE 197 AUSTRALIA: MARKET, BY END USER, 2020–2022 (USD MILLION)
- TABLE 198 AUSTRALIA: MARKET, BY END USER, 2023–2028 (USD MILLION)
- TABLE 199 JAPAN: MARKET, BY END USER, 2020–2022 (USD MILLION)
- TABLE 200 JAPAN: MARKET, BY END USER, 2023–2028 (USD MILLION)
- TABLE 201 REST OF ASIA PACIFIC: MARKET, BY END USER, 2020–2022 (USD MILLION)
- TABLE 202 REST OF ASIA PACIFIC: MARKET, BY END USER, 2023–2028 (USD MILLION)
- TABLE 203 EUROPE: MARKET, BY OUTPUT POWER RATING, 2020–2022 (USD MILLION)
- TABLE 204 EUROPE: MARKET, BY OUTPUT POWER RATING, 2023–2028 (USD MILLION)
- TABLE 205 EUROPE: MARKET, BY OUTPUT VOLTAGE, 2020–2022 (USD MILLION)
- TABLE 206 EUROPE: MARKET, BY OUTPUT VOLTAGE, 2023–2028 (USD MILLION)
- TABLE 207 EUROPE: MARKET, BY END USER, 2020–2022 (USD MILLION)
- TABLE 208 EUROPE: MARKET, BY END USER, 2023–2028 (USD MILLION)
- TABLE 209 EUROPE: MARKET, BY TYPE, 2020–2022 (USD MILLION)
- TABLE 210 EUROPE: MARKET, BY TYPE, 2023–2028 (USD MILLION)
- TABLE 211 EUROPE: MARKET, BY TYPE, 2020–2022 (THOUSAND UNITS)
- TABLE 212 EUROPE: MARKET, BY TYPE, 2023–2028 (THOUSAND UNITS)
- TABLE 213 EUROPE: MARKET, BY CONNECTION TYPE, 2020–2022 (USD MILLION)
- TABLE 214 EUROPE: MARKET, BY CONNECTION TYPE, 2023–2028 (USD MILLION)
- TABLE 215 EUROPE: MARKET, BY SALES CHANNEL, 2020–2022 (USD MILLION)
- TABLE 216 EUROPE: MARKET, BY SALES CHANNEL, 2023–2028 (USD MILLION)
- TABLE 217 EUROPE: MARKET, BY COUNTRY, 2020–2022 (USD MILLION)
- TABLE 218 EUROPE: MARKET, BY COUNTRY, 2023–2028 (USD MILLION)
- TABLE 219 GERMANY: MARKET, BY END USER, 2020–2022 (USD MILLION)
- TABLE 220 GERMANY: MARKET, BY END USER, 2023–2028 (USD MILLION)
- TABLE 221 UK: MARKET, BY END USER, 2020–2022 (USD MILLION)
- TABLE 222 UK: MARKET, BY END USER, 2023–2028 (USD MILLION)
- TABLE 223 ITALY: MARKET, BY END USER, 2020–2022 (USD MILLION)
- TABLE 224 ITALY: MARKET, BY END USER, 2023–2028 (USD MILLION)
- TABLE 225 FRANCE: MARKET, BY END USER, 2020–2022 (USD MILLION)
- TABLE 226 FRANCE: MARKET, BY END USER, 2023–2028 (USD MILLION)
- TABLE 227 SPAIN: MARKET, BY END USER, 2020–2022 (USD MILLION)
- TABLE 228 SPAIN: MARKET, BY END USER, 2023–2028 (USD MILLION)
- TABLE 229 REST OF EUROPE: MARKET, BY END USER, 2020–2022 (USD MILLION)
- TABLE 230 REST OF EUROPE: MARKET, BY END USER, 2023–2028 (USD MILLION)
- TABLE 232 COMPANY TYPE FOOTPRINT
- TABLE 233 COMPANY OUTPUT POWER RATING FOOTPRINT
- TABLE 234 COMPANY END USER FOOTPRINT
- TABLE 235 COMPANY REGION FOOTPRINT
- TABLE 236 COMPANY OVERALL FOOTPRINT
- TABLE 237 MARKET: LIST OF START-UPS/SMES
- TABLE 238 COMPETITIVE BENCHMARKING OF START-UPS/SMES, BY END USER
- TABLE 239 COMPETITIVE BENCHMARKING OF START-UPS/SMES, BY TYPE
- TABLE 240 COMPETITIVE BENCHMARKING OF START-UPS/SMES, BY POWER RATING
- TABLE 241 COMPETITIVE BENCHMARKING OF START-UPS/SMES, BY REGION
- TABLE 242 MARKET: DEALS, NOVEMBER 2019–JULY 2023
- TABLE 243 MARKET: OTHERS, NOVEMBER 2020–NOVEMBER 2023
- TABLE 244 HUAWEI TECHNOLOGIES CO., LTD.: COMPANY OVERVIEW
- TABLE 245 HUAWEI TECHNOLOGIES CO., LTD.: PRODUCTS/SOLUTIONS/SERVICES OFFERED
- TABLE 246 HUAWEI TECHNOLOGIES CO., LTD.: PRODUCT LAUNCHES
- TABLE 247 HUAWEI TECHNOLOGIES CO., LTD.: DEALS
- TABLE 248 HUAWEI TECHNOLOGIES CO., LTD.: OTHERS
- TABLE 249 SUNGROW: COMPANY OVERVIEW
- TABLE 250 SUNGROW: PRODUCTS/SOLUTIONS/SERVICES OFFERED
- TABLE 251 SUNGROW: PRODUCT LAUNCHES
- TABLE 252 SUNGROW: DEALS
- TABLE 253 SUNGROW: OTHERS
- TABLE 254 SMA SOLAR TECHNOLOGY AG: COMPANY OVERVIEW
- TABLE 255 SMA SOLAR TECHNOLOGY AG: PRODUCTS/SOLUTIONS/SERVICES OFFERED
- TABLE 256 SMA SOLAR TECHNOLOGY AG: PRODUCT LAUNCHES
- TABLE 257 SMA SOLAR TECHNOLOGY AG: DEALS
- TABLE 258 SMA SOLAR TECHNOLOGY AG: OTHERS
- TABLE 259 POWER ELECTRONICS S.L.: COMPANY OVERVIEW
- TABLE 260 POWER ELECTRONICS S.L.: PRODUCTS/SOLUTIONS/SERVICES OFFERED
- TABLE 261 POWER ELECTRONICS S.L.: PRODUCT LAUNCHES
- TABLE 262 FIMER GROUP: COMPANY OVERVIEW
- TABLE 263 FIMER GROUP: PRODUCTS/SOLUTIONS/SERVICES OFFERED
- TABLE 264 FIMER GROUP: PRODUCT LAUNCHES
- TABLE 265 FIMER GROUP: DEALS
- TABLE 266 FIMER GROUP: OTHERS
- TABLE 267 SOLAREDGE: COMPANY OVERVIEW
- TABLE 268 SOLAREDGE: PRODUCTS/SOLUTIONS/SERVICES OFFERED
- TABLE 269 SOLAREDGE TECHNOLOGIES: PRODUCT LAUNCHES
- TABLE 270 SOLAREDGE: DEALS
- TABLE 271 FRONIUS INTERNATIONAL GMBH: COMPANY OVERVIEW
- TABLE 272 FRONIUS INTERNATIONAL GMBH: PRODUCTS/SOLUTIONS/SERVICES OFFERED
- TABLE 273 FRONIUS INTERNATIONAL GMBH: PRODUCT LAUNCHES
- TABLE 274 FRONIUS INTERNATIONAL GMBH: DEALS
- TABLE 275 ALTENERGY POWER SYSTEM INC.: COMPANY OVERVIEW
- TABLE 276 ALTENERGY POWER SYSTEM INC.: PRODUCTS/SOLUTIONS/SERVICES OFFERED
- TABLE 277 ALTENERGY POWER SYSTEM INC.: PRODUCT LAUNCHES
- TABLE 278 ALTENERGY POWER SYSTEMS INC.: DEALS
- TABLE 279 ENPHASE ENERGY: COMPANY OVERVIEW
- TABLE 280 ENPHASE ENERGY: PRODUCTS/SOLUTIONS/SERVICES OFFERED
- TABLE 281 ENPHASE ENERGY: PRODUCT LAUNCHES
- TABLE 282 ENPHASE ENERGY: DEALS
- TABLE 283 ENPHASE ENERGY: OTHERS
- TABLE 284 DARFON: COMPANY OVERVIEW
- TABLE 285 DARFON: PRODUCTS/SOLUTIONS/SERVICES OFFERED
- TABLE 286 DARFON: PRODUCT LAUNCHES
- TABLE 287 SCHNEIDER ELECTRIC: COMPANY OVERVIEW
- TABLE 288 SCHNEIDER ELECTRIC: PRODUCTS/SOLUTIONS/SERVICES OFFERED
- TABLE 289 SCHNEIDER ELECTRIC: DEALS
- TABLE 290 SCHNEIDER ELECTRIC: OTHERS
- TABLE 291 GENERAL ELECTRIC: COMPANY OVERVIEW
- TABLE 292 GENERAL ELECTRIC: PRODUCTS/SOLUTIONS/SERVICES OFFERED
- TABLE 293 GENERAL ELECTRIC: PRODUCT LAUNCHES
- TABLE 294 GENERAL ELECTRIC: OTHERS
- TABLE 295 DELTA ELECTRONICS, INC.: COMPANY OVERVIEW
- TABLE 296 DELTA ELECTRONICS, INC.: PRODUCTS/SOLUTIONS/SERVICES OFFERED
- TABLE 297 DELTA ELECTRONICS, INC.: PRODUCT LAUNCHES
- TABLE 298 DELTA ELECTRONICS, INC.: DEALS
- TABLE 299 DELTA ELECTRONICS, INC.: OTHERS
- TABLE 300 EXIDE INDUSTRIES LTD.: COMPANY OVERVIEW
- TABLE 301 EXIDE ELECTRONICS LTD.: PRODUCTS/SOLUTIONS/SERVICES OFFERED
- TABLE 302 EXIDE ELECTRONICS LTD.: PRODUCT LAUNCHES
- FIGURE 1 MARKET: SEGMENTATION
- FIGURE 2 MARKET: RESEARCH DESIGN
- FIGURE 3 DATA TRIANGULATION
- FIGURE 4 MAIN METRICS CONSIDERED TO ANALYZE AND ASSESS DEMAND FOR INVERTERS
- FIGURE 5 MARKET SIZE ESTIMATION METHODOLOGY: BOTTOM-UP APPROACH
- FIGURE 6 MARKET SIZE ESTIMATION METHODOLOGY: TOP-DOWN APPROACH
- FIGURE 7 KEY STEPS CONSIDERED TO ASSESS SUPPLY OF INVERTERS
- FIGURE 8 MARKET: SUPPLY-SIDE ANALYSIS
- FIGURE 9 COMPANY REVENUE ANALYSIS, 2023
- FIGURE 10 MARKET IN ASIA PACIFIC TO REGISTER HIGHEST CAGR DURING FORECAST PERIOD
- FIGURE 11 BELOW 10 KW SEGMENT TO LEAD MARKET IN 2028
- FIGURE 12 100–300 V SEGMENT TO DOMINATE MARKET IN 2028
- FIGURE 13 RESIDENTIAL SEGMENT TO HOLD LARGEST SHARE OF MARKET IN 2028
- FIGURE 14 SOLAR INVERTER SEGMENT TO LEAD INVERTER MARKET IN 2028
- FIGURE 15 STANDALONE SEGMENT TO DOMINATE INVERTER MARKET IN 2028
- FIGURE 16 INDIRECT SEGMENT TO HOLD LARGER SHARE OF INVERTER MARKET IN 2028
- FIGURE 17 INCREASING ADOPTION OF RENEWABLE ENERGY SOURCES TO CREATE LUCRATIVE OPPORTUNITIES FOR MARKET PLAYERS DURING FORECAST PERIOD
- FIGURE 18 RESIDENTIAL SEGMENT AND CHINA TO HOLD LARGEST SHARES OF INVERTER MARKET IN ASIA PACIFIC IN 2023
- FIGURE 19 BELOW 10 KW SEGMENT TO DOMINATE INVERTER MARKET IN 2028
- FIGURE 20 100–300 V SEGMENT TO ACCOUNT FOR LARGEST SHARE OF INVERTER MARKET IN 2028
- FIGURE 21 RESIDENTIAL SEGMENT TO HOLD LARGEST SHARE OF INVERTER MARKET IN 2028
- FIGURE 22 SOLAR INVERTER SEGMENT TO DOMINATE INVERTER MARKET IN 2028
- FIGURE 23 STANDALONE SEGMENT TO ACCOUNT FOR LARGER SHARE OF INVERTER MARKET IN 2028
- FIGURE 24 INDIRECT SEGMENT TO HOLD LARGER SHARE OF INVERTER MARKET IN 2028
- FIGURE 25 INVERTER MARKET: DRIVERS, RESTRAINTS, OPPORTUNITIES, AND CHALLENGES
- FIGURE 26 NET SOLAR PV ELECTRICITY CAPACITY ADDITIONS, BY REGION, 2022–2024
- FIGURE 27 GLOBAL INVESTMENTS IN CLEAN ENERGY GENERATION, 2015–2023 (USD BILLION)
- FIGURE 30 TRENDS/DISRUPTIONS IMPACTING CUSTOMERS’ BUSINESSES
- FIGURE 31 ECOSYSTEM MAPPING
- FIGURE 32 INVERTER MARKET: VALUE CHAIN ANALYSIS
- FIGURE 33 INVERTER MARKET: PATENT REGISTRATIONS, 2012–2022
- FIGURE 34 IMPORT DATA FOR HS CODE 850440-COMPLIANT PRODUCTS, BY TOP FIVE COUNTRIES, 2020–2022 (USD THOUSAND)
- FIGURE 35 EXPORT DATA FOR HS CODE 850440-COMPLIANT PRODUCTS, BY TOP FIVE COUNTRIES, 2020–2022 (USD THOUSAND)
- FIGURE 36 AVERAGE SELLING PRICE (ASP) TREND OF INVERTERS, BY TYPE, 2021–2023 (USD/UNIT)
- FIGURE 37 AVERAGE SELLING PRICE (ASP) TREND OF INVERTERS, BY REGION, 2021–2023 (USD/UNIT)
- FIGURE 38 INVERTER MARKET: PORTER’S FIVE FORCES ANALYSIS
- FIGURE 39 INFLUENCE OF KEY STAKEHOLDERS ON BUYING PROCESS FOR TOP THREE END USERS
- FIGURE 40 KEY BUYING CRITERIA FOR TOP THREE END USERS
- FIGURE 41 INVERTER MARKET, BY OUTPUT POWER RATING, 2023
- FIGURE 42 INVERTER MARKET, BY END USER, 2023 (USD MILLION)
- FIGURE 43 INVERTER MARKET, BY TYPE, 2023 (USD MILLION)
- FIGURE 44 INVERTER MARKET, BY OUTPUT VOLTAGE, 2023 (USD MILLION)
- FIGURE 45 INVERTER MARKET, CONNECTION TYPE, 2023 (USD MILLION)
- FIGURE 46 INVERTER MARKET, BY SALES CHANNEL, 2023 (USD MILLION)
- FIGURE 47 INVERTER MARKET, BY REGION, 2023
- FIGURE 48 ASIA PACIFIC TO REGISTER HIGHEST CAGR IN INVERTER MARKET DURING FORECAST PERIOD
- FIGURE 49 NORTH AMERICA: INVERTER MARKET SNAPSHOT
- FIGURE 50 ASIA PACIFIC: INVERTER MARKET SNAPSHOT
- FIGURE 51 INVERTER MARKET SHARE ANALYSIS OF TOP PLAYERS, 2022
- FIGURE 52 INVERTER MARKET: REVENUE ANALYSIS, 2018–2022
- FIGURE 53 INVERTER MARKET: COMPANY EVALUATION MATRIX, 2022
- FIGURE 54 INVERTER MARKET: START-UP/SME EVALUATION MATRIX, 2022
- FIGURE 55 HUAWEI TECHNOLOGIES CO., LTD.: COMPANY SNAPSHOT
- FIGURE 56 SUNGROW: COMPANY SNAPSHOT
- FIGURE 57 SMA SOLAR TECHNOLOGY AG: COMPANY SNAPSHOT
- FIGURE 58 SOLAREDGE: COMPANY SNAPSHOT
- FIGURE 59 ENPHASE ENERGY: COMPANY SNAPSHOT
- FIGURE 60 DAFRON: COMPANY SNAPSHOT
- FIGURE 61 SCHNEIDER ELECTRIC: COMPANY SNAPSHOT
- FIGURE 62 GENERAL ELECTRIC: COMPANY SNAPSHOT
- FIGURE 63 DELTA ELECTRONICS, INC.: COMPANY SNAPSHOT
- FIGURE 64 EXIDE ELECTRONICS LTD.: COMPANY SNAPSHOT
The study involved major activities in estimating the current size of the Inverter market. Exhaustive secondary research was done to collect information on the peer and parent markets. The next step was to validate these findings, assumptions, and sizing with industry experts across the value chain through primary research. Both top-down and bottom-up approaches were employed to estimate the complete market size. Thereafter, market breakdown and data triangulation were used to estimate the market size of the segments and subsegments.
Secondary Research
This research study on the Inverter market involved the use of extensive secondary sources, directories, and databases, such as US Department of Energy, US Environmental Protection Agency (EPA), National Electrical Manufacturers Association (NEMA), Consumer Product Safety Commission (CPSC, California Energy Commission (CEC), European Committee for Electro Technical Standardization, European Union Agency for the Cooperation of Energy Regulators (ACER), Bureau of Indian standards, China National Institute of Standardization, Japanese Standards Association, and Electricity & Co-Generation Regulatory Authority (ECRA), to identify and collect information useful for a technical, market-oriented, and commercial study of the global Inverter market. The other secondary sources included annual reports, press releases & investor presentations of companies, white papers, certified publications, articles by recognized authors, manufacturer associations, trade directories, and databases.
Primary Research
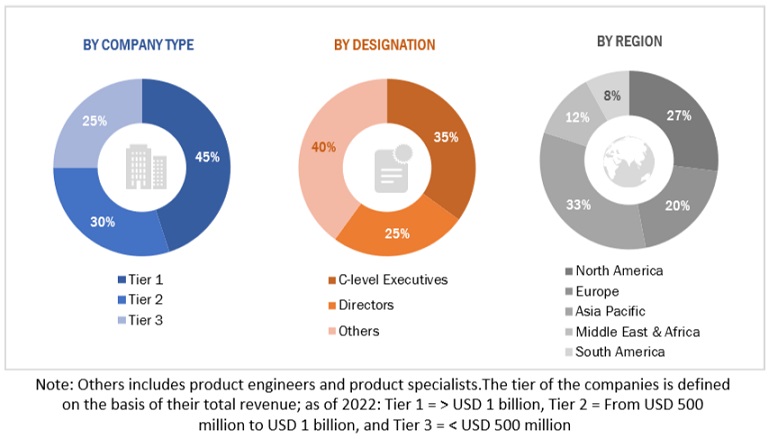
The Inverter market comprises several stakeholders such as Inverter manufacturers, manufacturers of subcomponents of Inverter, manufacturing technology providers, and technology support providers in the supply chain. The increased use of renewable energy sources worldwide, especially in solar and wind power projects, is driving up demand for inverters. An essential function of inverters is to transform the direct current (DC) produced by solar panels or wind turbines into alternating current (AC) that may be used for human consumption. Inverters are becoming more and more necessary as countries work to achieve sustainable energy solutions and shift to cleaner power sources. There is also a greater need for inverters in a variety of industries due to growing electrification, the development of infrastructure for electric vehicles, and improvements in industrial processes.
To know about the assumptions considered for the study, download the pdf brochure
Market Size Estimation
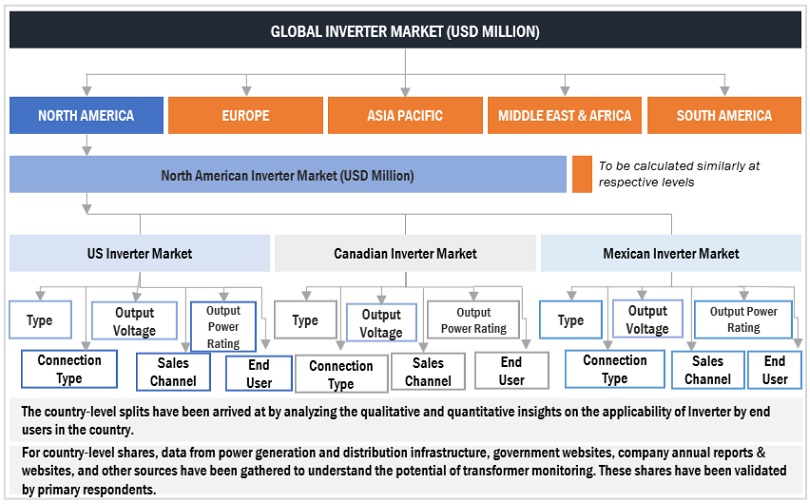
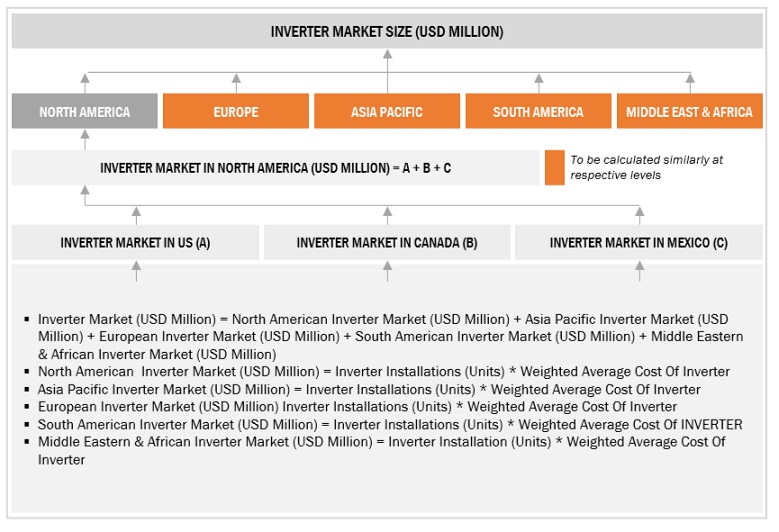
Both top-down and bottom-up approaches were used to estimate and validate the total size of the Inverter market. These methods were also used extensively to estimate the size of various subsegments in the market. The research methodology used to estimate the market size includes the following:
- The key players in the industry and market have been identified through extensive secondary research, and their market share in the respective regions have been determined through both primary and secondary research.
- The industry’s value chain and market size, in terms of value, have been determined through primary and secondary research processes.
- All percentage shares, splits, and breakdowns have been determined using secondary sources and verified through primary sources.
Global Inverter Market Size: Top-down Approach
To know about the assumptions considered for the study, Request for Free Sample Report
Global Inverter Market Size: Bottom-Up Approach
Data Triangulation
After arriving at the overall market size from the estimation process explained above, the total market has been split into several segments and subsegments. To complete the overall market engineering process and arrive at the exact statistics for all the segments and subsegments, the data triangulation and market breakdown processes have been employed, wherever applicable. The data has been triangulated by studying various factors and trends from both the demand- and supply sides. Along with this, the market has been validated using both the top-down and bottom-up approaches.
Market Definition
An inverter transforms DC voltage to alternating current voltage. In most circumstances, the input DC voltage is lower, but the output AC voltage is equivalent to the grid supply voltage, which might be 120 or 240 volts depending on the country. The inverter is designed to act as a standalone piece of equipment for applications such as solar power or as a backup power supply from batteries that are charged separately.
Key Stakeholders
- Energy utilities
- Government and research organizations
- Institutional investors
- Investors/shareholders
- Process industries and power and energy associations
- Public and private operators of power plants
- Inverter manufacturers, dealers, and suppliers
Objectives of the Study
- To define, describe, segment, and forecast the Inverter market, in terms of value and output power rating, end user, type, output voltage, connection type, sales channel and region
- To forecast the market size for five key regions: North America, South America, Europe, Asia Pacific, and Middle East & Africa, along with their key countries
- To provide detailed information about the key drivers, restraints, opportunities, and challenges influencing the growth of the market
- To strategically analyze the subsegments with respect to individual growth trends, prospects, and contributions of each segment to the overall market size
- To analyze market opportunities for stakeholders and the competitive landscape of the market
- To strategically profile the key players and comprehensively analyze their market shares and core competencies
- To analyze competitive developments, such as deals and agreements in the market
Available Customizations:
With the given market data, MarketsandMarkets offers customizations as per the client’s specific needs. The following customization options are available for this report:
Geographic Analysis
- Further breakdown of region or country-specific analysis
Company Information
- Detailed analyses and profiling of additional market players (up to 5)
Growth opportunities and latent adjacency in Inverter Market