
Haptic Technology Market Size, Share & Trends

Haptic Technology Market by Eccentric Rotating Mass (ERM) & Linear Resonant Actuators (LRAs), Piezo Electric Actuators, Drivers & Microcontrollers, Feedback Type (Tactile, Force), Active Haptic Device, Passive Haptic Device - Global Forecast to 2030


HAPTIC TECHNOLOGY MARKET OVERVIEW
Source: Secondary Research, Interviews with Experts, MarketsandMarkets Analysis
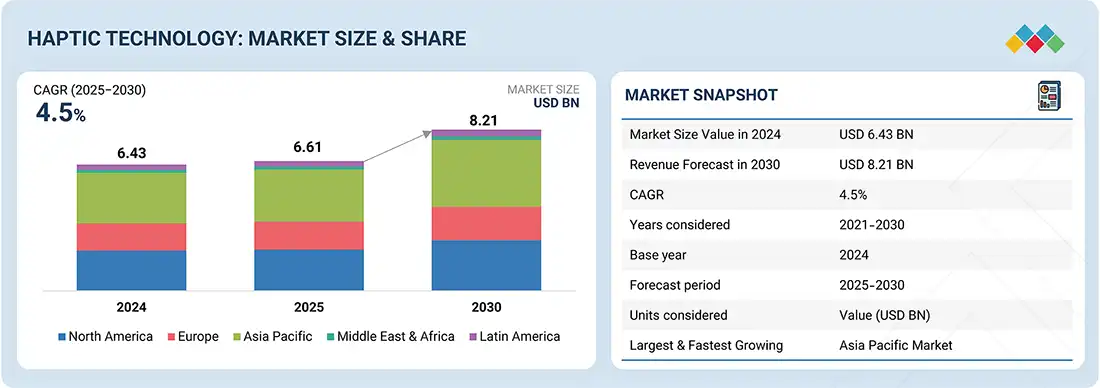
The haptic technology market is projected to reach USD 8.21 billion by 2030 from USD 6.61 billion in 2025, at a CAGR of 4.5% during the forecast period. The market growth is driven by the rising demand for immersive user experiences in consumer electronics, gaming, and virtual reality applications. Advancements in touch-based interfaces, force feedback mechanisms, and ultrasonic haptics are enhancing the precision, responsiveness, and realism of human–machine interactions. Furthermore, increasing adoption of haptic solutions in automotive, healthcare, and industrial applications, such as driver assistance systems, surgical simulation, and remote robotic control, is expanding market opportunities.
Haptic Technology Market Size & Forecast
KEY TAKEAWAYS
- Tactile feedback leads due to its widespread use in smartphones, wearables, gaming devices, and consumer electronics for enhanced user interaction.
- Hardware dominates as actuators, sensors, and controllers form the core components enabling tactile feedback across various devices.
- Consumer electronics holds the largest share driven by rising adoption of immersive, touch-based interfaces in smartphones, tablets, gaming, and wearables.
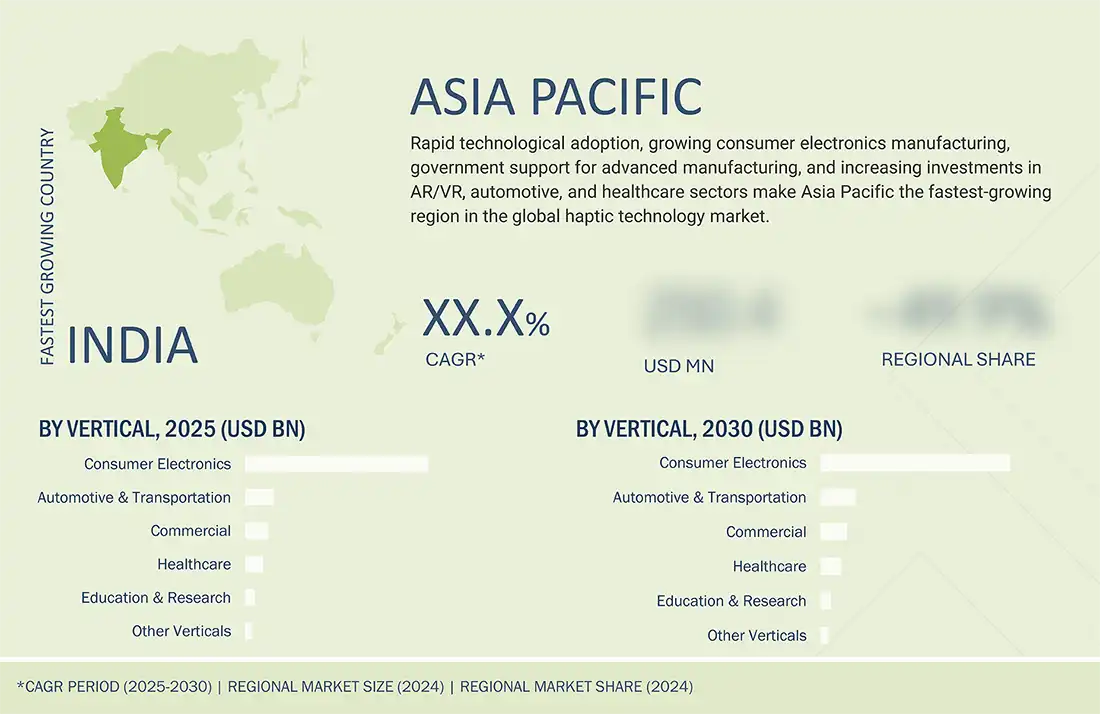
- Asia Pacificholds the largest market share of 40.0% due to strong electronics manufacturing, high smartphone adoption, and growing AR/VR investments.
- The major market players/stars in the haptic technology market are Immersion Corporation, AAC Technologies, and TDK Corporation SME/Startups in the haptic technology market are 3D Systems, Actronika, TactileLabs, Quanser.
The Haptic Technology Market is projected to witness substantial growth over the next decade, driven by the rising demand for immersive and interactive user experiences across consumer electronics, gaming, and AR/VR applications. Integration of advanced technologies such as ultrasonic vibrations, force feedback, and micro-electromechanical systems (MEMS) is enhancing tactile precision and realism, making haptics essential in improving human–machine interactions. Additionally, growing adoption in automotive, healthcare, and industrial applications ranging from driver assistance and surgical simulation to remote robotic control further accelerates market expansion, positioning haptic technology as a key enabler of next-generation digital experiences globally.
TRENDS & DISRUPTIONS IMPACTING CUSTOMERS' CUSTOMERS
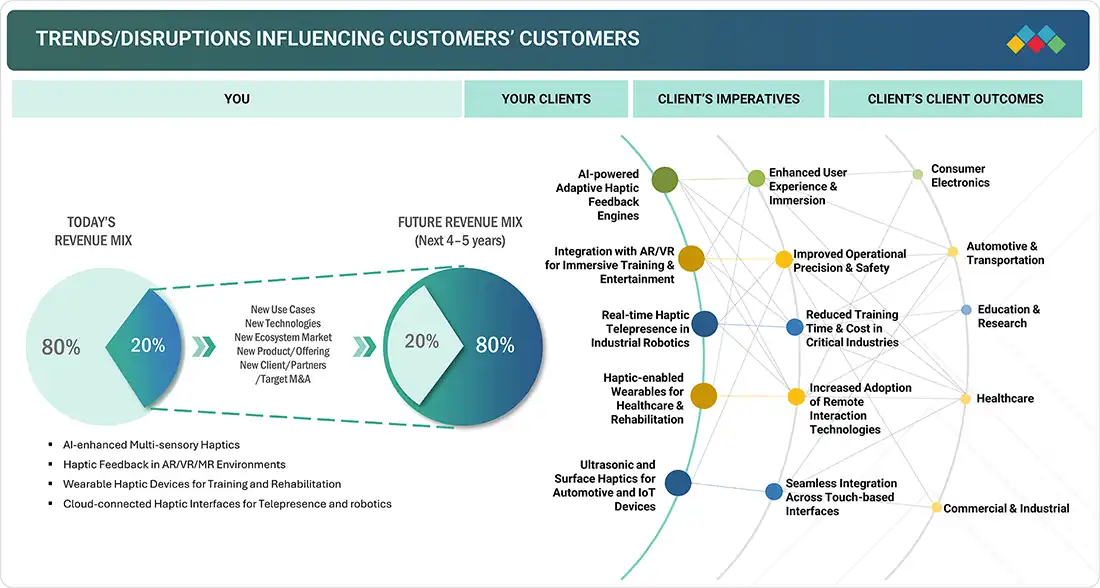
The haptic technology market is undergoing a significant transformation driven by emerging technologies and innovations that are set to redefine the future revenue mix over the next 4–5 years. Currently, most of the revenue is generated from established solutions such as AI-enhanced multi-sensory haptics, wearable haptic devices for training and rehabilitation, and haptic feedback in AR/VR/MR environments. Key trends influencing this shift include AI-powered adaptive haptic feedback engines, integration with AR/VR for immersive training and entertainment, real-time haptic telepresence in industrial robotics, haptic-enabled wearables for healthcare and rehabilitation, and ultrasonic/surface haptics for automotive and IoT devices. These innovations cater to client imperatives such as enhancing user experience and immersion, improving operational precision and safety, reducing training time and costs in critical industries, increasing adoption of remote interaction technologies, and enabling seamless integration across touch-based interfaces.
Source: Secondary Research, Interviews with Experts, MarketsandMarkets Analysis
Haptic Technology Market DYNAMICS
Level
-
Rising integration of haptic technology into consumer electronics

Level
-
High cost of force feedback technology

Level
-
Rising application of haptic technology in aerospace & defense industry

Level
-
Technical challenges related to product design

Source: Secondary Research, Interviews with Experts, MarketsandMarkets Analysis
Driver: Rising integration of haptic technology into consumer electronics
The haptic technology market is being driven by its growing integration into consumer electronics, as manufacturers focus on enhancing user experience through immersive, responsive interfaces. Key players like Apple, Sony, and Samsung are embedding advanced haptic feedback systems in smartphones, gaming consoles, tablets, and wearables, delivering tactile sensations that replicate real-world interactions. Innovations such as Apple’s Taptic Engine, Sony’s DualSense controller, and Xiaomi’s upgraded X-axis linear motor exemplify this trend. Rising demand for foldable smartphones, AR/VR devices, and advanced touchscreens is further accelerating adoption, reflecting a strategic shift toward tactile innovation to boost user engagement and product differentiation.
Restraint: High cost of force feedback technology
A key restraint in the haptic technology market is the high cost of force feedback devices, primarily used in medical, automotive, aerospace, and manufacturing applications, as well as for assistive learning. Unlike tactile haptics in consumer electronics, force feedback devices such as haptic gloves require advanced sensors and precise actuation to deliver realistic virtual touch experiences. Their elevated prices stem from development, material, patent, and licensing costs, compounded by limited demand that prevents economies of scale. Despite their benefits in VR, gaming, and professional applications, these high costs hinder widespread adoption across industries.
Opportunity: Rising application of haptic technology in aerospace & defense industry
The aerospace and defense sector presents a significant opportunity for haptic technology adoption, particularly through mid-air and tactile feedback systems. In pilot training and virtual reality flight decks, haptics enhances situational awareness, allowing pilots to monitor cockpit displays while maintaining focus on critical operations, improving safety, training quality, and flight performance. In defense, haptic feedback aids threat detection, weapon control, and decision-making, boosting operational efficiency. With companies like Engineering and Computer Simulations developing dedicated haptic test labs for the US Army and Navy, the growing demand for cost-effective, immersive, and precise training solutions is expected to drive market growth in this sector.
Challenge: Technical challenges related to product design
The haptic technology market faces challenges in designing devices that are often bulky, non-portable, and difficult to transport, limiting adoption across sectors like healthcare and automotive. Network constraints further hinder seamless implementation, while manufacturers struggle to ensure consistent, high-quality haptic feedback across smartphones, laptops, surgical tools, and dashboards. Enhancing actuator design, driver features, and controller integration is critical to improving performance and user interaction. Additionally, creating an optimized haptic user experience requires understanding that tactile perception relies on minimal motion and moderate acceleration. Continuous innovation in system design and usability is essential to address these obstacles and drive broader market adoption.
HAPTIC TECHNOLOGY MARKET: COMMERCIAL USE CASES ACROSS INDUSTRIES
| COMPANY | USE CASE DESCRIPTION | BENEFITS |
|---|---|---|
 |
Integration of haptic feedback in iPhones, Apple Watches, and trackpads using the Taptic Engine to provide precise vibrations and tactile responses for notifications, gestures, and immersive app experiences. | Enhanced user interaction, improved accessibility, more immersive notifications, and enriched gaming and app experiences, leading to higher user engagement and satisfaction. |
 |
Deployment of haptic-enabled smartphones, tablets, and wearables with advanced X-axis linear motors and vibration feedback systems for immersive touch, gaming, and AR experiences. | Improved tactile response, enhanced gaming and AR/VR experiences, better user satisfaction, and differentiated product offerings in competitive consumer electronics markets. |
 |
Incorporation of haptic feedback in automotive dashboards, steering wheels, and infotainment systems to deliver tactile alerts, enhance driver assistance, and improve in-car navigation. | Increased driver safety, reduced distraction, enhanced user interface experience, and improved customer perception of advanced technology in vehicles. |
 |
Use of haptic-enabled surgical tools and robotic systems to provide force feedback during minimally invasive procedures for enhanced precision and control. | Improved surgical accuracy, reduced risk of errors, better tactile perception for surgeons, and enhanced patient safety and procedure outcomes. |
Logos and trademarks shown above are the property of their respective owners. Their use here is for informational and illustrative purposes only.
Haptic Technology Market ECOSYSTEM
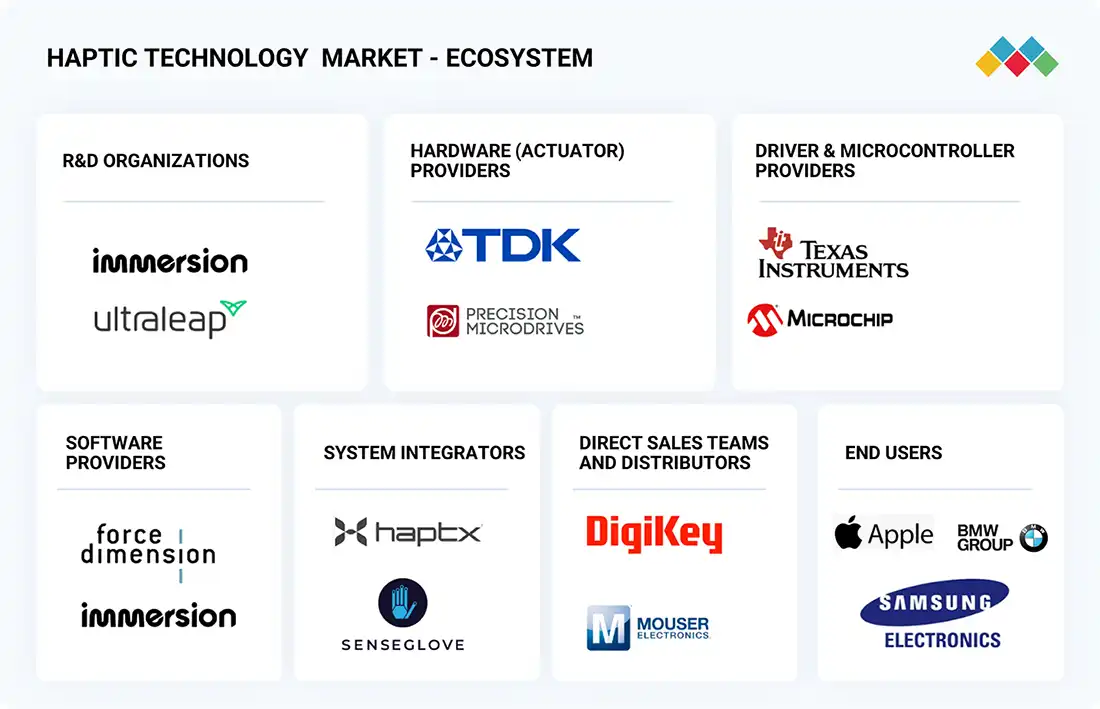
The haptic technology ecosystem involves identifying and analyzing interconnected relationships among various stakeholders, including actuator providers, system integrators, distributors, and end users. Actuator providers such as TDK and Precision Microdrives design and develop critical hardware components that generate tactile feedback for haptic-enabled devices. System integrators like SenseGlove and Haptex provide specialized services to implement, customize, and integrate haptic solutions into diverse applications, ensuring seamless user experiences. Software providers such as Force Dimension and Immersion develop advanced haptic algorithms, SDKs, and platforms that enable realistic force feedback and touch-based interactions across multiple applications. Distributors such as Mouser Electronics and DigiKey facilitate the supply chain by connecting actuator providers and system integrators with end users, ensuring efficient delivery and deployment of solutions. End users include leading technology and automotive companies such as Apple, Samsung Electronics, and BMW Group, which implement haptic technologies to enhance user interaction, improve device functionality, and provide immersive experiences. Collaboration among these stakeholders strengthens innovation, drives operational efficiency, and accelerates the adoption of haptic technology across industries.
Logos and trademarks shown above are the property of their respective owners. Their use here is for informational and illustrative purposes only.
Haptic Technology Market SEGMENTS
Source: Secondary Research, Interviews with Experts, MarketsandMarkets Analysis
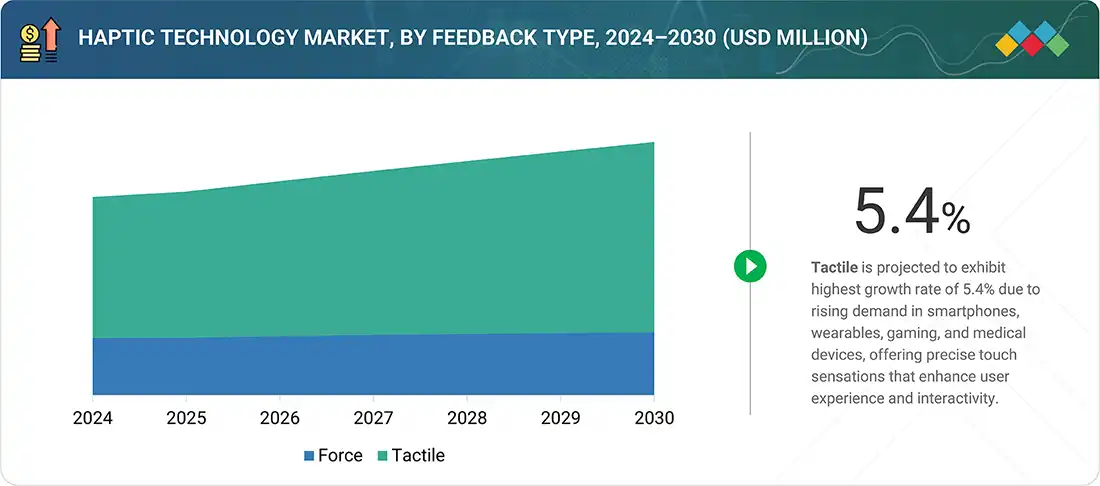
Haptic Technology Market, By Feedback Type
The tactile segment in the haptic technology market is projected to exhibit the highest growth rate due to increasing demand for more immersive and realistic user experiences across industries such as consumer electronics, gaming, healthcare, and automotive. Tactile feedback allows users to feel textures, vibrations, and forces, enhancing interactivity and engagement in devices like smartphones, wearables, VR/AR headsets, and surgical simulators. Technological advancements in actuators and material science have made tactile solutions more precise, compact, and cost-effective. Additionally, rising adoption of touch-based interfaces and haptic-enabled applications in training, remote control, and virtual environments is further driving market expansion.
Haptic Technology Market, By Component
In the haptic technology market, the software segment is expected to witness the highest CAGR during the forecast period due to the increasing demand for advanced haptic experiences across multiple applications, including gaming, healthcare, AR/VR, and automotive. Software plays a critical role in translating tactile feedback into realistic sensations, enabling device customization, gesture recognition, and immersive interactions. Additionally, the growing adoption of IoT, AI, and machine learning in haptic systems is driving the need for sophisticated software solutions that can process data in real time, enhance user experience, and enable seamless integration across devices, boosting market growth.
Haptic Technology Market, By Vertical
The Automotive & Transportation vertical in the haptic technology market is expected to witness the highest CAGR during the forecast period due to the growing integration of advanced driver-assistance systems (ADAS), autonomous driving technologies, and in-vehicle infotainment systems that leverage haptic feedback for enhanced user experience and safety. Haptic interfaces improve driver interaction, reduce distraction, and provide tactile alerts for navigation, collision warnings, and control systems. Additionally, increasing consumer demand for luxury and connected vehicles, coupled with regulatory emphasis on vehicle safety, is driving automakers to adopt haptic solutions, boosting market growth in this vertical.
HAPTIC TECHNOLOGY MARKET REGION
Asia Pacific to be fastest-growing region in global haptic technology market during forecast period
The Asia Pacific region is poised to be the fastest growing in the global haptic technology industry during the forecast period due to several key factors. Rapid advancements in consumer electronics manufacturing, particularly in countries like China, Japan, and South Korea, drive demand for smartphones, tablets, and wearables, which increasingly incorporate haptic feedback systems. Additionally, the automotive sector in the region is adopting haptic technology for safety systems. Furthermore, strong investments in healthcare and AR/VR technologies are accelerating the use of haptic feedback in medical devices and immersive applications. These combined factors position Asia Pacific as a dominant force in the haptic technology market.
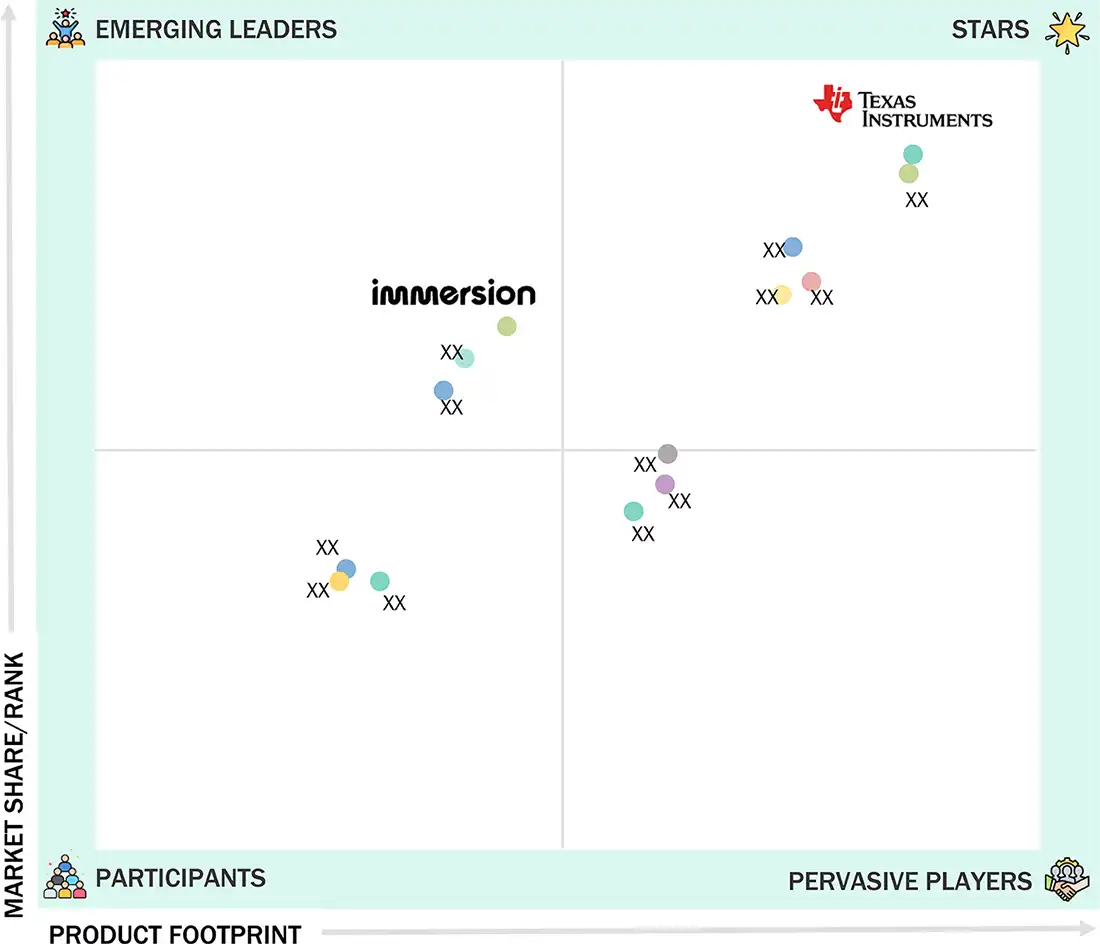
Haptic Technology Market: COMPANY EVALUATION MATRIX
In the haptic technology companies matrix, Texas Instruments (Star) leads with a strong market presence, comprehensive haptic solutions, and advanced technologies for touch feedback, vibration actuators, and tactile interfaces, driving adoption across consumer electronics, automotive, and healthcare applications. Immersion (Emerging Leader) is gaining momentum with innovative offerings in software-based haptic engines, gesture-based feedback systems, and virtual reality-enabled touch experiences. While Texas Instruments dominates the market through scale, technological expertise, and extensive partnerships, Immersion demonstrates significant growth potential, supported by strong R&D capabilities and expanding product offerings, positioning itself to advance toward the leaders' quadrant in the haptic technology market.
Source: Secondary Research, Interviews with Experts, MarketsandMarkets Analysis
Haptic Technology Market KEY PLAYERS
Haptic Technology Market SCOPE
| REPORT METRIC | DETAILS |
|---|---|
| Market Size in 2024 (Value) | USD 6.43 Billion |
| Market Forecast in 2030 (Value) | USD 8.21 Billion |
| Growth Rate | CAGR of 4.5% from 2025-2030 |
| Years Considered | 2021-2030 |
| Base Year | 2024 |
| Forecast Period | 2025-2030 |
| Units Considered | Value (USD Billion) |
| Report Coverage | Revenue forecast, company ranking, competitive landscape, growth factors, and trends |
| Segments Covered | By Feedback Type: Tactile, Force By Component: Hardware, Software By Vertical: Consumer Electronics, Automotive & Transportation, Education & Research, Healthcare, Commercial, Other Verticals |
| Regional Scope | North America, Asia Pacific, Europe, the Middle East & Africa, and Latin America |
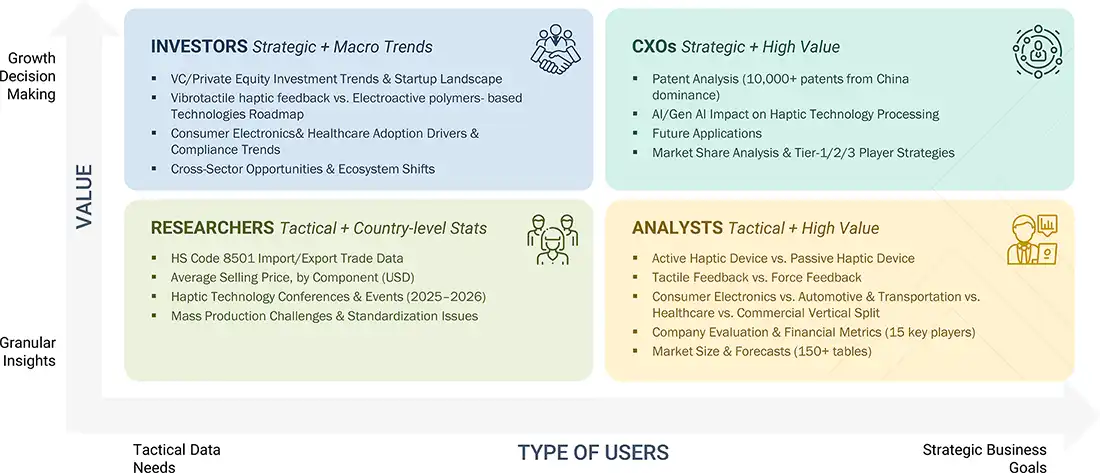
WHAT IS IN IT FOR YOU: Haptic Technology Market REPORT CONTENT GUIDE
DELIVERED CUSTOMIZATIONS
We have successfully delivered the following deep-dive customizations:
| CLIENT REQUEST | CUSTOMIZATION DELIVERED | VALUE ADDS |
|---|---|---|
| Consumer Electronics OEM | • Mapping of haptic component suppliers (actuators and drivers) across regions • Benchmarking of haptic integration in smartphones, wearables, AR/VR devices • Analysis of patent activity in advanced haptics (ultrasonic, electrostatic, vibrotactile) | • Identify best-fit suppliers for strategic sourcing • Highlight competitive positioning in next-gen consumer devices • Spot opportunities in immersive experiences for AR/VR adoption |
| Haptic Component Manufacturer | • Global and regional demand outlook for actuators and drivers • Pricing intelligence and cost structure analysis • Profiling of potential customers by industry and application | • Strengthen pricing strategy and margin planning • Target high-growth verticals like automotive and XR • Identify new revenue streams through cross-industry applications |
| Healthcare & Medical Device Manufacturer | • Landscape study of haptic applications in surgical simulators, rehabilitation devices, and remote diagnostics • Evaluation of haptic-enabled telemedicine and training platforms • Clinical outcome analysis of haptic-assisted procedures | • Pinpoint growth avenues in healthcare training and simulation markets • Enhance product positioning in medical robotics • Support partnerships with hospitals and medical training institutes |
| Gaming & Entertainment Company | • Consumer adoption insights across eSports, console gaming, and location-based VR • Case studies of immersive haptic deployments in theme parks and interactive media | • Drive revenue from immersive entertainment experiences • Identify high-margin opportunities in gaming peripherals • Strengthen brand engagement through enhanced sensory immersion |
RECENT DEVELOPMENTS
- January 2025 : AAC Technologies launched the RichTap Haptic Seat Solution, a new haptic system designed for automotive applications.
- December 2023 : AAC Technologies formed a strategic partnership with UltraSense Systems to develop comprehensive touch experience solutions for the automotive and consumer electronics sectors.
- September 2023 : TDK Corporation launched the PowerHap Development Starter Kit to help engineers and designers easily prototype high-performance haptic feedback systems using PowerHap piezoelectric actuators.
- June 2022 : Texas Instruments Incorporated launched the CC234 wireless microcontroller (MCU) that enables high-quality Bluetooth Low Energy (LE).
- March 2021 : Immersion collaborated with StrikerVR for VR haptic peripherals, aiming to deliver highly realistic tactile feedback in immersive environments.
Table of Contents
 Exclusive indicates content/data unique to MarketsandMarkets and not available with any competitors.
Methodology
The research study involved four major activities in estimating the haptic technology market size. Exhaustive secondary research has been done to collect important information about the market and peer markets. The next step has been to validate these findings and assumptions and size them with the help of primary research with industry experts across the value chain. Both top-down and bottom-up approaches have been used to estimate the market size. The market breakdown and data triangulation have been adopted to estimate the market sizes of segments and sub-segments.
Secondary Research
Various secondary sources were consulted in the secondary research process to identify and collect information required for this study. These sources include annual reports, press releases, investor presentations of companies, white papers, and articles from recognized authors. Secondary research has been mainly done to obtain key information about the market’s value chain, the pool of key market players, market segmentation according to industry trends, regional outlook, and developments from both market and technology perspectives.
Primary Research
In primary research, various sources from both the supply and demand sides have been interviewed to obtain the qualitative and quantitative insights required for this report. Primary sources from the supply side include experts such as CEOs, vice presidents, marketing directors, manufacturers, technology and innovation directors, end users, and related executives from multiple key companies and organizations operating in the haptic technology market ecosystem. After interacting with industry experts, brief sessions were conducted with highly experienced independent consultants to reinforce the findings from our primary research. This, along with the in-house subject matter experts’ opinions, has led us to the findings as described in the report. The breakdown of primary respondents is as follows:

Note: Others include sales, marketing, and product managers
To know about the assumptions considered for the study, download the pdf brochure
Market Size Estimation
In the market engineering process, both top-down and bottom-up approaches and data triangulation methods have been used to estimate and validate the size of the haptic technology market and other dependent submarkets. The research methodology used to estimate the market sizes includes the following:
The bottom-up procedure has been employed to arrive at the overall size of the haptic technology market.
- Major companies that provide haptic technology components were identified. This included analyzing company portfolios, product offerings, and presence across various regions.
- The segment-specific revenues of the companies, particularly those related to haptic technology, were determined.
- The product-specific revenues of the companies, particularly those related to haptic technology, were determined.
- These individual revenue figures were compiled to determine the total revenue generated across the identified companies within the sector.
- The global market size for haptic technology was obtained using this consolidated data.
The top-down approach has been used to estimate and validate the total size of the haptic technology market.
- Identified top-line investments and spending in the ecosystem and major market developments to consider segment-level splits
- Estimated the overall haptic technology market size, then segmented the global market by allocating shares based on the segments considered
- Distributed the segment-level markets into regions and countries by aligning regional haptic technology activity with economic indicators, haptic technology manufacturing presence, and national development initiatives
Haptic Technology Market : Top-Down and Bottom-Up Approach

Data Triangulation
After arriving at the overall market size using the market size estimation processes as explained above, the market has been split into several segments and subsegments. Data triangulation and market breakdown procedures have been employed to complete the entire market engineering process and arrive at the exact statistics of each market segment and subsegment. The data has been triangulated by studying various factors and trends from the demand and supply sides of the haptic technology market.
Market Definition
The haptic technology involves designing, developing, and integrating tactile feedback systems that simulate the sense of touch by applying forces, vibrations, or motions to the user. This technology enhances human–machine interaction by enabling users to perceive and manipulate virtual objects or interface elements through realistic tactile sensations. Haptic systems combine actuators, sensors, controllers, and haptic software to deliver feedback across applications such as consumer electronics, automotive, healthcare, industrial, and gaming. They are essential for improving usability, accessibility, and immersion in both physical and virtual environments. Key components of haptic technology include tactile feedback, force feedback, and kinesthetic feedback systems, often integrated with advanced control algorithms for precise and responsive performance. The adoption of haptic technology is driven by rising demand for immersive user experiences, growing penetration of smart devices, and advancements in VR, AR, and XR platforms. With the increasing proliferation of connected devices, miniaturized actuators, and energy-efficient designs, haptic technology is evolving to enable high-definition touch interactions, enhance safety in automotive systems, improve surgical simulations in healthcare, and deliver engaging experiences in gaming and entertainment. Haptics plays a vital role in bridging the gap between digital and physical interactions, enriching user engagement, and supporting the growth of next-generation interactive technologies.
Key Stakeholders
- Haptic component manufacturers
- Haptic software providers
- Raw material and manufacturing equipment suppliers
- End users
- Technology standards organizations, forums, alliances, and associations
- Governments, financial institutions, and investment communities
- Research organizations
- Analysts and strategic business planners
- Venture capitalists, private equity firms, and startups
Report Objectives
- To define, describe, segment, and forecast the haptic technology market size by feedback type, component, vertical, and region, in terms of value
- To assess the market size in four key regions: North America, Europe, Asia Pacific, and RoW, in terms of value
- To provide detailed information regarding the key factors such as drivers, restraints, opportunities, and challenges influencing the growth of the market
- To analyze the haptic technology value chain and ecosystem, along with the average selling price by component and region
- To strategically study the regulatory landscape, tariff, standards, patents, Porter’s Five Forces, import & export scenarios, trade values, and case studies pertaining to the market under study
- To understand micromarkets with regard to individual growth trends, prospects, and contributions to the overall market
- To assess opportunities in the market for stakeholders by identifying high-growth segments
- To provide details of the competitive landscape for market leaders
- To present the impact of AI/Gen AI on the haptic technology market
- To outline the macroeconomic outlook for the regions under study
- To analyze strategies such as product launches, collaborations, acquisitions, and partnerships adopted by players in the haptic technology market
- To profile key market players and comprehensively analyze their ranking based on their revenue, market share, and core competencies
Available Customizations
With the given market data, MarketsandMarkets offers customizations according to the specific requirements of companies. The following customization options are available for the report:
Country-wise Information:
- Country-wise breakdown for North America, Europe, Asia Pacific, and Rest of the World
Company Information:
- Detailed analysis and profiling of additional market players (up to five)
Key Questions Addressed by the Report
What is the expected market size of the haptic technology market in 2025?
The haptic technology market is projected to reach USD 8.21 billion by 2030 from USD 6.61 billion in 2025, growing at a CAGR of 4.5% during the forecast period.
Who are the significant players in the global haptic technology market?
Texas Instruments Incorporated (US), Johnson Electric Holdings Limited (China), AAC Technologies (China), TDK Corporation (Japan), and Semiconductor Components Industries, LLC (US) are the major players in the haptic technology market.
Which region is expected to hold the largest market share?
The Asia Pacific region is expected to hold the largest haptic technology market size of USD 3.41 billion during the forecast period.
What are the major haptic technology market drivers?
Rising integration of haptic technology into consumer devices, growing use of haptic technology in the automotive industry, increasing use of haptic technology in the healthcare industry, and increasing adoption of haptic technology in industrial applications are the major market drivers.
What are the major strategies adopted by market players?
The key players have adopted product launches, partnerships, collaborations, acquisitions, agreements, and expansions to strengthen their position in the haptic technology market.
How does Gen AI/AI impact the haptic technology market on a scale of 1-10 (1 - least impacted, 10 - most impacted)?
The impact is as follows:
|
Real-time Tactile Adaptation |
9.0 |
|
Synthetic Data Generation & Simulation |
8.0 |
|
Predictive Maintenance of Haptic Devices |
7.0 |
|
Enhanced Haptic Rendering in AR/VR |
8.0 |
|
Design Optimization & Prototyping |
7.0 |
Need a Tailored Report?
Customize this report to your needs
Get 10% FREE Customization
Customize This ReportPersonalize This Research
- Triangulate with your Own Data
- Get Data as per your Format and Definition
- Gain a Deeper Dive on a Specific Application, Geography, Customer or Competitor
- Any level of Personalization
Let Us Help You
- What are the Known and Unknown Adjacencies Impacting the Haptic Technology Market
- What will your New Revenue Sources be?
- Who will be your Top Customer; what will make them switch?
- Defend your Market Share or Win Competitors
- Get a Scorecard for Target Partners

Custom Market Research Services
We Will Customise The Research For You, In Case The Report Listed Above Does Not Meet With Your Requirements
Get 10% Free CustomisationTESTIMONIALS

Tetsuya Ohhira
Business Development Manager-Technology Business
Nikon Corporation,
Leading Japanese MNC specializing in optics and imaging productswww.nikon.com
MarketsandMarkets™ response
is quick. Their attitude is flexible and positive. Analyst Insights are globally considered and
significant. Client Services quickly respond to our inquiry and demand. Their wide range of global
surveys help us make our strategic plan.
We hope Knowledge Store will be easier to search
for a report.
VP - Marketing & Business Development
Leading Provider of Process Control Solutions
We engaged with MarketsandMarkets on a study to perform an analysis and recommend a Go-To-Market strategy for metrology and process control in the semiconductor market. The study was tailored to our targets and needs with well-defined milestones. Our overall experience with the MarketsandMarkets team was very good throughout the project in all aspects including the analysis methodologies used, the quality and depth of primary and secondary data sets, the professionalism and flexibility of the team and the ability to meet the target schedule and milestones. We want to thank MarketsandMarkets team for a job well done.
Growth opportunities and latent adjacency in Haptic Technology Market

Still Researching the
Haptic Technology Ecosystem?
See the competitors, opportunity evaluation, and growth signals shaping it - Instantly!
Generate 15+ consulting-grade strategic intelligence outputs - from competitor analysis to board-ready strategy decks, tailored to your Haptic Technology growth question.


Peter
May, 2016
Our company is a major player in the Haptics technology market and we would like to be included into your next report. Please contact me so I can inform you about our technology and markets. .
Satoshi
Jun, 2019
I want data about haptic technology on laptop. I want to know whether laptops with haptic technology are increasing..
Daniel
Nov, 2013
Hello, I'm considering purchasing this haptics report, however, I have a few basic questions. When you estimate the value of the haptic market (current and future), what does that valuation mean? It appears to be based off sales, but what / whose sales? What are the metrics or components of that number? .
Hyoung
Aug, 2022
I am working on new tele-haptic technologies (devices and systems) together with my research team. I would like to get your market analysis report which will be valuable to forecast this field near future. I would also like to keep contacting with you for potential collaboration with you. Thank you very much. .
Morgan
Jun, 2015
I'm interested in this market and where it's headed. Looking for a good view of that..
Xiqi
Feb, 2019
We are doing some research about haptic technology and we would like to ask for a sample of your report..
Audrey
Dec, 2015
Need information on the market dynamics and size among major Haptics players including the joint development, agreements, partnership, etc..
jessica
Sep, 2018
Need information on regional segment forecast. I saw the circle charts in the preview. .
Mira
Jul, 2019
I'm curious how you calculate total Haptic Market. What segments it is composed of? .
Laura
May, 2018
We are interested in haptic (Tactile) feedback given to the user in healthcare applications specifically..
Nina
May, 2018
Hello, I am particularly interested in some solutions proposed on the market, and mainly high level market data to understand �how� big is this market and is there a potential for polystyrene products. .
Bex
Apr, 2017
I'm writing a story for Medium's new science and tech vertical about the future of haptic and other technologies. Do you offer press copies of these reports?.
Eli
Apr, 2026
What key factors should buyers evaluate when selecting haptic technology providers�performance, customization, cost, or ecosystem support?.
Jose
Apr, 2026
How will convergence with AI, AR/VR, and spatial computing influence the future demand for haptic technologies?.
Jeremy
Apr, 2014
I'd like to get clarification on what is meant by haptic. Does this report only look at touchscreens that produce some type of physical feedback, e.g. vibration, when touched?.
Francois
Mar, 2015
Realizing my PhD in haptic technology, this document will illustrate the industrial interest in this field of technology..