
Micro-Electro-Mechanical System (MEMS) Market Size, Share and Trends

Micro-Electro-Mechanical System (MEMS) Market Size, Share and Trends by Sensor Type (Inertial Sensor, Pressure Sensor, Environmental Sensor, Optical Sensor), Actuator Type (Optical, Microfluidics, Inkjet Head, Radio Frequency), Vertical and Region - Global Forecast to 2030


Micro-Electro-Mechanical System (MEMS) Market Size, Share & Trends
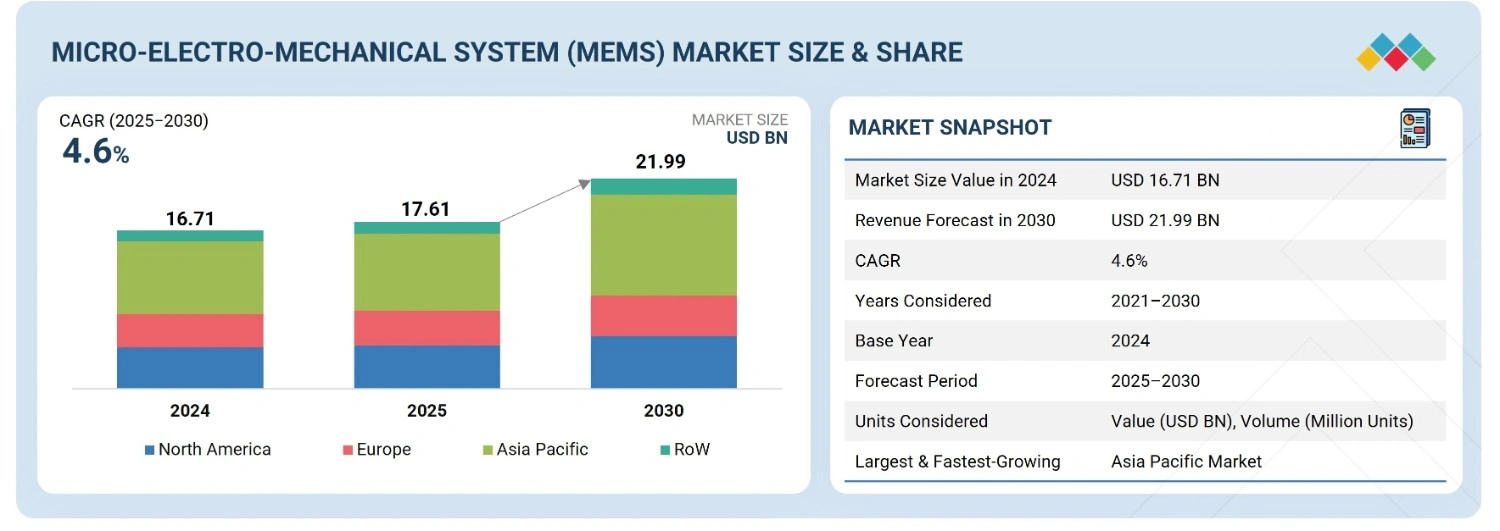
According to Marketsandmarkets, the global micro-electro-mechanical system (MEMS) market size is projected to grow from USD 17.61 billion in 2025 to USD 21.99 billion by 2030, at a CAGR of 4.6%. One of the key factors propelling the MEMS market is the growing adoption of Internet of Things (IoT) technology in sectors like consumer electronics, healthcare, automotive, and industrial automation. Sensors are essential to IoT applications as they allow for real-time data collection and monitoring. IoT solutions rely on sensors to capture real-time data and monitor the same. Sensors based on MEMS offer the compactness, power efficiency, and sensitivity required for these operations. With increasing numbers of devices, there is increasing demand for MEMS accelerometers, gyroscopes, pressure sensors, and microphones. This widespread application of MEMS in IoT-enabled systems is significantly accelerating market growth and innovation in the industry.
MARKET SNAPSHOT TABLE
| REPORT METRIC | DETAILS |
|---|---|
| Market Size Value in 2025 | USD 17.61 Billion |
| Revenue Forecast in 2030 | USD 21.99 Billion |
| Growth Rate | CAGR of 4.6% from 2025-2030 |
| Years Considered | 2021-2024 |
| Base Year | 2024 |
| Forecast Period | 2025-2030 |
| Units Considered | Value (USD Billion) and Volume (Million Units) |
| Report Coverage | Revenue forecast, company ranking, competitive landscape, growth factors, and trends |
| Top Companies |
|
| Growth Driver |
|
| Segments Covered | By Sensor Type: Inertial sensors, pressure sensors, microphones, microspeakers, environmental sensors, optical sensors, and others; By Actuator Type: Optical, microfluidics, inkjet head, and RF (Radio frequency); By Vertical: Automotive, consumer electron |
| Regional Scope | North America, Europe, Asia Pacific, and RoW |
Market Size & Forecast
KEY TAKEAWAYS
-
BY SENSOR TYPEBy sensor type, the MEMS market includes inertial sensors, pressure sensors, microphones, microspeakers, environmental sensors, optical sensors, and others. The inertial sensors segment is expected to account for the largest market share in the MEMS market due to their widespread use in smartphones, automotive systems, wearables, and industrial applications for motion detection and navigation.
-
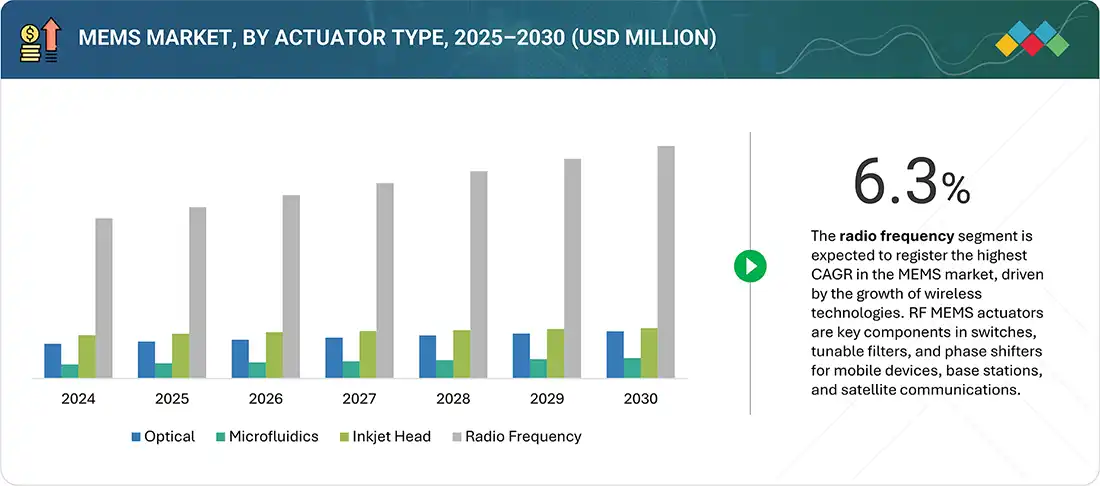
BY ACTUATOR TYPEBy actuator type, the MEMS market includes optical, microfluidics, inkjet head and RF (Radio frequency). The radio frequency segment is projected to record the highest CAGR in the overall MEMS market during the forecast period. This is driven by the rapid expansion of wireless communication technologies.
-
BY VERTICALBy vertical, the micro-electro-mechanical system (MEMS) market is segmented into automotive, consumer electronics, defense, aerospace, industrial, healthcare, telecom, and others. The consumer electronics segment account for the largest share due to their widespread use in smartphones, automotive systems, wearables, and industrial applications for motion detection and navigation.
-
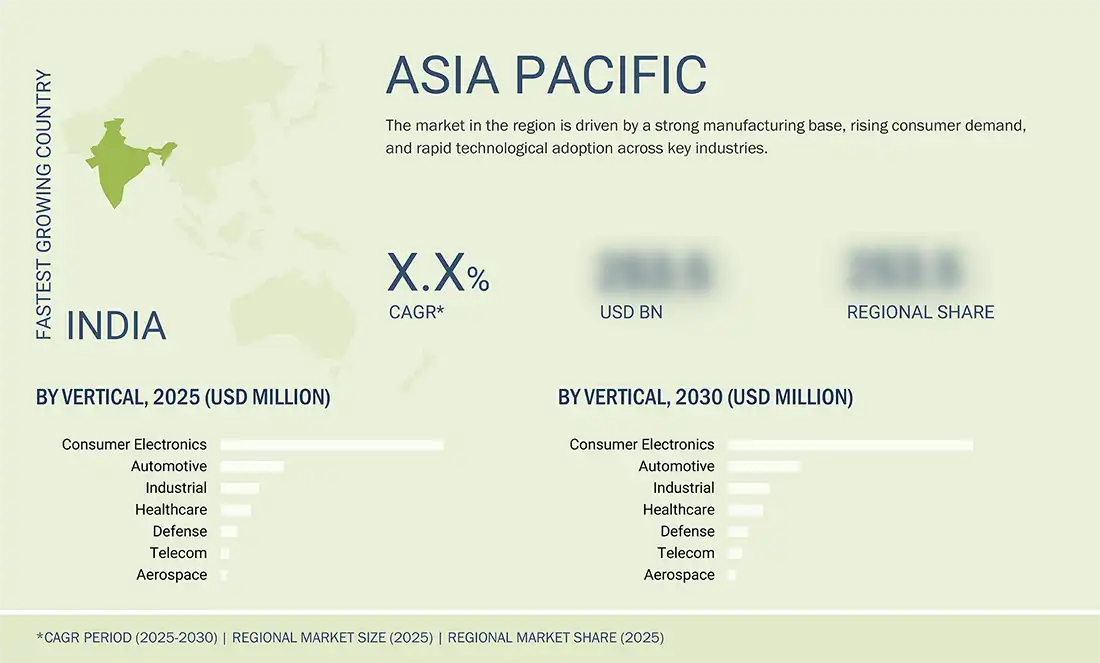
BY REGIONAsia Pacific is projected to register the highest CAGR of 5.4% during the forecast period, fueled by a strong manufacturing base, rising consumer demand, and rapid technological adoption across key industries.
-
COMPETITIVE LANDSCAPEThe major market players have adopted both organic and inorganic strategies, including partnerships and investments. For instance, Robert Bosch GmbH and Broadcom have entered into a number of agreements and partnerships to cater to the growing demand for MEMS across innovative applications.
The micro-electro-mechanical system (MEMS) market share is projected to grow rapidly over the next decade. One of the key factors propelling the MEMS market is the growing adoption of Internet of Things (IoT) technology in sectors like consumer electronics, healthcare, automotive, and industrial automation. Sensors are essential to IoT applications as they allow for real-time data collection and monitoring.
Source: Secondary Research, Interviews with Experts, MarketsandMarkets Analysis
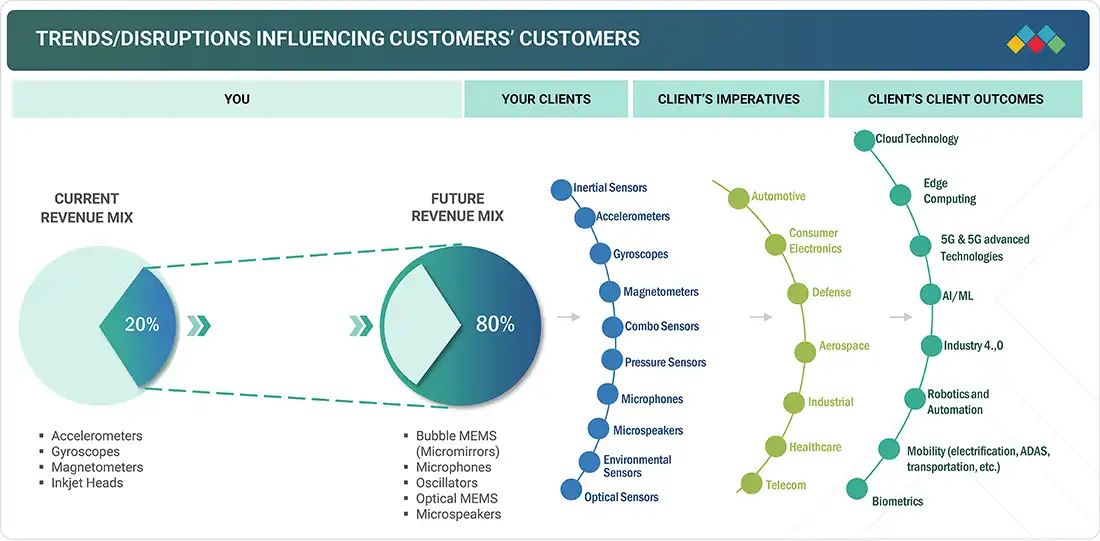
TRENDS & DISRUPTIONS IMPACTING CUSTOMERS' CUSTOMERS
The disruptions and emerging trends impacting customers’ businesses in the MEMS market trends include the growing demand for MEMS in the consumer electronics, healthcare, automotive, and telecom industries.
Source: Secondary Research, Interviews with Experts, MarketsandMarkets Analysis
MARKET DYNAMICS
Level
-
Rising demand for connected devices with advent of IoT

-
Growing focus on improving business and enterprise customer engagement

Level
-
High capital investment

-
Lack of standardized fabrication process technologies

Level
-
Implementation of sensor fusion technology in various industries

-
Flexibility to meet specific requirements of different applications

Level
-
Shortage of skilled designers

Source: Secondary Research, Interviews with Experts, MarketsandMarkets Analysis
Driver: Proliferation of IoT devices and smart home technologies
The rapid proliferation of IoT devices and smart home technologies is a key driver for MEMS sensor adoption. Wearables like smartwatches, fitness trackers, and health monitors rely on accelerometers and heart rate sensors for real-time tracking of activity, vitals, and sleep, supporting the rising demand for continuous personal monitoring. Companies such as Noise are also integrating MEMS microphones for enhanced audio, aligning with the shift toward multifunctional wearables. Beyond wearables, MEMS sensors power smart home applications in security, environmental monitoring, and energy management, making them central to convenience, efficiency, and safety in connected living
Restraint: Lack of standardized fabrication process technologies
A major restraint for the micro-electro-mechanical system (MEMS) market is the lack of standardized fabrication processes. Unlike the semiconductor industry, MEMS production uses diverse materials, designs, and customized steps such as etching and bonding, making uniformity difficult. This limits economies of scale, raises costs, and complicates outsourcing, testing, and quality assurance. The absence of standardization also leads to inconsistent yields and supply chain inefficiencies, posing challenges for mass-market applications like wearables, IoT, and smart homes where scalability and cost efficiency are critical
Opportunity: Implementation of sensor fusion technology in various industries
The growing adoption of sensor fusion technology across industries is opening major opportunities for the MEMS market. By integrating data from multiple sensors, sensor fusion delivers more accurate and reliable insights, enabling advanced applications in automotive, consumer electronics, healthcare, and industrial automation. For instance, it powers ADAS and autonomous driving, enhances motion tracking and gesture recognition in smartphones and wearables, and supports predictive maintenance in smart manufacturing. Coupled with AI and edge computing, sensor fusion is boosting device intelligence and efficiency, expanding MEMS applications across diverse sectors.
Challenge: Shortage of skilled designers
The micro-electro-mechanical system (MEMS) market faces a major challenge due to the shortage of skilled designers and engineers with expertise in microscale mechanical-electrical integration. MEMS design demands multidisciplinary knowledge in materials science, microfabrication, mechanical engineering, and circuit design, along with proficiency in specialized CAD and simulation tools. However, academic and training programs have not kept pace with industry growth, creating a talent gap that slows innovation, extends development cycles, and raises R&D costs. Smaller firms are especially impacted, making talent development crucial for sustaining long-term MEMS growth and competitiveness.
Micro-Electro-Mechanical System (MEMS) Market: COMMERCIAL USE CASES ACROSS INDUSTRIES
| COMPANY | USE CASE DESCRIPTION | BENEFITS |
|---|---|---|
 |
MEMS motion sensors, microphones, and environmental sensors for automotive, consumer electronics, and IoT devices | High reliability, precision, and scalability; supports automotive safety, smart devices, and energy-efficient solutions |
 |
RF-MEMS filters and specialty MEMS solutions for wireless communication, mobile devices, and infrastructure | Delivers high-performance connectivity, low power consumption, and efficient integration for advanced mobile and 5G applications |
 |
RF MEMS filters and sensing technologies for smartphones, IoT devices, industrial systems, and defense applications | Provides compact, cost-effective, and high-quality RF solutions; ensures compatibility with diverse IoT and industrial platforms |
 |
MEMS accelerometers, gyroscopes, magnetometers, and microphones for smartphones, AR/VR, automotive, and healthcare | Enables miniaturization, design flexibility, and low-power operation; widely adopted in consumer electronics and automotive safety systems |
 |
MEMS-based sensors and components for automotive, industrial automation, and IoT ecosystems | Offers robust performance, precision, and scalability; supports next-generation automotive safety, smart industry, and IoT integration |
Logos and trademarks shown above are the property of their respective owners. Their use here is for informational and illustrative purposes only.
MARKET ECOSYSTEM
The MEMS ecosystem includes material suppliers, foundries and design houses, device manufacturers, packaging companies, nonprofit organizations, research centers and academic government institutes, end users, and government and regulatory bodies.
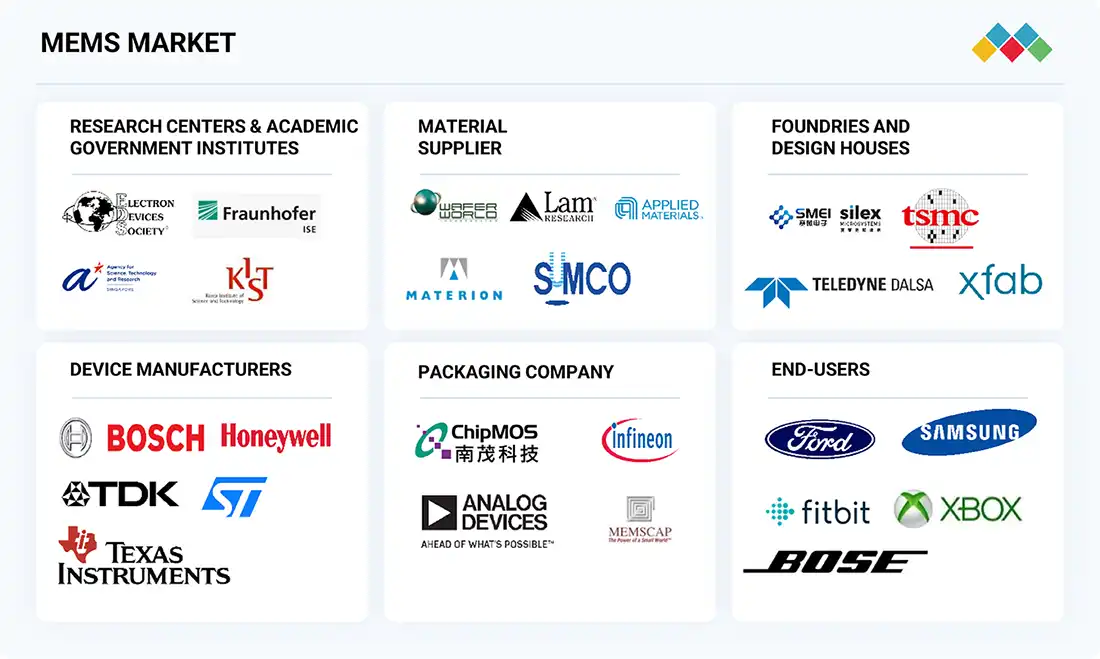
Logos and trademarks shown above are the property of their respective owners. Their use here is for informational and illustrative purposes only.
MARKET SEGMENTS
Source: Secondary Research, Interviews with Experts, MarketsandMarkets Analysis
MEMS Market, By Sensor Type
The inertial sensors segment is estimated to account for the largest share of the overall micro-electro-mechanical system (MEMS) market during the forecast period, driven by their widespread adoption across diverse applications. Inertial sensors, which include accelerometers and gyroscopes, are essential for measuring motion, orientation, and acceleration in real time. These sensors are integral to numerous high-growth sectors such as consumer electronics, automotive, aerospace, healthcare, and industrial automation. In consumer electronics, inertial sensors are widely used in smartphones, wearable devices, gaming consoles, and AR/VR systems to enhance user interaction through motion tracking and gesture recognition.
MEMS Market, By Actuator Type
The radio frequency segment is projected to record the highest CAGR in the overall micro-electro-mechanical system market during the forecast period. This is driven by the rapid expansion of wireless communication technologies. RF MEMS actuators are critical components in RF switches, tunable filters, and phase shifters used in mobile devices, base stations, and satellite communication systems. These actuators enhance signal performance by enabling low insertion loss, high linearity, and improved power efficiency. With the global rollout of 5G networks and the ongoing demand for higher data transmission speeds, there is a growing need for miniaturized, high-frequency components that can support multiple communication bands.
MEMS Market, By Vertical
Based on vertical, the telecom segment is expected to witness highest the CAGR in the MEMS market during the forecast period. This growth is fuelled by the global expansion of 5G networks, increasing demand for high-speed data transmission, and the need for efficient RF components. MEMS devices such as RF switches, filters, and resonators enhance signal integrity, reduce power consumption, and support multi-band operations. As telecom infrastructure becomes more advanced and compact, the integration of MEMS technology is becoming increasingly critical.
REGION
Asia Pacific to be fastest-growing region in global MEMS market during forecast period
Asia Pacific is expected to record the highest CAGR in the global micro-electro-mechanical system (MEMS) industry during the forecast period, driven by a strong manufacturing base, rising consumer demand, and rapid technological adoption across key industries. Countries such as China, Japan, South Korea, and Taiwan are global hubs for electronics production and innovation, particularly in consumer electronics, automotive, and industrial automation.
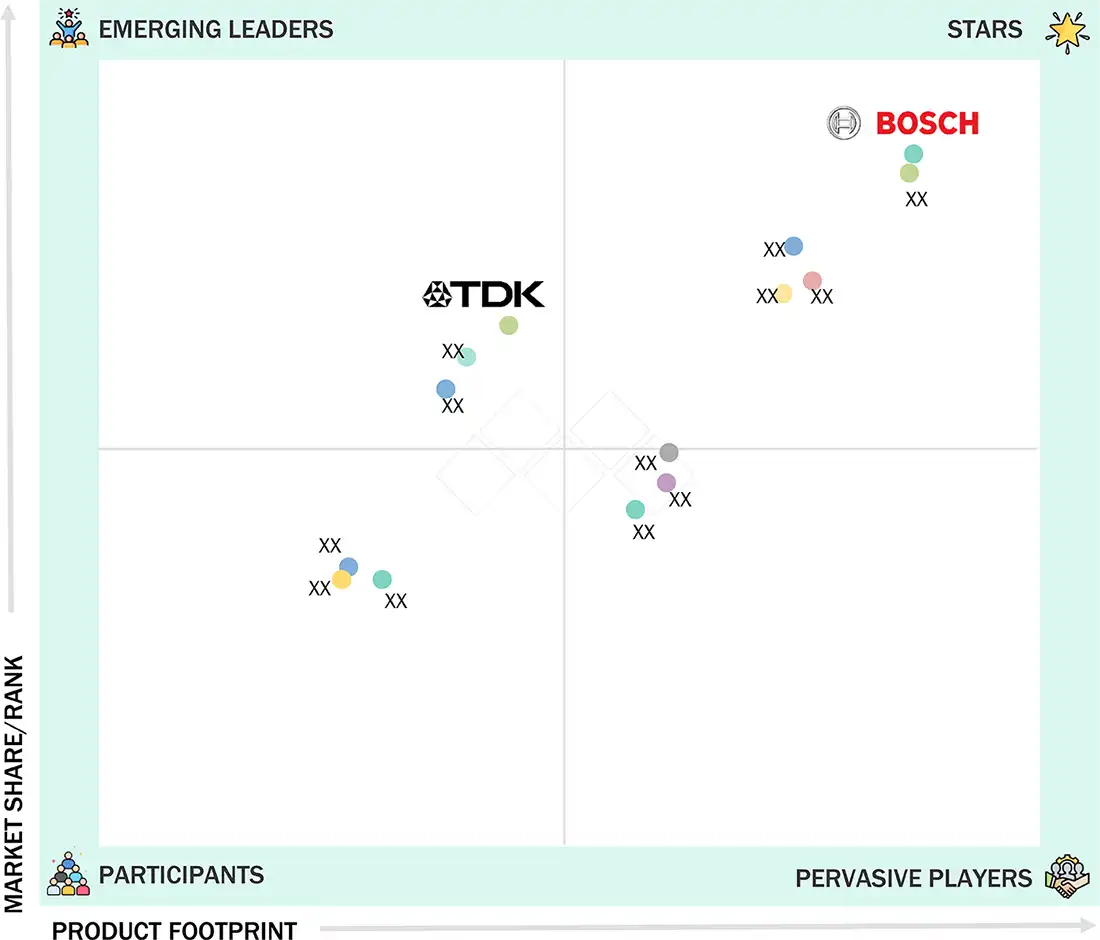
Micro-Electro-Mechanical System (MEMS) Market: COMPANY EVALUATION MATRIX
In the MEMS companies matrix, Robert Bosch GmbH (Germany) leads with established product portfolio and a robust market presence. TDK Corporation (Japan) (Emerging Leader) is steadily gaining traction with focused product portfolios and powerful growth strategies. While Robert Bosch GmbH is maintaining its position through scale and established customer base, TDK Corporation demonstrates solid growth potential to advance toward the leaders’ quadrant.
Source: Secondary Research, Interviews with Experts, MarketsandMarkets Analysis
KEY MARKET PLAYERS
WHAT IS IN IT FOR YOU: Micro-Electro-Mechanical System (MEMS) Market REPORT CONTENT GUIDE
DELIVERED CUSTOMIZATIONS
We have successfully delivered the following deep-dive customizations:
| CLIENT REQUEST | CUSTOMIZATION DELIVERED | VALUE ADDS |
|---|---|---|
| MEMS Market Supplier Landscape | Broad identification of leading and emerging suppliers | Emphasis on supplier agility, potential partnerships, and future innovation focus |
RECENT DEVELOPMENTS
- March 2025 : Texas Instruments Incorporated introduced the smallest MCU (microcontroller), enabling innovation in the tiniest of applications. The new MCU is 38% smaller than the industry's current smallest MCU and enables designers to minimize board space without compromising performance. The new MCU expands TI's MSPM0 MCU portfolio, which enhances sensing and control in embedded systems while shrinking cost, complexity, and design time.
- January 2024 : At the Consumer Electronics Show (CES) 2024, Goertek Inc. unveiled cutting-edge technologies in acoustics, optics, and electronics, targeting advancement in consumer electronics. Goertek Microelectronics showcased a range of compact, high-performance sensors, including 3D ToF sensors with miniaturized packaging, enhancing device portability and functionality.
- January 2024 : Robert Bosch GmbH introduced the BMA530 and BMA580, one of the world's smallest MEMS accelerometers tailored for wearables and hearables. The BMA530 offers step tracking for wearables, featuring built-in features for easy implementation, while the BMA580 focuses on voice activity detection for hearables
- January 2024 : Sphere Entertainment Co. collaborated with STMicroelectronics to develop the world's largest image sensor for their Big Sky camera system, capturing content for Sphere's immersive entertainment medium in Las Vegas. The groundbreaking 18K sensor enables ultra-high-resolution imagery for the massive LED screen, enhancing audience experiences.
- October 2023 : Semtech and Broadcom collaborated on a 200G/lane optical transceiver showcased at ECOC 2023. Utilizing Semtech's FiberEdge 200G PAM4 Quad EML Driver and Broadcom's 5nm 112GBd PAM4 DSP, EML, and PD DSP PHY, the collaboration advances optical module technology, enabling bandwidths up to 1.6Tbps for the next gen switching platforms.
Table of Contents
 Exclusive indicates content/data unique to MarketsandMarkets and not available with any competitors.
Methodology
The study involved major activities in estimating the current size of the MEMS market. Exhaustive secondary research was done to collect information on MEMS. The next step was to validate these findings, assumptions, and sizing with industry experts across the value chain using primary research. Different approaches, such as top-down and bottom-up, were employed to estimate the total market size. After that, the market breakup and data triangulation procedures were used to estimate the market size of the segments and subsegments of the MEMS.
Secondary Research
In the secondary research process, various sources were referred to identify and collect information important for this study. Secondary sources included corporate filings, such as annual reports, investor presentations, and financial statements; trade, business, and professional associations; white papers, MEMS technology-related journals, certified publications; articles by recognized authors; directories; and databases.
Secondary research was conducted to obtain key information regarding the industry supply chain, market value chain, the total pool of key players, market classification and segmentation according to industry trends to the bottom-most level, geographic markets, and key developments from market and technology-oriented perspectives. Data from secondary research was collected and analyzed to determine the overall market size, which was further validated by primary research.
Primary Research
Extensive primary research was accomplished after understanding and analyzing the MEMS market scenario through secondary research. Several primary interviews were conducted with key opinion leaders from demand- and supply-side vendors across four major regions—North America, Europe, Asia Pacific, and RoW. Approximately 30% of the primary interviews were conducted with the demand side and 70% with the supply side. Primary data was collected through questionnaires, emails, and telephonic interviews. In our canvassing of primaries, we have strived to cover various departments within organizations, such as sales, operations, and administration, to provide a holistic viewpoint in the report.
 Market Size, and Share")
Note: RoW includes the Middle East, Africa, and South America. Other designations include product managers, sales managers, and marketing managers. The 3 tiers of the companies are defined based on their total revenue as of 2023; tier 1 = >USD 1 billion, tier 2 = USD 10 million – USD 1 billion, and tier 3 = USD 10 million.
To know about the assumptions considered for the study, download the pdf brochure
Market Size Estimation
In the complete market engineering process, both top-down and bottom-up approaches have been used, along with several data triangulation methods, to estimate and forecast the size of the market and its segments and subsegments listed in the report. Extensive qualitative and quantitative analyses have been carried out on the complete market engineering process to list the key information/insights pertaining to the MEMS market.
The key players in the market have been identified through secondary research, and their rankings in the respective regions have been determined through primary and secondary research. This entire procedure involved the study of the annual and financial reports of top players and interviews with industry experts, such as chief executive officers, vice presidents, directors, and marketing executives, for quantitative and qualitative insights. All percentage shares, splits, and breakdowns have been determined using secondary sources and verified through primary sources. All parameters that affect the markets covered in this research study have been accounted for, viewed in extensive detail, verified through primary research, and analyzed to obtain the final quantitative and qualitative data. This data has been consolidated and enhanced with detailed inputs and analysis from MarketsandMarkets and presented in this report.
Micro-Electro-Mechanical System (MEMS) Market : Top-Down and Bottom-Up Approach
 Market Top Down and Bottom Up Approach")
Data Triangulation
After arriving at the overall market size from the market size estimation process explained earlier, the total market was split into several segments and subsegments. Where applicable, data triangulation and market breakdown procedures have been applied to complete the overall market engineering process and arrive at the exact statistics for all segments and subsegments. The data has been triangulated by studying various factors and trends from both the demand and supply sides. Along with this, the MEMS market has been validated using both top-down and bottom-up approaches.
Market Definition
MEMS (micro-electro-mechanical system) is a miniature machine with mechanical and electronic components. It consists of mechanical microstructures, microsensors, microactuators, and microelectronics, all integrated into the same silicon chip. MEMS has feature sizes ranging from micrometers to millimeters. These devices can vary from simple structures with no moving elements to extremely complex electromechanical microsystems with several moving elements under the control of integrated microelectronics.
The market includes first-level packaged MEMS devices (sensors and actuators) sold by IDMs and fabless companies to OEMs/integrators.
Key Stakeholders
- Raw material and manufacturing equipment suppliers
- Electronic design automation (EDA) and design tool vendors
- Wafer manufacturers
- Government bodies, venture capitalists, and private equity firms
- Integrated device manufacturers (IDMs)
- Owners of intellectual property related to MEMS components
- MEMS technology platform developers
- MEMS component manufacturers
- Maintenance and service providers
- Distributors and traders
- Research organizations
- Semiconductor Foundry Service Provider
- Organizations, forums, alliances, and associations
- End-users from verticals, such as aerospace, defense, industrial, and consumer electronics, among others.
Report Objectives
- To describe and forecast the micro-electro-mechanical system (MEMS) market size, by sensor type, actuator type, and vertical, in terms of value
- To forecast the market size, in terms of value, across North America, Europe, Asia Pacific, and the RoW
- To describe and forecast the MEMS market size, by sensor type and actuator type, in terms of volume
- To present detailed information regarding the major factors influencing the growth of the market (drivers, restraints, opportunities, and challenges)
- To provide an analysis of the market ecosystem, case studies, patents, technologies, average selling price, Porter’s five forces, and regulations pertaining to the market.
- To offer a comprehensive overview of the value chain of the MEMS market ecosystem
- To critically analyze micromarkets with respect to individual growth trends, prospects, and contributions to the total market
- To strategically profile the key players and comprehensively analyze their market shares and core competencies.
- To assess the opportunities in the market for stakeholders and describe the competitive landscape of the market
- To analyze competitive developments such as collaborations, acquisitions, partnerships, and product developments in the market
- To analyze the impact of AI/GenAI and the 2025 US tariff and the macroeconomic outlook for each region in the MEMS market
Available customizations:
With the market data given, MarketsandMarkets offers customizations according to the company’s specific needs. The following customization options are available for the report:
Company Information:
- Detailed analysis and profiling of additional market players (up to 7)
Key Questions Addressed by the Report
What is the current size of the MEMS Market?
The global MEMS (Micro-Electro-Mechanical Systems) market is valued at USD 17.61 billion in 2025 and is projected to reach USD 21.99 billion by 2030.
What is the expected CAGR of the MEMS Market during the forecast period?
The MEMS market is expected to grow at a CAGR of 4.6% from 2025 to 2030, driven by increasing adoption of IoT devices, smart electronics, and industrial automation.
What are the key growth drivers of the MEMS Market?
Major growth drivers include the proliferation of IoT devices, growing demand for miniaturized sensors, expansion of smart home technologies, wearable devices, automotive electronics, and industrial automation systems.
Which sensor type holds the largest share in the MEMS Market?
The Inertial Sensors segment is expected to account for the largest market share due to widespread use in smartphones, wearables, automotive safety systems, AR/VR devices, and industrial applications.
Which actuator segment is expected to grow the fastest?
The Radio Frequency (RF) MEMS segment is projected to register the highest CAGR due to increasing deployment in 5G infrastructure, wireless communication systems, RF switches, tunable filters, and satellite communications.
Which industry vertical is expected to witness the highest growth?
The Telecom sector is expected to grow at the highest CAGR owing to rapid 5G deployment, increasing data traffic, and demand for advanced RF MEMS components.
Which region is expected to be the fastest-growing MEMS market?
Asia Pacific is expected to register the highest CAGR during the forecast period, driven by strong electronics manufacturing ecosystems in China, Japan, South Korea, and Taiwan.
Who are the leading companies operating in the MEMS Market?
Key market players include Robert Bosch GmbH, Broadcom, Qorvo, Inc., STMicroelectronics, and Texas Instruments Incorporated.
What are the major trends shaping the MEMS industry?
Key trends include integration of MEMS in 5G networks, sensor fusion technology, growth of wearable electronics, expansion of industrial IoT, miniaturization of electronic devices, and increasing demand for low-power sensors.
What opportunities and challenges exist in the MEMS Market?
Major opportunities include the implementation of sensor fusion technologies and expansion of smart devices, while challenges include a shortage of skilled MEMS designers and complex manufacturing processes.
Need a Tailored Report?
Customize this report to your needs
Get 10% FREE Customization
Customize This ReportPersonalize This Research
- Triangulate with your Own Data
- Get Data as per your Format and Definition
- Gain a Deeper Dive on a Specific Application, Geography, Customer or Competitor
- Any level of Personalization
Let Us Help You
- What are the Known and Unknown Adjacencies Impacting the Micro-Electro-Mechanical System (MEMS) Market
- What will your New Revenue Sources be?
- Who will be your Top Customer; what will make them switch?
- Defend your Market Share or Win Competitors
- Get a Scorecard for Target Partners

Custom Market Research Services
We Will Customise The Research For You, In Case The Report Listed Above Does Not Meet With Your Requirements
Get 10% Free CustomisationTESTIMONIALS

Tetsuya Ohhira
Business Development Manager-Technology Business
Nikon Corporation,
Leading Japanese MNC specializing in optics and imaging productswww.nikon.com
MarketsandMarkets™ response
is quick. Their attitude is flexible and positive. Analyst Insights are globally considered and
significant. Client Services quickly respond to our inquiry and demand. Their wide range of global
surveys help us make our strategic plan.
We hope Knowledge Store will be easier to search
for a report.
VP - Marketing & Business Development
Leading Provider of Process Control Solutions
We engaged with MarketsandMarkets on a study to perform an analysis and recommend a Go-To-Market strategy for metrology and process control in the semiconductor market. The study was tailored to our targets and needs with well-defined milestones. Our overall experience with the MarketsandMarkets team was very good throughout the project in all aspects including the analysis methodologies used, the quality and depth of primary and secondary data sets, the professionalism and flexibility of the team and the ability to meet the target schedule and milestones. We want to thank MarketsandMarkets team for a job well done.
Growth opportunities and latent adjacency in Micro-Electro-Mechanical System (MEMS) Market


Blake
Apr, 2026
Does the report include both sensors and actuators comprehensively?.
Paul
Apr, 2026
What are the most attractive investment pockets in the MEMS market?.
Hernan
Jan, 2019
Good day, I have send this request to know more analysis data for study the trends for MEMS Market..
Dragan
Apr, 2019
I need the information about MEMS market to make an investment for manufacturing MEMS-based devices..