
Security Solutions Market Size, Share & Trends, 2025

Security Solutions Market by System (Fire Protection, Video Surveillance, Multi-technology Reader, Biometric Reader, Electronic Lock, Entrance Control, Intruder Alarm, Thermal Imaging), Service (Remote Monitoring, VSaaS, ACaaS) - Global Forecast to 2030


OVERVIEW
Source: Secondary Research, Interviews with Experts, MarketsandMarkets Analysis
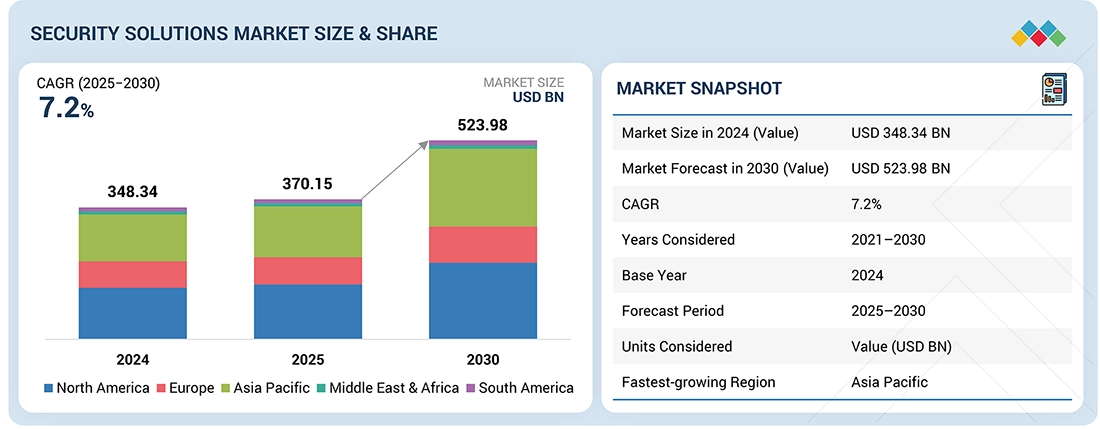
The global security solutions market is expected to grow from USD 370.15 billion in 2025 to USD 523.98 billion by 2030 at a CAGR of 7.2% during the forecast period. The need to safeguard people, assets, and infrastructure is driving businesses, governments, and institutions to adopt more surveillance systems, access controls, alarm systems, and integrated security technologies. This demand is further fueled by urbanization, the rise of smart cities, and growing public safety concerns, while innovations in AI and IoT continue to improve the efficiency and capabilities of security solutions.
KEY TAKEAWAYS
-
BY SYSTEMThe system segment includes fire protection system, video surveillance system, access control system, entrance control system, intruder alarm system, and thermal Imaging system. The demand for video surveillance systems in security solutions is driven by rising concerns over crime, theft, and public safety, as well as the need for real-time monitoring and evidence collection.
-
BY SERVICESThe services segment is bifurcated into fire protection services, video surveillance services, access control services, security system integration services, remote monitoring services. The demand for security system integration services is driven by the need for centralized control, improved efficiency, and seamless coordination between multiple security components such as surveillance, access control, alarms, and fire detection
-
BY VERTICALThe vertical is segmented into residential, commercial, government, transportation, retail, banking and finance, education, industrial, energy and utilities, sports and leisure, healthcare, militry and defense. The demand for security solutions in residential settings is growing due to increasing concerns about home burglaries, personal safety, and property protection.
-
BY REGIONAsia Pacific leads the growth in security solutions due to rapid urbanization, expanding infrastructure, and increasing investments in smart cities and technology.
-
COMPETITIVE LANDSCAPEMajor market players have adopted both organic and inorganic strategies, including partnerships and investments. For instance, Emerson Johnson Controls, and Honeywell International Inc. have introduced new security systems.
Security solutions industry are tools and systems designed to protect people, property, and information from threats like theft, unauthorized access, or harm. Industries use them in various ways—retail stores install surveillance and alarm systems, healthcare facilities secure patient data and control access, and manufacturing plants use perimeter security to protect assets. These solutions help reduce risk, ensure safety, and maintain operational integrity across sectors.
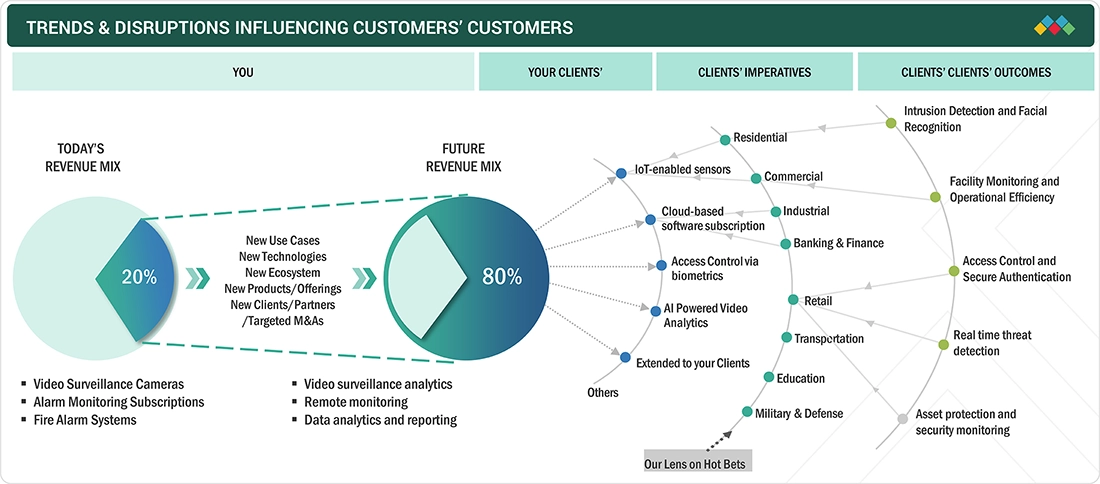
TRENDS & DISRUPTIONS IMPACTING CUSTOMERS' CUSTOMERS
The impact on consumers’ business emerges from customer trends or disruptions. Hot belts are the clients of security solutions providers, and target applications are the clients of security solutions providers. Shifts, which are changing trends or disruptions, will impact the revenues of end users. The revenue impact on end users will affect the revenue of hotbeds, which will further affect the revenues of security solutions providers.
Source: Secondary Research, Interviews with Experts, MarketsandMarkets Analysis
MARKET DYNAMICS
Level
-
Increasing concerns regarding public safety and infrastructure protection

-
Rapid adoption of AI-powered surveillance and biometric access control is redefining global security standards

Level
-
Concerns over privacy and data protection regulations

-
Risk of system vulnerabilities and exploits

Level
-
Increasing demand for remote monitoring and surveillance solutions

-
Growing adoption of cloud-based security solutions

Level
-
Risk of rapid technological changes and obsolescence

-
Complex regulatory landscape and compliance challenges

Source: Secondary Research, Interviews with Experts, MarketsandMarkets Analysis
Driver: Rapid adoption of AI-powered surveillance and biometric access control is redefining global security standards
AI-powered surveillance and biometric access control are rapidly transforming the security solutions market by enabling smarter, faster, and more accurate threat detection and access management. These technologies are replacing traditional systems with advanced, data-driven tools that enhance security, reduce human error, and set new industry standards for safety and efficiency.
Restraint:Risk of system vulnerabilities and exploits
As AI-powered surveillance and biometric access systems become more connected and data-driven, they also become potential targets for cyberattacks. People can exploit software flaws, network weaknesses, or improperly secured data to gain unauthorized access, disable systems, or steal sensitive biometric information. Such vulnerabilities not only undermine the effectiveness of the security infrastructure but can also lead to significant financial, legal, and reputational damage..
Opportunity: Increasing demand for remote monitoring and surveillance solutions
As organizations expand their operations across multiple locations and adopt more flexible work models, the need for centralized, real-time oversight has grown significantly. Remote monitoring systems, powered by AI and cloud technologies, allow security teams to access live feeds, receive alerts, and manage incidents from virtually anywhere. This not only enhances situational awareness and response times but also reduces the need for on-site personnel, lowering operational costs.
Challenge: Complex regulatory landscape and compliance challenges
As technologies like AI surveillance and biometric access control collect and process sensitive personal data, they are subject to strict regulations such as GDPR, CCPA, and various regional cybersecurity standards. Meeting these legal requirements often involves implementing robust data governance, securing user consent, ensuring transparency, and maintaining high standards of data security..
Security Solutions Market: COMMERCIAL USE CASES ACROSS INDUSTRIES
| COMPANY | USE CASE DESCRIPTION | BENEFITS |
|---|---|---|
 |
Integrated building security systems including access control, video surveillance, and intrusion detection for commercial and institutional facilities. | Enhanced facility safety, centralized monitoring, and improved operational efficiency. |
 |
AI-powered video analytics, fire detection, and integrated alarm systems for industrial and critical infrastructure security. | Increased threat detection accuracy| Faster response times| Regulatory compliance |
 |
Comprehensive physical security solutions including video surveillance, intrusion alarms, and access control for smart cities and transportation hubs | Reliable security coverage| Scalable systems| Robust data protection |
 |
AI-driven video surveillance cameras and smart analytics for real-time threat detection and perimeter security in retail and public spaces. | High-definition monitoring| Reduced false alarms| Proactive security management |
 |
Residential and commercial security solutions including monitored alarm systems, video surveillance, and remote access control for homes and small businesses. | 24/7 professional monitoring, quick emergency response, and user-friendly remote control.. |
Logos and trademarks shown above are the property of their respective owners. Their use here is for informational and illustrative purposes only.
MARKET ECOSYSTEM
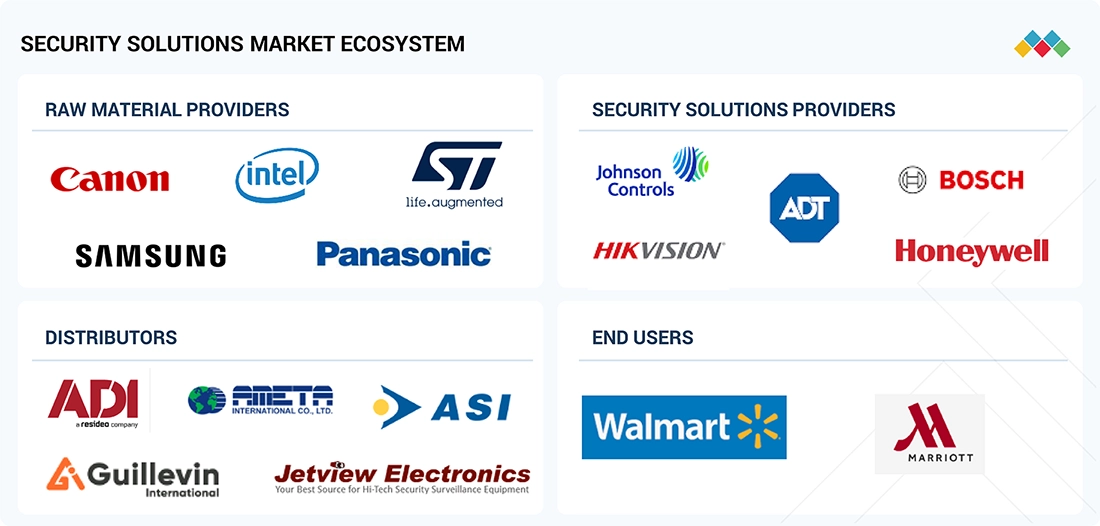
Logos and trademarks shown above are the property of their respective owners. Their use here is for informational and illustrative purposes only.
MARKET SEGMENTS

Source: Secondary Research, Interviews with Experts, MarketsandMarkets Analysis
Security Solutions Market, By System
The video surveillance system is expected to hold the largest share in the security solutions market by 2025, due to its wide application across various sectors, including commercial, industrial, and public safety. Its ability to provide real-time monitoring, enhanced threat detection through AI analytics, and comprehensive coverage makes it a preferred choice for effective security management. Additionally, advancements in high-definition cameras and remote accessibility further drive its adoption and market dominance..
Security Solutions Market, By Service
Security system integration services are expected to hold the largest share in 2025 as organizations increasingly seek seamless and centralized management of multiple security technologies. These services enable the integration of video surveillance, access control, intrusion detection, and other systems into a unified platform, enhancing operational efficiency and real-time threat response. The growing demand for customized, scalable, and intelligent security solutions across various industries is driving the rapid adoption of integration services.
Security Solutions Market, By Vertical
The commercial vertical is expected to grow the fastest in the security solutions market due to rising security concerns in offices, retail stores, and hospitality sectors. Increasing investments in advanced surveillance, access control, and intrusion detection systems to protect assets, employees, and customers are driving this growth. Additionally, the adoption of smart building technologies and regulatory compliance requirements are further accelerating security upgrades in commercial spaces..
REGION
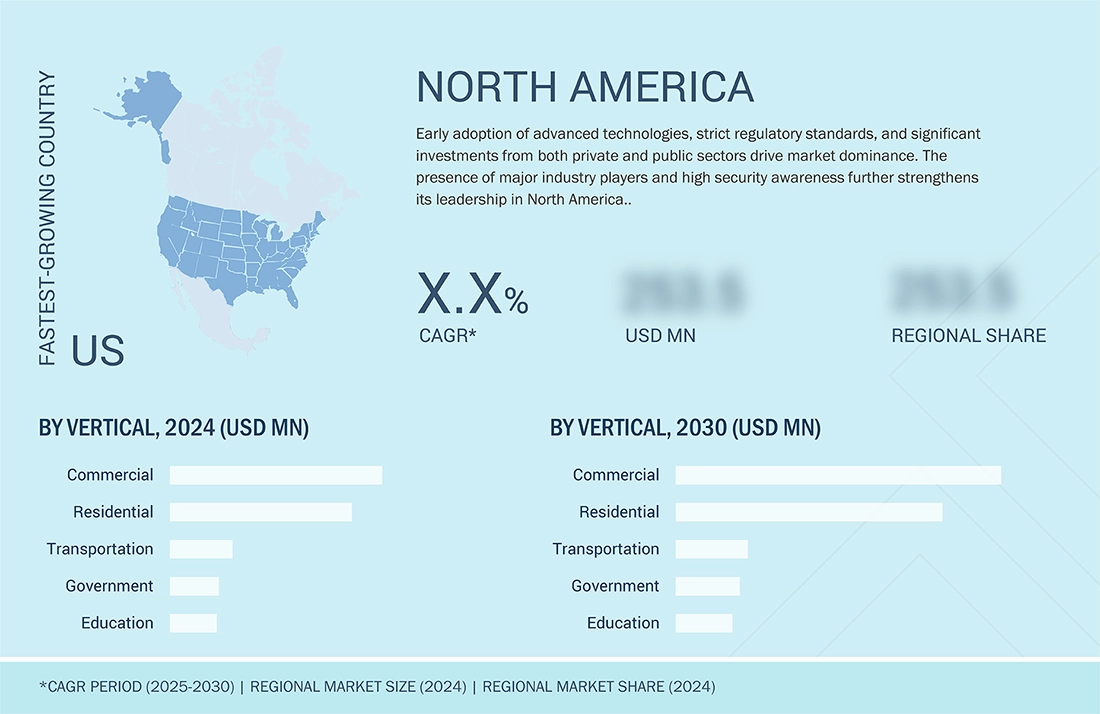
North America to hold the largest market share in the global security solutions market during the forecast period
North America holds the largest share in the security solutions market, driven by early adoption of advanced technologies like AI-powered surveillance and biometric access control. Strong regulatory frameworks, high security awareness, and substantial investments by government and private sectors further boost market growth. Additionally, the presence of major security solution providers and increasing demand across commercial, residential, and critical infrastructure segments contribute to the region’s dominance.
The North American security solutions market is projected to grow from USD 142.9 billion in 2025 to USD 199.7 billion by 2030, at a CAGR of 6.9% during the forecast period. The need to protect people, assets, and infrastructure is prompting businesses, governments, and institutions to adopt more surveillance systems, access controls, alarm systems, and integrated security technologies. This demand is further driven by urbanization, the expansion of smart cities, and increasing public safety concerns, while innovations in AI and IoT continue to enhance the efficiency and capabilities of security solutions.
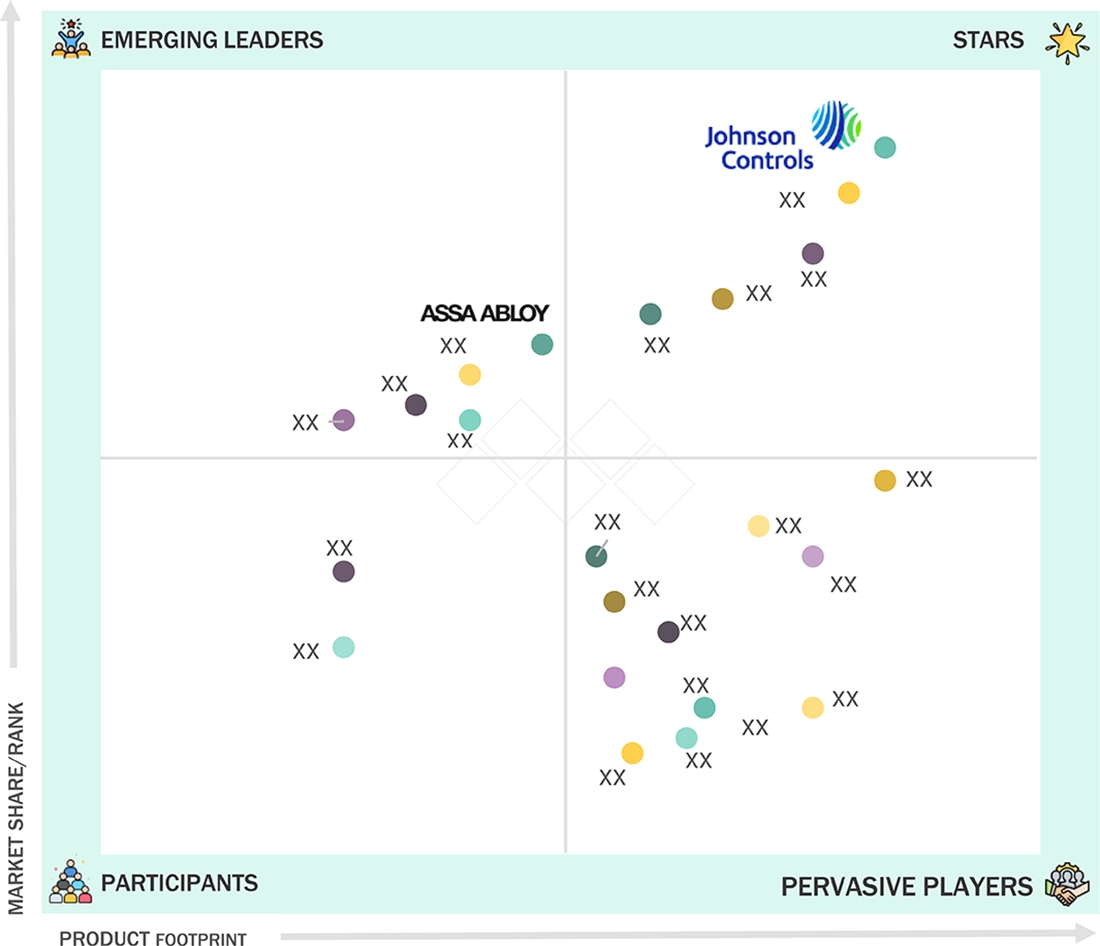
Security Solutions Market: COMPANY EVALUATION MATRIX
Johnson Controls (Star) leads with a comprehensive portfolio of integrated security systems, including access control, video surveillance, and intrusion detection, supporting applications across commercial buildings, healthcare, and education sectors. Known for its innovative technology and strong global presence, Johnson Controls has built robust customer relationships through tailored security solutions and smart building integrations. Assa Abloy (Emerging) is gaining momentum in the security space with its expanding range of advanced locking systems and biometric access control technologies for commercial and residential applications. The security solutions companies is strengthening its market position through strategic acquisitions and partnerships focused on enhancing digital security and smart access solutions.
Source: Secondary Research, Interviews with Experts, MarketsandMarkets Analysis
KEY MARKET PLAYERS
MARKET SCOPE
| REPORT METRIC | DETAILS |
|---|---|
| Market Size in 2024 (Value) | USD 348.34 Billion |
| Market Forecast in 2030 (Value) | USD 523.98 Billion |
| Growth Rate | CAGR of 7.2% from 2025-2030 |
| Years Considered | 2021–2030 |
| Base Year | 2024 |
| Forecast Period | 2025–2030 |
| Units Considered | Value (USD Million/Billion) |
| Report Coverage | Revenue forecast, company ranking, competitive landscape, growth factors, and trends |
| Segments Covered |
|
| Regional Scope | North America, Europe, Asia Pacific, Middle East, Latin America, and Africa |
WHAT IS IN IT FOR YOU: Security Solutions Market REPORT CONTENT GUIDE
DELIVERED CUSTOMIZATIONS
We have successfully delivered the following deep-dive customizations:
| CLIENT REQUEST | CUSTOMIZATION DELIVERED | VALUE ADDS |
|---|---|---|
| Market Entry Feasibility Study | Detailed analysis of target market size, growth potential, and competitive landscape for security solutions | Helps clients identify viable markets and optimize investment decisions |
| Technology Trend & Innovation Analysis | Tracking adoption rates and maturity of AI surveillance, biometric access, and cloud-based solutions. | Enables clients to align product development with emerging trends. |
| Competitive Benchmarking & Vendor Profiling |
|
|
| Customer Insights & Demand Analysis |
|
|
RECENT DEVELOPMENTS
- August 2025 : Johnson Controls launched OpenBlue Visitor, this next-generation platform replaces traditional, manual visitor management systems with a fully digital, secure, and user-friendly solution—from invitation to check-out.
- July 2025 : Hikvision announced the launch of its new DeepinView X-Series Bullet Cameras, powered by advanced Guanlan large-scale AI models. These intelligent cameras offer enhanced perimeter protection by extending video content analysis (VCA) range and significantly reducing false and redundant alarms.
- June 2025 : Honeywell announced the launch of its 50 Series CCTV product line, the company’s first-ever camera portfolio to be locally designed and manufactured.
- March 2025 : Johnson Controls unveiled PowerG+, the next evolution of its trusted PowerG technology. Building on PowerG’s robust foundation, PowerG+ introduces advanced, in-demand features designed to drive the future of security and home automation.
Table of Contents
 Exclusive indicates content/data unique to MarketsandMarkets and not available with any competitors.
Methodology
The study used four major activities to estimate the security solutions market size. Exhaustive secondary research was conducted to gather information on the market and its peer and parent markets. The next step was to validate these findings, assumptions, and market size with industry experts across the value chain through primary research. Both top-down and bottom-up approaches were employed to estimate the total market size. Finally, market breakdown and data triangulation methods were used to estimate the market size for different segments and subsegments.
Secondary Research
In the secondary research process, various sources were used to identify and collect information on the security solutions market. Secondary sources for this research study include corporate filings (such as annual reports, investor presentations, and financial statements); trade, business, and professional associations; white papers; certified publications; and articles by recognized authors, directories, and databases. The secondary data was collected and analyzed to determine the overall market size, and was further validated through primary research.
List of key secondary sources
|
Source |
Web Link |
|
Federal Communications Commission (FCC) |
https://www.fcc.gov/ |
|
National Institute of Standards and Technology (NIST) |
https://www.nist.gov/ |
|
Ministry of Electronics and Information Technology (MeitY) |
https://www.meity.gov.in/ |
|
Ministry of Industry and Information Technology (MIIT) |
https://english.miit.gov.cn/ |
|
Ministry of Internal Affairs and Communications (MIC) |
https://www.soumu.go.jp/english/ |
Primary Research
Primary interviews were conducted to gather insights on market statistics, revenue data, market breakdowns, size estimations, and forecasting. Additionally, primary research was used to comprehend various technologies, types, application, and regional trends. Interviews with stakeholders from the demand side, including CIOs, CTOs, CSOs, and customer/end user installation teams using security solutions offerings and processes, were also conducted to understand their perspective on suppliers, products, component providers, and their current and future use of security solutions, which will impact the overall market. Several primary interviews were conducted across major countries in North America, Europe, Asia Pacific, and RoW.

To know about the assumptions considered for the study, download the pdf brochure
Market Size Estimation
In the complete market engineering process, top-down and bottom-up approaches and several data triangulation methods have been used to estimate and forecast the overall market segments and subsegments listed in this report. Key players in the market have been identified through secondary research, and their market shares in the respective regions have been determined through primary and secondary research. This entire procedure includes the study of annual and financial reports of the top market players and extensive interviews for key insights (quantitative and qualitative) with industry experts (CEOs, VPs, directors, and marketing executives).
All percentage shares, splits, and breakdowns have been determined using secondary sources and verified through primary sources. All the parameters affecting the markets covered in this research study have been accounted for, viewed in detail, verified through primary research, and analyzed to obtain the final quantitative and qualitative data. This data has been consolidated and supplemented with detailed inputs and analysis from MarketsandMarkets and presented in this report. The following figure represents this study's overall market size estimation process.
Security Solutions Market: Top-Down and Bottom-Up Approach

Data Triangulation
Once the overall size of the security solutions market has been determined using the methods described above, it has been divided into multiple segments and subsegments. Market engineering has been performed for each segment and subsegment using market breakdown and data triangulation methods, as applicable, to obtain accurate statistics. Various factors and trends from the demand and supply sides have been studied to triangulate the data. The market size has been validated using both top-down and bottom-up approaches.
Market Definition
Security solutions encompass a comprehensive set of measures, technologies, and practices designed to protect physical assets, facilities, and individuals from unauthorized access, theft, vandalism, and other potential threats. These solutions often include a combination of hardware and software offerings such as access control systems, surveillance cameras, perimeter barriers (e.g., fences, gates), alarm systems, biometric identification systems, and visitor management systems. The primary goal is to create a secure environment that deters intrusions, monitors activities, and responds promptly to security incidents. By deploying tailored physical security solutions, organizations can safeguard their premises, assets, and personnel, thereby mitigating risks, ensuring safety compliance, and maintaining operational continuity.
Key Stakeholders
- Security system providers
- End-user organizations
- System integrators
- Consultants and advisory firms
- Regulatory bodies and compliance agencies
- Technology vendors
- Security service providers
- Distributors and resellers
- Industry associations and organizations
- Investors and financial institutions
Report Objectives
- To describe and forecast the security solutions market, by system, service, vertical, and region, in terms of value
- To describe and forecast the market for various segments across four main regions, namely, North America, Europe, Asia Pacific, and RoW, in terms of value
- To strategically analyze micromarkets with regard to individual growth trends, prospects, and contributions to the markets
- To provide detailed information regarding drivers, restraints, opportunities, and challenges influencing market growth
- To analyze opportunities for stakeholders by identifying high-growth segments in the market
- To offer a detailed overview of the security solutions value chain
- To strategically analyze key technologies, average selling price trends, trends impacting customer business, ecosystem, regulatory landscape, patent landscape, Porter's five forces, import and export scenarios, trade landscape, key stakeholders, buying criteria, and case studies pertaining to the market under study
- To strategically profile key players in the security solutions market and comprehensively analyze their market share and core competencies
- To analyze competitive developments such as partnerships, acquisitions, expansions, collaborations, and product launches, along with R&D in the security solutions market
- To analyze the impact of US Trump tariff and impact of AI on security solutions market.
Available Customizations:
With the given market data, MarketsandMarkets offers customizations according to the specific requirements of companies. The following customization options are available for the report:
- Detailed analysis and profiling of additional market players (up to 5)
- Additional country-level analysis of the security solutions market
Product Analysis
- The product matrix provides a detailed comparison of the product portfolio of each company in the security solutions market.
Need a Tailored Report?
Customize this report to your needs
Get 10% FREE Customization
Customize This ReportPersonalize This Research
- Triangulate with your Own Data
- Get Data as per your Format and Definition
- Gain a Deeper Dive on a Specific Application, Geography, Customer or Competitor
- Any level of Personalization
Let Us Help You
- What are the Known and Unknown Adjacencies Impacting the Security Solutions Market
- What will your New Revenue Sources be?
- Who will be your Top Customer; what will make them switch?
- Defend your Market Share or Win Competitors
- Get a Scorecard for Target Partners

Custom Market Research Services
We Will Customise The Research For You, In Case The Report Listed Above Does Not Meet With Your Requirements
Get 10% Free Customisation


Growth opportunities and latent adjacency in Security Solutions Market