
Fire Protection System Market Size, Share and Trends

Fire Protection System Market Size, Share and Trends by Product (Fire Suppression Systems, Fire Sprinklers, Photoelectric Smoke Detectors, lonization Detectors, Dual Sensor Detectors, Flame Detectors, Heat Detectors, Fire Analysis, Fire Response) - Global Forecast to 2030


Fire Protection System Market Size, Share & Trends
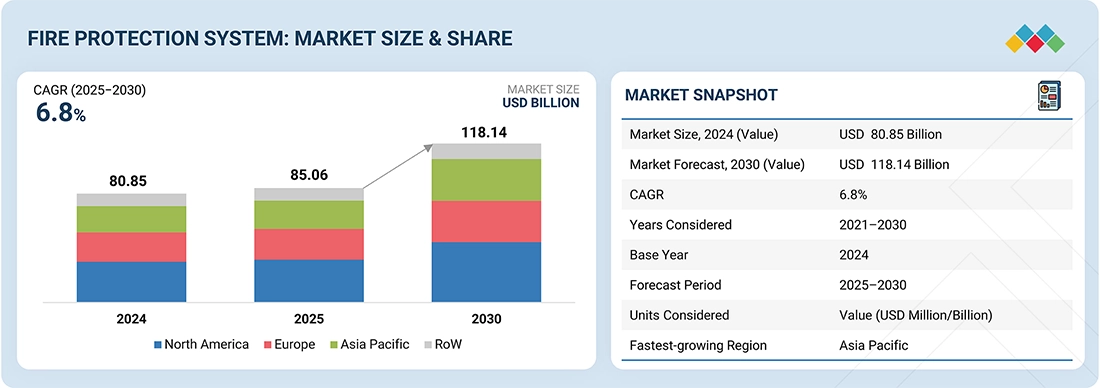
According to Marketsandmarkets, the global fire protection system market size is projected to grow from USD 85.06 billion in 2025 to USD 118.14 billion by 2030 at a CAGR of 6.8% during the forecast period. The increasing emphasis on building safety, stringent fire safety regulations, and rising infrastructure development across commercial and industrial sectors are key factors driving market growth. Growing adoption of smart, connected fire detection and suppression technologies is further enhancing system efficiency, compliance, and real-time monitoring capabilities.
The global fire protection system market is experiencing solid expansion as stringent safety regulations, rapid urbanization, and growing awareness of fire hazards push organizations to adopt advanced safety solutions. Globally, the market is projected to grow strongly over the next decade, with estimates indicating significant increases in market valuation as organizations across commercial, industrial, and residential sectors invest in intelligent fire detection, automated suppression, and integrated response technologies to reduce risk and protect assets. This growth is underpinned by regulatory mandates, such as global fire safety codes, that require more sophisticated systems beyond conventional alarms and sprinklers, and by increasing infrastructure development worldwide. The fire protection industry focuses on developing, installing, and maintaining systems that detect, suppress, and prevent fires across residential, commercial, and industrial environments. It is driven by strict safety regulations, technological innovation, and growing demand for smart, integrated fire safety solutions worldwide.
MARKET SNAPSHOT TABLE
| REPORT METRIC | DETAILS |
|---|---|
| Market Size, 2025 (Value) | USD 85.06 Billion |
| Market Forecast, 2030 (Value) | USD 118.14 Billion |
| Growth Rate | CAGR of 6.8% from 2025 to 2030 |
| Years Considered | 2021–2030 |
| Base Year | 2024 |
| Forecast Period | 2025–2030 |
| Units Considered | Value (USD Million/Billion) |
| Report Coverage | Revenue Forecast, Company Ranking, Competitive Landscape, Growth Factors, and Trends |
| Top Companies |
|
| Growth Driver |
|
| Segments Covered |
|
| Regional Scope | North America, Asia Pacific, Europe, the Middle East, Africa, South America |
Market Size & Forecast
FIRE PROTECTION SYSTEMS MARKET KEY TAKEAWAYS
- Fire suppression segment is expected to hold the largest market share of 36.4% in the fire protection system market.
- Maintenance services are projected to register a significant CAGR over the forecast period.
- The industrial segment is projected to grow at the highest CAGR of 7.3% during the forecast period.
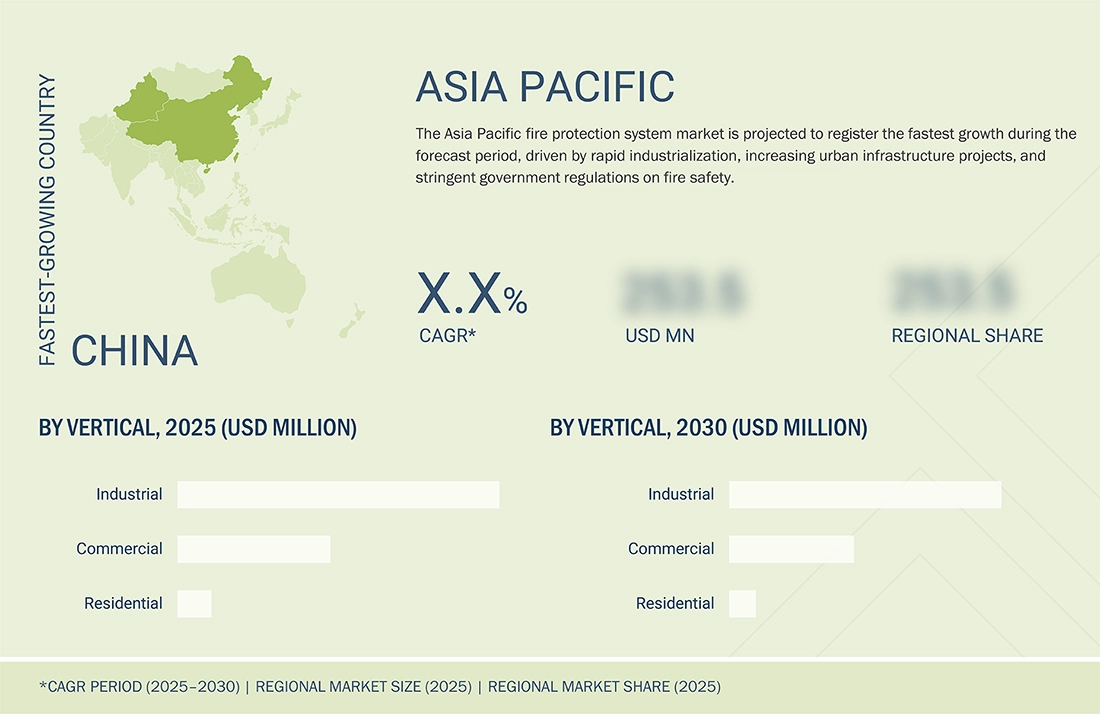
- Asia Pacific is projected to exhibit the highest CAGR of 8.0% during the forecast period.
- Honeywell International Inc., Johnson Controls and Siemens were identified as some of the star players in the Fire Protection System Market (global), given their strong market share and product footprint.
- Fike, Securiton and Potter Electric Signal among others, have distinguished themselves among startups and SMEs by securing strong footholds in specialized niche areas, underscoring their potential as emerging market leaders
The fire protection system market share is expected to experience robust growth in the coming years, driven by increasing urbanization, stringent fire safety regulations, and rising awareness about asset and life protection across industries. Technological advancements such as IoT-enabled fire detection, AI-based monitoring, and smart suppression systems are transforming traditional fire safety infrastructure, improving response time and system reliability.
Source: Secondary Research, Interviews with Experts, MarketsandMarkets Analysis
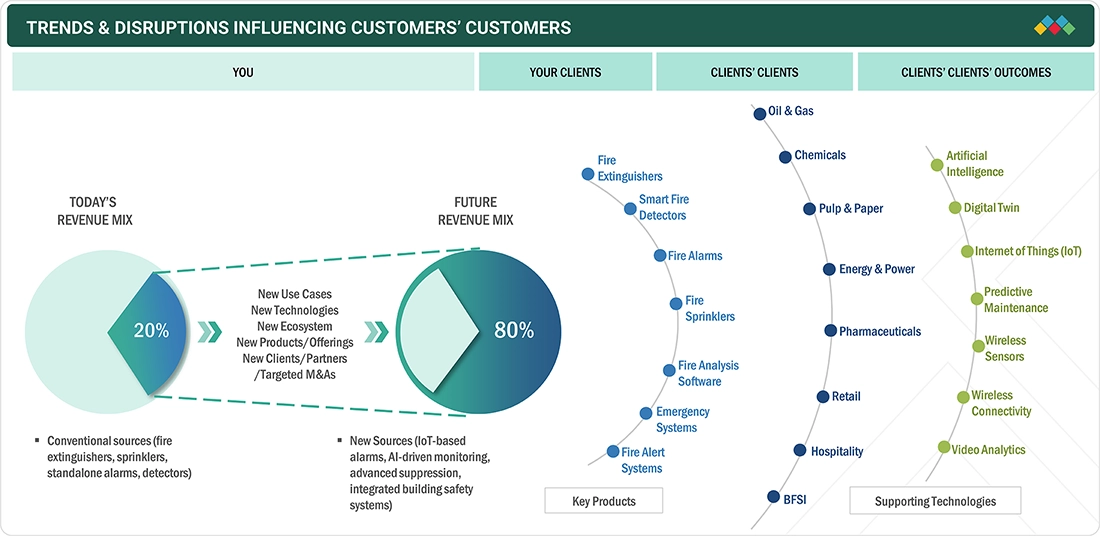
TRENDS & DISRUPTIONS IMPACTING CUSTOMERS' CUSTOMERS
Manufacturers focus on IoT-enabled fire detectors, AI-driven fire analysis software, wireless sensors, and predictive maintenance to improve real-time monitoring, system reliability, and emergency response. Emerging technologies such as digital twins, video analytics, and smart connectivity are enabling integrated fire protection ecosystems that support simulation, compliance, and operational resilience. As businesses seek solutions that enhance safety, minimize downtime, and reduce human error, demand for networked fire alarm systems, clean agent suppression systems, and advanced fire alert platforms is rising. These disruptions are expected to generate new revenue streams for providers while gradually shifting the market mix from traditional products to innovative, automated, and intelligent fire safety systems.
Source: Secondary Research, Interviews with Experts, MarketsandMarkets Analysis
FIRE PROTECTION SYSTEMS MARKET DYNAMICS
Level
-
Expanding global infrastructure development and rising demand for advanced safety systems

-
Rising enterprise investments in fire protection to minimize risks and losses

Level
-
High installation and upkeep expenses of advanced fire protection systems

-
Limited consumer awareness and inadequate fire safety adoption in developing regions

Level
-
Growing adoption of advanced foam-based and water mist fire suppression systems

-
Expanding use of IoT-integrated smart fire detection devices for enhanced safety and monitoring

Level
-
Challenges in integrating and configuring complex fire detection systems

-
Navigating evolving and diverse regulatory compliance challenges

Source: Secondary Research, Interviews with Experts, MarketsandMarkets Analysis
Driver: Expanding global infrastructure development and rising demand for advanced safety systems
The growing number of buildings due to expanding businesses, stricter regulations, and emphasis on employee safety propel demand within the corporate sector. Simultaneously, large-scale infrastructure projects, complex designs, a focus on public safety, and government regulations are contributing to the need for advanced fire protection solutions in the infrastructure sector.
Restraint: High installation and upkeep expenses of advanced fire protection systems
Implementing fire protection systems requires significant initial investments due to the complexity and sophistication of the technology involved. These systems encompass advanced detection and suppression technologies, which necessitate careful design and integration into existing structures to effectively combat fire risks. Ensuring compliance with local fire codes demands ongoing training, inspections, and potential updates to the system, adding to both upfront and long-term costs. While these expenses can be substantial, they represent a critical investment in safety that helps protect lives and property, while also potentially reducing costs associated with fire incidents over time.
Opportunity: Growing adoption of advanced foam-based and water mist fire suppression systems
Foam-based fire detection systems are efficient and effective in combating fires while also being environmentally friendly. These systems utilize a foaming agent that is biodegradable, ensuring that it does not leave harmful residues in the environment. Moreover, the foaming agent is compatible with sewage treatment facilities, making disposal easier and safer. This innovative approach not only protects building occupants from fire hazards but also aligns with sustainability goals. Foam-based fire detection systems represent a responsible choice for both safety and environmental stewardship.
Challenge: Challenges in integrating and configuring complex fire detection systems
One of the main difficulties fire protection system developers face is integrating user interfaces when multiple solutions are used in a control mechanism. This challenge arises from the need for a cohesive user experience, as various systems from different manufacturers often have inconsistent interfaces, making it confusing for operators. To overcome this, developers must prioritize interoperability and standardization, potentially creating a unified dashboard that consolidates information and controls from multiple systems. Employing modern technologies like APIs for better communication and conducting usability testing can further enhance these interfaces, ultimately ensuring that fire safety measures are efficient and effective during emergencies.
Fire Protection System Market SIZE, SHARE & GROWTH: COMMERCIAL USE CASES ACROSS INDUSTRIES
| COMPANY | USE CASE DESCRIPTION | BENEFITS |
|---|---|---|
 |
IoT- and AI-enabled Notifier alarms, smoke, heat, and gas detection for commercial and construction sectors | Cloud-based CLSS platform for real-time remote management and compliance | Minimized false alarms, early hazard alerting, automated responses (sprinklers, evacuation), easy compliance with safety codes, modular upgrades, efficient maintenance, and high energy efficiency |
 |
Intelligent fire suppression and alarm systems with automated alerts and bespoke solutions for commercial, high-rise, and warehouse safety, including data center risk management | Rapid suppression, business continuity, tailored high-risk solutions, compliance savings, insurance cost reduction, and scalable building coverage? |
 |
AI-powered fire detection and alarm systems for commercial, industrial, and public spaces | Smart sensors for early warning and multi-site connectivity | High detection accuracy, low false alarms, easy system scalability, instant notification, reliable multi-building protection, integrated evacuation controls |
 |
Cloud-connected Building X and Cerberus FIT fire safety systems for small to large buildings, remote control, predictive maintenance, and real-time notifications | Fast incident response, modular expansion, high reliability, compliance with latest standards, remote diagnostics, enhanced staff efficiency |
 |
Smart detectors (First Alert, Honeywell Home), IoT-enabled controls for fire, water, and CO leaks in residential/small commercial | Integrated security, remote monitoring, and cloud alerts | Early hazard detection, mobile alerts, simple installation/maintenance, broad smart home integration, code compliance, energy and insurance savings, actionable data insights |
Logos and trademarks shown above are the property of their respective owners. Their use here is for informational and illustrative purposes only.
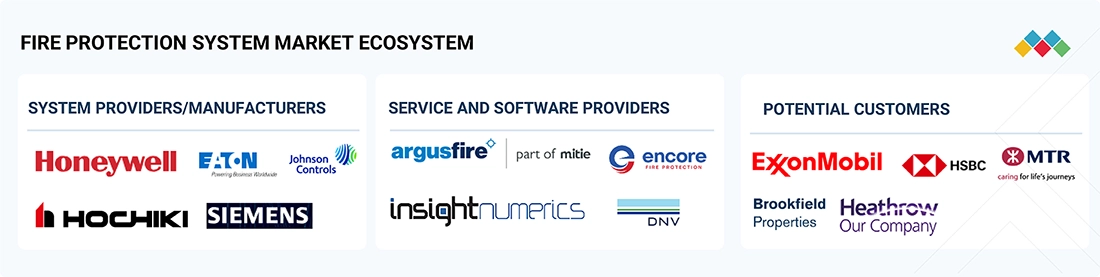
FIRE PROTECTION SYSTEMS MARKET ECOSYSTEM
The fire protection system market trends is supported by a strong ecosystem of fire equipment manufacturers, technology developers, and system integrators. Key players such as Johnson Controls (Ireland), Honeywell International Inc. (US), Siemens AG (Germany), and Resideo Technologies Inc. (US) provide a wide portfolio of fire detection, suppression, and alarm solutions that cater to diverse end-user industries. These companies integrate IoT, wireless sensors, and AI-driven monitoring platforms to enhance accuracy, responsiveness, and reliability in fire safety operations. With rising regulatory requirements, safety awareness, and demand for smart, connected safety systems, the ecosystem's collaborative efforts are accelerating the shift from conventional fire equipment to intelligent, automated, and sustainable fire protection solutions globally.
Logos and trademarks shown above are the property of their respective owners. Their use here is for informational and illustrative purposes only.
FIRE PROTECTION SYSTEMS MARKET SEGMENTS
Source: Secondary Research, Interviews with Experts, MarketsandMarkets Analysis
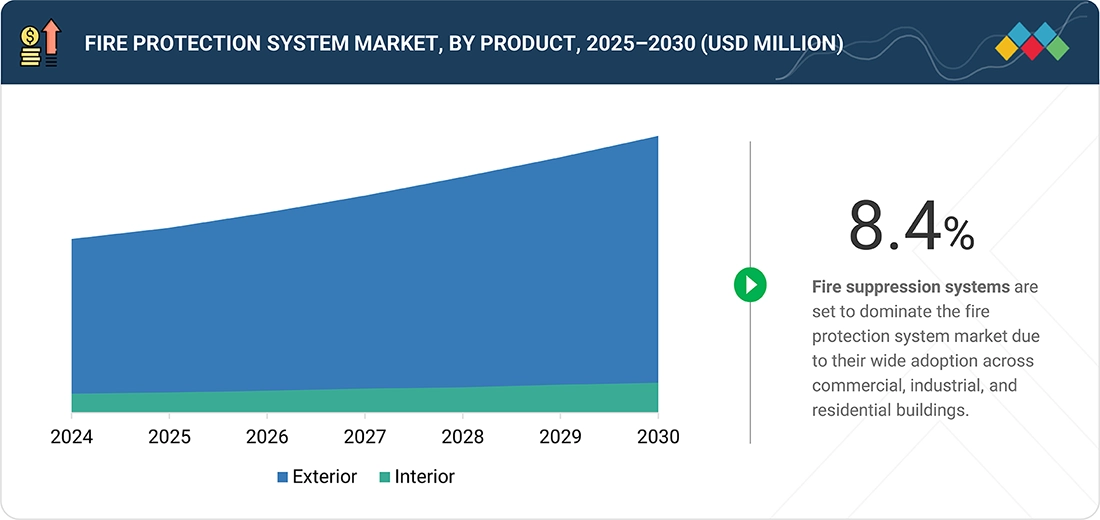
Fire Protection System Market, by Product
Based on product, the fire suppression segment is estimated to account for the largest share of the fire protection system market, driven by widespread adoption across industrial, commercial, and residential facilities. The increasing emphasis on minimizing fire-related losses and ensuring business continuity supports demand for advanced suppression technologies, including water-based, gaseous, and foam systems.
Fire Protection System Market, by Service
Maintenance services is set to form the largest segment owing to the recurring need for regular inspection, system testing, and performance validation. Growing regulatory compliance requirements and the need to ensure operational reliability across installed fire systems further boost demand for professional maintenance contracts and service-based offerings.
Fire Protection System Market, by Vertical
The industrial sector dominates the fire protection system market due to high fire risks in manufacturing, oil & gas, energy, and chemical industries. Continuous production operations, use of flammable materials, and strict safety regulations drive the integration of comprehensive fire detection, suppression, and monitoring systems in industrial facilities.
FIRE PROTECTION SYSTEMS MARKET REGION
Asia Pacific is projected to lead the global fire protection system market during the forecast period
The Asia Pacific fire protection system industry is estimated to lead the global market, driven by rapid industrialization, increasing urban infrastructure projects, and stringent government regulations on fire safety. Rising investments in commercial buildings, manufacturing facilities, and smart city initiatives further accelerate the demand for advanced fire detection and suppression solutions across the region.
The North America fire protection system market is projected to reach USD 42.95 billion by 2030 from USD 30.53 billion in 2025, at a CAGR of 7.1% from 2025 to 2030. The growing focus on occupant safety, strict fire protection codes, and the continued expansion of commercial and industrial infrastructure are driving market growth. At the same time, rising adoption of smart and connected fire detection and suppression systems is improving compliance, operational efficiency, and real-time monitoring capabilities.
The European fire protection system market is projected to reach USD 29.76 billion by 2030 from USD 22.20 billion in 2025, at a CAGR of 6.0% from 2025 to 2030. Growing emphasis on occupant safety, stringent EU fire safety regulations, and ongoing modernization of commercial and industrial infrastructure are supporting market growth in Europe. In parallel, increasing adoption of smart and connected fire detection and suppression systems is enhancing regulatory compliance, operational efficiency, and real-time monitoring across buildings.
Fire Protection System Market SIZE, SHARE & GROWTH : COMPANY EVALUATION MATRIX
In the fire protection system companies matrix, Johnson Controls (Star) and SECOM CO., LTD. (Emerging Leader) hold strong positions with their broad product portfolios, global presence, and robust financial capabilities. Their continuous innovation and brand equity enable them to lead large-scale adoption of fire protection systems worldwide.
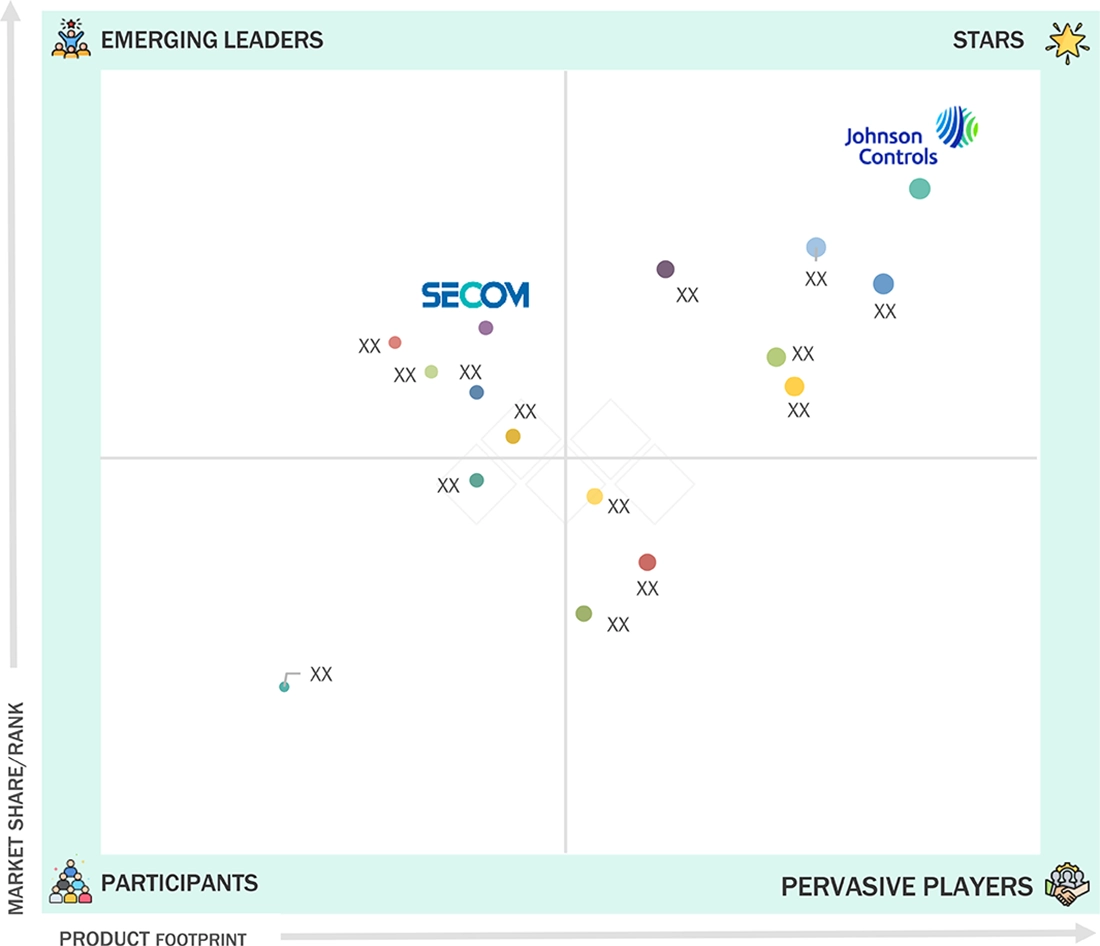
Source: Secondary Research, Interviews with Experts, MarketsandMarkets Analysis
FIRE PROTECTION SYSTEMS MARKET KEY PLAYERS
WHAT IS IN IT FOR YOU: Fire Protection System Market REPORT CONTENT GUIDE
DELIVERED CUSTOMIZATIONS
We have successfully delivered the following deep-dive customizations:
| CLIENT REQUEST | CUSTOMIZATION DELIVERED | VALUE ADDS |
|---|---|---|
| North American Commercial Real Estate Developer |
|
|
| European Industrial Manufacturing Client |
|
|
| APAC Infrastructure Contractor |
|
|
RECENT DEVELOPMENTS
- July 2025 : Honeywell International Inc. announced the acquisition of Li-ion Tamer, a leading off-gas detection solution for lithium-ion batteries, from Nexceris. This acquisition strengthened Honeywell’s fire life safety technologies within its Building Automation segment and supports safety solutions for energy storage and data centers.
- March 2025 : Resideo Technologies Inc. partnered with Google Home to launch the First Alert Smart Smoke & Carbon Monoxide (CO) Alarm, compatible with the Nest Protect Smart Smoke & CO Alarm. The integration allowed users to extend or replace existing Nest devices through the Google Home app, enabling seamless and connected fire and CO safety coverage.
- February 2025 : Teledyne Technologies Incorporated introduced the Spyglass Xtend triple-infrared flame detector, capable of simultaneously detecting both hydrogen (H2) and hydrocarbon (HC) fires. This innovation enhanced safety in industrial environments where hydrogen flames may spread to nearby equipment and trigger hydrocarbon fuel fires, which are invisible to detectors designed only for H2.
- December 2024 : Siemens completed the acquisition of Danfoss Fire Safety, a Denmark-based specialist in fire suppression technology. This acquisition enhanced Siemens’ fire suppression portfolio with high-pressure water mist, drives growth in key industries, and supports the transition toward sustainable fire safety solutions.
- September 2024 : Johnson Controls launched the Tyco ESFR-25 Dry-Type Pendent Sprinkler, FM Approved for efficient fire protection in commercial refrigerated and frozen storage areas. Designed for cold storage environments up to 50 ft (15.2 m) high with temperatures as low as -60°F (-51°C), the ceiling-only, lower-pressure sprinkler would reduce the need for fire pumps and eliminates in-rack sprinklers for high-piled storage in box-in-box applications.
- May 2024 : Honeywell International Inc. inaugurated its first assembly line in Dhahran, Saudi Arabia, dedicated to fire alarm and building management solutions. This facility supported Honeywell’s localization efforts and strengthens its building automation capabilities in the Middle East.
Table of Contents
 Exclusive indicates content/data unique to MarketsandMarkets and not available with any competitors.
Methodology
The research study involved four significant steps in estimating the fire protection system market size. Exhaustive secondary research has been done to collect important information about the market and peer markets. The next step has been to validate these findings and assumptions and size them with the help of primary research with industry experts across the value chain. Both top-down and bottom-up approaches have been used to estimate the market size. After this, the data triangulation approach has been adopted to estimate the market sizes of segments and subsegments.
Secondary Research
Various secondary sources have been referred to in the secondary research process to identify and collect the information required for this study. These sources include annual reports, press releases, investor presentations of companies, white papers, and articles from recognized authors. Secondary research has mainly been done to obtain key information about the market’s value chain, the pool of key market players, market segmentation according to industry trends, regional outlook, and developments from market and technology perspectives.
The fire protection system market report estimates the global market size using the top-down and bottom-up approaches, along with several other dependent submarkets. The major players in the market have been identified using extensive secondary research, and their presence in the market has been determined using secondary and primary research. All the percentage splits and breakdowns have been determined using secondary sources and verified through primary sources.
Primary Research
In the primary research process, several sources from the supply and demand sides have been interviewed to obtain qualitative and quantitative information for this report. The demand side included representatives from end-use industries such as commercial, industrial, residential, and government sectors, while the supply side comprised fire protection system manufacturers, component suppliers, and distributors. This primary data has been collected through questionnaires, emails, and telephonic interviews. Approximately 25% of the primary interviews have been conducted with the demand-side respondents and 75% with the supply-side respondents. This primary data has been collected mainly through telephonic interviews, which accounted for 80% of the total primary interviews.
After successful interaction with industry experts, brief sessions have been conducted with highly experienced independent consultants to reinforce the findings of our primary research. This, along with the in-house subject-matter experts’ opinions, led us to the findings described in the report. The breakdown of primary respondents is as follows:

Note: The 3 tiers of companies are defined based on their total revenue as of 2023: tier 3: revenue less than USD 1 billion; tier 2: revenue between USD 1 billion and USD 5 billion; and tier 1: revenue more than USD 5 billion. .
Other designations include product managers, sales managers, and marketing managers.
RoW mainly includes South America, Africa, GCC countries, and Rest of the Middle East.
To know about the assumptions considered for the study, download the pdf brochure
Market Size Estimation
Top-down and bottom-up approaches have been used to estimate and validate the fire protection system market size and other dependent submarkets. The leading players in the market have been identified through secondary research, and their market shares in the key regions have been determined through primary and secondary research. This entire procedure includes the study of the annual and financial reports of the top players and extensive interviews with industry experts, such as chief executive officers, vice presidents, directors, and marketing executives, for key insights.
All percentage shares, splits, and breakdowns have been determined using secondary sources and verified through primary sources. All possible parameters affecting the markets covered in this study have been accounted for, viewed in detail, verified through primary research, and analyzed to get the final quantitative and qualitative data. This data has been consolidated and supplemented with detailed inputs and analysis from MarketsandMarkets and presented in this report. The three figures below represent this study’s overall market size estimation process.
Bottom-Up Approach
- Identifying industries that are either using or will use a fire protection system
- Tracking leading companies and system integrators operating across various industries
- Deriving the size of the fire protection system market through the data sanity method, analyzing revenues of more than 20 key providers through their annual reports and press releases, and summing them up to estimate the overall market size
- Conducting multiple discussions with key opinion leaders to understand the demand for fire protection systems, and analyzing the breakup of the scope of work carried out by each major company
- Carrying out the market trend analysis to obtain the CAGR of the fire protection system market by understanding the product penetration rate in each industry, and analyzing the demand and supply of fire protection system instruments in different applications
- Assigning a percentage to the overall revenue or, in a few cases, to segmental revenues of each company to derive their revenues from the sales of fire protection system instruments; the percentage for each company has been assigned based on their product portfolios
- Verifying and cross-checking estimates at every level through discussions with key opinion leaders, including CXOs, directors, and operation managers, and with domain experts at MarketsandMarkets
- Studying various paid and unpaid information sources, such as annual reports, press releases, white papers, and databases
- Tracking ongoing and identifying upcoming fire protection system product execution projects by companies, and forecasting the market size based on these developments and other critical parameters
Top-Down Approach
- MarketsandMarkets focuses on the top-line expenditures and investments made throughout the fire protection system ecosystem to manufacture new equipment/systems and retrofit the existing ones.
- The information related to revenues generated by key manufacturers of fire protection system instruments has been studied and analyzed.
- Multiple on-field discussions have been carried out with key opinion leaders of leading companies manufacturing fire protection system instruments.
- The geographical split has been estimated using secondary sources based on various factors, such as the number of players in a specific country or region and the fire protection system instruments provided by these players.
Fire Protection System Market: Top-Down and Bottom-Up Approach

Data Triangulation
After arriving at the overall size of the fire protection system market from the market size estimation processes explained above, the total market has been split into several segments and subsegments. Where applicable, the market breakdown and data triangulation procedures have been employed to complete the overall market engineering process and arrive at the exact statistics for all segments and subsegments. The data has been triangulated by studying various factors and trends. Additionally, the market size has been validated using top-down and bottom-up approaches.
Market Definition
Fire protection systems are a set of connected devices or systems used to prevent fire accidents. These systems reduce the impact of uncontrolled fires, saving lives and property. They comprise fire detection, fire suppression, fire sprinkler, fire analysis, and fire response systems required during fire emergencies. The scope of this market includes products, software, and services, as mentioned in the table below. The services market covers various post-sales, installation, maintenance, and other services offered according to customer requirements and application areas.
Key Stakeholders
- Raw material suppliers
- Electronic design automation (EDA) and design tool vendors
- Government bodies, venture capitalists, and private equity firms
- Integrated device manufacturers (IDMs)
- Fire protection system technology platform developers
- Fire protection system component manufacturers
- Fire protection system original equipment manufacturers (OEMs)
- Assembly, testing, and packaging vendors
- System integrators
- Distributors and traders
- Research organizations
- Organizations, forums, alliances, and associations
- End users
Report Objectives
- To define, describe, and forecast the fire protection system market, by type, product, service, and vertical, in terms of value
- To forecast the market size for the product segment, in terms of volume
- To describe and forecast the size of the fire protection system market, by four regions: North America, Europe, Asia Pacific, and the Rest of the World (RoW), along with their respective countries, in terms of value
- To provide detailed information regarding drivers, restraints, opportunities, and challenges influencing the market growth
- To strategically analyze micromarkets with respect to individual growth trends, prospects, and contributions to the overall market size
- To study the complete value chain of the fire protection system market
- To analyze opportunities for stakeholders by identifying high-growth segments of the fire protection system market
- To strategically profile the key players and comprehensively analyze their market positions in terms of their ranking and core competencies
- To analyze competitive developments, such as product launches, acquisitions, agreements, and partnerships, in the fire protection system market
- To provide ecosystem analysis, case study analysis, patent analysis, technology analysis, impact of AI/Gen AI, Impact of 2025 US Tariff- machine control system market key conferences and events, Porter’s five forces analysis, and regulations pertaining to the market under study
- To provide a macroeconomic outlook for all the regions in the region chapter
Available Customizations:
With the given market data, MarketsandMarkets offers customizations according to the specific requirements of companies. The following customization options are available for the report:
- Detailed analysis and profiling of additional market players based on various blocks of the supply chain
Key Questions Addressed by the Report
What is the current size of the Fire Protection System Market?
The global Fire Protection System Market is estimated at USD 85.06 billion in 2025 and is projected to reach USD 118.14 billion by 2030.
What is the expected CAGR of the Fire Protection System Market during 2025–2030?
The market is expected to grow at a CAGR of 6.8% from 2025 to 2030, driven by increasing urbanization, infrastructure development, and stricter fire safety regulations worldwide.
What are the major growth drivers of the Fire Protection System Market?
Key growth drivers include expanding global infrastructure projects, rising investments in building safety, stringent fire safety regulations, growing awareness of life and asset protection, and adoption of smart fire detection technologies.
Which product segment holds the largest share of the Fire Protection System Market?
The Fire Suppression Systems segment is expected to hold the largest market share, accounting for approximately 36.4% of the market due to its widespread deployment across industrial, commercial, and residential facilities.
Which service segment is expected to dominate the market?
Maintenance Services are projected to account for the largest share due to the recurring need for system inspections, testing, regulatory compliance, and performance validation.
Which industry vertical is expected to grow the fastest?
The Industrial sector is projected to grow at the highest CAGR of 7.3% during the forecast period, driven by fire safety requirements in manufacturing, oil & gas, chemical, and energy industries.
Which region is expected to be the fastest-growing Fire Protection System Market?
Asia Pacific is projected to exhibit the highest CAGR of 8.0% through 2030 due to rapid industrialization, smart city initiatives, commercial construction growth, and stricter fire safety regulations.
What are the key trends shaping the Fire Protection System Market?
Major trends include IoT-enabled fire detectors, AI-powered fire analysis software, wireless fire monitoring systems, predictive maintenance, digital twins, video analytics, and integrated smart fire safety ecosystems.
Who are the leading companies operating in the Fire Protection System Market?
Major players include Honeywell International Inc., Johnson Controls, Siemens, Robert Bosch GmbH, and Eaton.
What opportunities and challenges exist in the Fire Protection System Market?
Opportunities include adoption of IoT-integrated fire detection systems and advanced foam- and water-mist suppression technologies. Challenges include high installation costs, system integration complexity, and evolving regulatory compliance requirements.
Need a Tailored Report?
Customize this report to your needs
Get 10% FREE Customization
Customize This ReportPersonalize This Research
- Triangulate with your Own Data
- Get Data as per your Format and Definition
- Gain a Deeper Dive on a Specific Application, Geography, Customer or Competitor
- Any level of Personalization
Let Us Help You
- What are the Known and Unknown Adjacencies Impacting the Fire Protection System Market
- What will your New Revenue Sources be?
- Who will be your Top Customer; what will make them switch?
- Defend your Market Share or Win Competitors
- Get a Scorecard for Target Partners

Custom Market Research Services
We Will Customise The Research For You, In Case The Report Listed Above Does Not Meet With Your Requirements
Get 10% Free CustomisationTESTIMONIALS

Tetsuya Ohhira
Business Development Manager-Technology Business
Nikon Corporation,
Leading Japanese MNC specializing in optics and imaging productswww.nikon.com
MarketsandMarkets™ response
is quick. Their attitude is flexible and positive. Analyst Insights are globally considered and
significant. Client Services quickly respond to our inquiry and demand. Their wide range of global
surveys help us make our strategic plan.
We hope Knowledge Store will be easier to search
for a report.
VP - Marketing & Business Development
Leading Provider of Process Control Solutions
We engaged with MarketsandMarkets on a study to perform an analysis and recommend a Go-To-Market strategy for metrology and process control in the semiconductor market. The study was tailored to our targets and needs with well-defined milestones. Our overall experience with the MarketsandMarkets team was very good throughout the project in all aspects including the analysis methodologies used, the quality and depth of primary and secondary data sets, the professionalism and flexibility of the team and the ability to meet the target schedule and milestones. We want to thank MarketsandMarkets team for a job well done.
- US Fire Protection System Market
- Canada Fire Protection System Market
- Mexico Fire Protection System Market
- UK Fire Protection System Market
- Germany Fire Protection System Market
- France Fire Protection System Market
- Italy Fire Protection System Market
- Spain Fire Protection System Market
- China Fire Protection System Market
- Japan Fire Protection System Market
- South Korea Fire Protection System Market
- India Fire Protection System Market
Growth opportunities and latent adjacency in Fire Protection System Market


Brandon
Apr, 2026
Which industries (residential, commercial, industrial) are driving the highest demand for fire protection systems?.
Brandon
Apr, 2026
Which industries (residential, commercial, industrial) are driving the highest demand for fire protection systems?.
Daniel
Apr, 2026
Which regions are expected to witness the highest growth in the fire protection system market by 2030 and why?.
Bruce
Apr, 2026
How are Internet of Things and Artificial Intelligence transforming modern fire protection systems?.
User
Sep, 2019
New technological innovations such as cloud-based technology and 5G technology are creating huge opportunities for the fire protection device manufacturers. Do you have insights on how 5G technology has a positive impact on the growth of fire protection devices in the report? .
User
Sep, 2019
With the increase in adoption of AR and VR technologies in various industrial applications, firefighters are also adopting VR training, which helps them to see outcomes and develop critical thinking skills. Could you provide more clarification on such type of training information in the report?.
User
Sep, 2019
Nowadays, drones and UAVs are among of the fastest-growing markets and are used by fire departments as fire alarm resources. Is it possible to get few market trends and size of UAV-based fire protection systems from the report?.
User
Oct, 2020
Does this analysis also include more specialized systems such as condensed aerosol fire suppression? .
User
Sep, 2019
A fire in mines, forests, and other industries is a critical issue. Vehicle suppression systems are mostly used to inhibit the fire in heavy equipment used in such industries. I would like to have more information on vehicle suppression systems for APAC and Middle East regions, where these systems has penetrating with a high demand in the market. .
User
May, 2019
Mobile ultrasound fire protection devices are more versatile than fixed monitors. These can be used for fast deployment in a wide range of scenarios and are creating huge opportunities for the growth of the fire protection system market. Could you provide more information on the vendors offering ultrasound fire protection monitors?.