Hybrid Valve Market by Material (Steel, Tungsten Carbide, Alloy, Titanium, Duplex Nickel), Valve Size, End-Use Industry (Oil & Gas, Water & Wastewater, Energy & Power, Chemicals, and others), and Region - Global Forecast to 2024


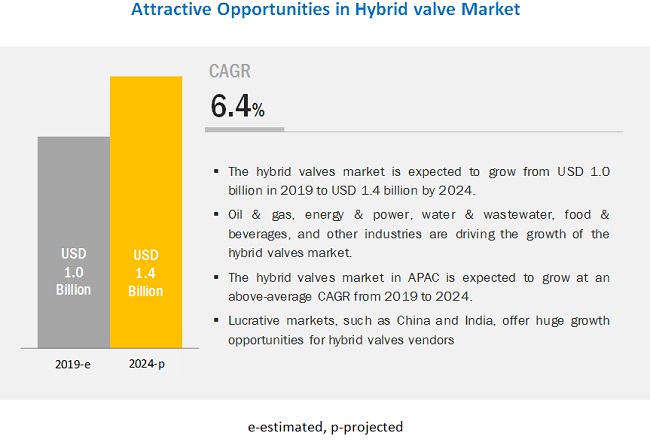
The global hybrid valve market size is expected to be valued at USD 1.0 billion in 2019 and is likely to reach USD 1.4 billion by 2024, growing at a CAGR of 6.4% between2019 and 2024. The need for controlling excessive noise, pressure, vibration, and cavitation in critical processes; and corrosion problems in the oil & gas are the key factors driving the hybrid valve industry. Moreover, 3D printers in manufacturing lines and an increase in the number of refineries and petrochemicals and chemicals plants worldwide are expected to considerably boost the growth of the hybrid valve market size in the coming years.
The market for hybrid valves is expanding significantly due to a number of important factors, including technological advancements, particularly the integration of Internet of Things (IoT) and automation in hybrid valves, which have improved control, efficiency, and remote monitoring capabilities; the rise in oil production and the need for advanced flow regulation and reliability in extraction processes, which has increased the adoption of hybrid valves in the oil and gas sector; strict environmental regulations, which have increased the demand for hybrid valves with advanced sealing capabilities; and the growing demand for energy-efficient solutions and automation across industries like oil and gas, chemicals, and water treatment.
Impact of AI on Hybrid Valve Market
Artificial Intelligence (AI) is revolutionizing the hybrid valve market by enabling smarter control, predictive maintenance, and enhanced operational efficiency in fluid handling systems. AI algorithms integrated with hybrid valves allow real-time monitoring and automatic adjustment of valve operations based on flow conditions, pressure, and temperature, ensuring optimal performance across dynamic industrial environments. These smart systems can predict wear and potential failures by analyzing historical and real-time data, thus minimizing downtime and reducing maintenance costs. AI also supports remote diagnostics and seamless integration with Industrial Internet of Things (IIoT) platforms, facilitating smarter decision-making and streamlined operations. As industries such as oil & gas, power generation, water treatment, and chemical processing seek advanced solutions for precise flow control and system reliability, AI-driven hybrid valves are becoming essential components, driving innovation and growth in the market.
By material type, steel is expected to account for the largest hybrid valve market share by 2024
Steel, tungsten carbide, duplex nickel, titanium, and alloy, among others, are the most widely used materials. The steel hybrid valve market is expected to witness significant growth during the forecast period. The reason for this projection is the anticipated huge demand for the material from applications involving high temperature and steam due to the need for greater flow control and corrosive media handling applications in chemicals and water & wastewater treatment industries during the forecast period.
The chemicals industry is likely to grow at the highest CAGR during the forecast period
The hybrid valve market for the chemicals industry is expected to witness significant growth during the forecast period. Hybrid valves are used increasingly for controlling distinctive & complex noises and acoustical challenges generated in chemicals plants, due to a large number of potential in-situ noise sources and the size of facilities.
Equipment such as centrifuge machines, mixers, high-pressure pumps, valves, and associated pipelines generate noise that is potentially detrimental to the health of employees and disruptive to the local community. In addition, the expansion of consent decrees on air, noise, and water pollution implemented in refineries are factors encouraging the demand for hybrid valves in the chemicals industry.
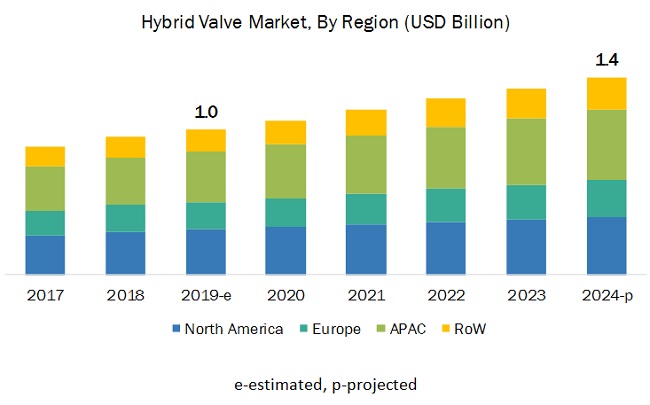
APAC to account for the largest hybrid valve market share during the forecast period
APAC is expected to account for the largest hybrid valve market share during the forecast period. Population growth and rapid urbanization in developing economies, such as China and India, have prompted the speedy development in the region, which will boost the demand for hybrid valve from several industries such as energy & power, water & wastewater treatment, building & construction, chemicals, and pharmaceuticals, among others.
Key Market Players
Key players in the hybrid valve market include Emerson Electric Co. (US), IMI Plc. (Finland), Trillium Flow Technologies (US), Circor International Inc (US), Parcol S.P.A. (Switzerland), Koso Kent Introl Pvt. Ltd. (UK), Wuxi Smart Auto-Control Engineering Co. LTD. (China), Chemtrols Emet Pvt. Ltd. (India), Dymet Alloys (UK), and Carter Process Control GmbH (Austria), among others.
Emerson (US) is a leader in process control solutions and overall valve industry. The company has shown consistent growth in the market by helping its customers achieve superior projects and operational efficiencies through its extensive product portfolio and vertical industry expertise.
Scope of the Report
|
Report Metric |
Details |
|
Market size available for years |
2016–2024 |
|
Base year considered |
2018 |
|
Forecast period |
2019–2024 |
|
Forecast units |
Value (USD) |
|
Segments covered |
Material, Size, End-use Industry, and Region |
|
Geographies covered |
North America, APAC, Europe, and RoW |
|
Companies covered |
Emerson (US), IMI PLC (UK), Circor International Inc (US), Trillium Flow Technologies (US), and Dymet alloys (UK) among others (total 20 players are covered). |
This research report categorizes the hybrid valve market based on material, size, end-use industry, and region.
Hybrid Valve Market, by Material
- Steel
- Tungsten Carbide
- Duplex Nickel
- Titanium
- Alloy
- Others (Brass, Bronze, and Plastic)
Hybrid Valve Market, by Valve Size
- Up To 1”
- 1” to 6”
- 6” to 25”
- 25” to 50”
- 50” and Larger
Hybrid Valve Market, by Industry
- Oil & Gas
- Energy & Power
- Water & Wastewater
- Building & Construction
- Chemicals
- Pharmaceuticals
- Agriculture
- Metal & Mining
- Paper & Pulp
- Food & Beverages
- Others (Semiconductor, Textile, and Glass)
Hybrid Valve Market, by Geography
- North America (US, Canada, and Mexico)
- Europe (UK, Germany, France, Italy, and Rest of Europe)
- APAC (China, Japan, India, South Korea and Rest of APAC)
- RoW (South America, Middle East, and Africa)
Critical questions the report answers:
- Where will all these developments take the industry in the mid to long term?
- What are the leading industries of hybrid valves?
- How are advancements in the industries influencing the hybrid valve industry?
- Which valve material is expected to penetrate significantly in the hybrid valve market?
- Which countries are expected to witness significant growth in the hybrid valve market?
Frequently Asked Questions (FAQ):
Which material for hybrid valve is expected to drive the growth of the hybrid valve market in the next 5 years?
Steel, tungsten carbide, duplex nickel, titanium, and alloy, among others, are the most widely used materials. The steel hybrid valve market is expected to witness significant growth during the forecast period. The reason for this projection is the anticipated huge demand for the material from applications involving high temperature and steam due to the need for greater flow control and corrosive media handling applications in chemicals and water & wastewater treatment industries during the forecast period.
Which are the major companies in the hybrid valve market? What are their major strategies to strengthen their market presence?
Emerson (US), IMI Plc (UK), Weir (UK), and PARCOL (Italy) are a few leading OEMs in the hybrid valve market. Product launches, acquisitions, agreements, and contracts are some of the major strategies adopted by the market players to grow in the hybrid valve market.
Which region is expected to witness significant demand for hybrid valve in the coming years?
APAC is expected to account for the largest hybrid valve market share during the forecast period. Population growth and rapid urbanization in developing economies, such as China and India, have prompted the speedy development in the region, which will boost the demand for hybrid valve from several industries such as energy & power, water & wastewater treatment, building & construction, chemicals, and pharmaceuticals, among others.
Which industry expected to lead growth of hybrid valve market?
The hybrid valve market for the chemicals industry is expected to witness significant growth during the forecast period. Hybrid valves are used increasingly for controlling distinctive & complex noises and acoustical challenges generated in chemicals plants, due to a large number of potential in-situ noise sources and the size of facilities. Equipment such as centrifuge machines, mixers, high-pressure pumps, valves, and associated pipelines generate noise that is potentially detrimental to the health of employees and disruptive to the local community. In addition, the expansion of consent decrees on air, noise, and water pollution implemented in refineries are factors encouraging the demand for hybrid valves in the chemicals industry. .
To speak to our analyst for a discussion on the above findings, click Speak to Analyst
 Exclusive indicates content/data unique to MarketsandMarkets and not available with any competitors.
Table of Contents
1 Introduction (Page No. - 20)
1.1 Study Objectives
1.2 Market Definition
1.3 Study Scope
1.3.1 Markets Covered
1.3.2 Geographic Scope
1.3.3 Years Considered
1.4 Currency
1.5 Market Stakeholders
2 Research Methodology (Page No. - 23)
2.1 Research Data
2.1.1 Secondary and Primary Research
2.1.1.1 Key Industry Insights
2.1.2 Secondary Data
2.1.2.1 Key Data From Secondary Sources
2.1.3 Primary Data
2.1.3.1 Breakdown of Primaries
2.1.3.2 Key Data From Primary Sources
2.2 Market Size Estimation
2.2.1 Bottom-Up Approach
2.2.2 Top-Down Approach
2.3 Market Breakdown and Data Triangulation
2.4 Research Assumptions
3 Executive Summary (Page No. - 33)
4 Premium Insights (Page No. - 37)
4.1 Attractive Growth Opportunities in the Hybrid Valve Market
4.2 Market, By Material
4.3 Market in Asia Pacific, By Country and End–Use Industry
4.4 Market, By Size
4.5 Market, By Country, 2019
5 Market Overview (Page No. - 40)
5.1 Introduction
5.2 Market Dynamics
5.2.1 Drivers
5.2.1.1 The Need for Controlling Excessive Noise, Pressure, Vibration, and Cavitation in Critical Processes
5.2.1.2 Corrosion Problems in the Oil & Gas Industry are Projected to Drive the Demand for Hybrid Valve Made of Steel/Alloy/Carbide Materials
5.2.1.3 High Demand for Energy & Power Generation in Asia Pacific
5.2.1.4 The Increase in the Oil & Gas Production has Led to A Surge in Demand for Hybrid Valves in Gcc Countries
5.2.2 Restraints
5.2.2.1 Rising Instances of Downtime to Increase the Repairing and Maintenance Expenditures of Valves
5.2.2.2 Lack of Standardized Certifications and Government Policies to Increase the Production Cost
5.2.3 Opportunities
5.2.3.1 The Increasing Use of 3D Printers in Valve Manufacturing to Broaden the Growth Prospects
5.2.3.2 Increase in the Number of Refineries and Petrochemical & Chemical Plants Across Regions to Create Opportunities for Hybrid Valve Manufacturers
5.2.4 Challenges
5.2.4.1 High Fabrication Cost of Valves to Inhibit the Market Growth
6 Industry Trends (Page No. - 45)
6.1 Introduction
6.2 Value Chain Analysis
6.3 Industry Trends
6.3.1 IoT Impact on the Market
6.3.2 3D Printing
7 Hybrid Valve Market, By Material (Page No. - 48)
7.1 Introduction
7.2 Steel
7.2.1 Stainless Steel Material to Dominate the Market During the Forecast Period
7.3 Tungsten Carbide
7.3.1 Tungsten Carbide-Based Valves Play A Significant Role in the Market
7.4 Duplex Nickel
7.4.1 Duplex Nickel Material is Widely Used in the Petrochemical Industry
7.5 Titanium
7.5.1 Titanium-Based Valves Play A Significant Role in the Refinery, Food & Beverage, Mining, and Chemical Industries
7.6 Alloy
7.6.1 Higher Adoption of Alloy Material for Valves in the Power Industry
7.7 Others
8 Hybrid Valve Market, By Size (Page No. - 55)
8.1 Introduction
8.2 Up to 1”
8.2.1 Up T O 1” Hybrid Valves to Witness Significant Growth in the Market
8.3 1”–6”
8.3.1 1” T O 6” Hybrid Valves to Dominate Market During the Forecast Period
8.4 6’’–25’’
8.4.1 6” T O 25” Hybrid Valves to Drive the Market for Large-Pressure Applications
8.5 25’’ to 50’’
8.5.1 Handle High Pressure, Drop Water, and High Temperature Steam are Key Applications for 25" to 50" Hybrid Valves
8.6 50’’ & Larger
8.6.1 50” and Larger Hybrid Valves to Drive the Market for Oil & Gas, Power, and Petrochemicals Industry
9 Hybrid Valve Market, By End-Use Industry (Page No. - 62)
9.1 Introduction
9.2 Oil & Gas
9.2.1 Increasing Oil Well Production is Projected to Drive the Demand for Hybrid Valve in the Oil & Gas Industry
9.3 Water & Wastewater
9.3.1 Increasing Investments in Water Infrastructure is Projected to Encourage the Demand for Hybrid Valves
9.4 Energy & Power
9.4.1 Increasing Number of Nuclear Power Plants is Projected to Drive the Growth of the Market
9.5 Food & Beverage
9.5.1 Increasing Instances of Retrofitting in Existing Facilities of Food & Beverage Companies are Projected to Create Growth Opportunities for Hybrid Valves
9.6 Chemicals
9.6.1 Expansion of Consent Decrees Implemented in Refineries is A Key Factor Driving the Demand for Hybrid Valves
9.7 Pulp & Paper
9.7.1 Increasing Paper and Paperboard Production Across Regions is Projected to Drive the Demand for Hybrid Valves
9.8 Metals & Mining
9.8.1 Increasing Construction of New Coal Plants is Projected to Drive the Demand for Hybrid Valves
9.9 Building & Construction
9.9.1 Increasing Investments to Develop Smart Cities are Projected to Drive the Demand for Hybrid Valves
9.10 Pharmaceuticals
9.10.1 Increase in Demand for Medical Devices is Projected to Drive the Growth of the Market
9.11 Agriculture
9.12 Others
10 Geographic Analysis (Page No. - 110)
10.1 Introduction
10.2 North America
10.2.1 US
10.2.1.1 The Aging Water & Wastewater Sector is Expected to Generate A Demand for Hybrid Valves in the US
10.2.2 Canada
10.2.2.1 Investments in Oil, Lng, and Energy Infrastructure Drive the Market in Canada
10.2.3 Mexico
10.2.3.1 Developments in Pipeline Infrastructure to Increase the Demand for Hybrid Valves in Mexico
10.3 Europe
10.3.1 Germany
10.3.1.1 The Demand for the Production of Renewable Energy in Various Industries is Projected to Drive the Growth of the Market in Germany
10.3.2 UK
10.3.2.1 The Construction Industry is Projected to Fuel the Demand for Hybrid Valves in the UK
10.3.3 France
10.3.3.1 The Energy Sector in France is Projected to Drive the Growth of the Market
10.3.4 Italy
10.3.4.1 The Chemicals Industry in Italy to Drive the Market Growth
10.3.5 Rest of Europe
10.4 Asia Pacific
10.4.1 China
10.4.1.1 The Water & Wastewater Industry to Witness High Demand for Hybrid Valves in Asia Pacific
10.4.2 Japan
10.4.2.1 Gas Pipeline Projects in Japan are Projected to Drive the Market
10.4.3 South Korea
10.4.3.1 The Chemical and Food Processing Industries are Projected to Drive the Market in South Korea
10.4.4 India
10.4.4.1 The Mining & Energy Industry is Projected to Drive the Market in India
10.4.5 Rest of Asia Pacific
10.5 Rest of the World
10.5.1 South America
10.5.1.1 Growth in the Mining Industry is Expected to Drive the Market in South American Countries
10.5.2 Middle East
10.5.2.1 Pipeline and Oil & Gas Projects in the Middle East Will Propel the Demand for Hybrid Valves
10.5.3 Africa
10.5.3.1 Mining & Off-Shore Exploration Activities in Africa Will Drive the Market
11 Competitive Landscape (Page No. - 152)
11.1 Overview
11.2 Competitive Situations and Trends
11.2.1 Product Launches and Acquisitions
11.2.2 Agreements and Contracts
11.2.3 Others
11.3 Competitive Leadership Mapping
11.3.1 Visionary Leaders
11.3.2 Innovators
11.3.3 Dynamic Differentiators
11.3.4 Emerging Companies
11.4 Business Strategy Excellence (For All 25 Players)
11.5 Strength of Product Portfolio (For All 25 Players)
12 Company Profiles (Page No. - 160)
12.1 Introduction
12.2 Key Players
(Business Overview, Products Offered, Recent Developments, SWOT Analysis, and MnM View)*
12.2.1 IMI PLC
12.2.2 Emerson Electric Co.
12.2.3 Trillium Flow Technologies
12.2.4 Circor International Inc.
12.2.5 Parcol S.P.A
12.2.6 Koso Kent Introl Pvt. Ltd.
12.2.7 Wuxi Smart Auto-Control Co. Ltd.
12.2.8 Chemtrols Emet Pvt. Ltd
12.2.9 Dymet Alloys
12.2.10 Carter Process Control GmbH
* Business Overview, Products Offered, Recent Developments, SWOT Analysis, and MnM View Might Not Be Captured in Case of Unlisted Companies.
12.3 Other Important Key Players
12.3.1 Seed Technologies Corp., Ltd (Aseeder)
12.3.2 Penn United Technologies, Inc
12.3.3 Master Flo Valve Inc.
12.3.4 Electronica Tungsten Ltd.
12.3.5 Mascot Cavflo
12.3.6 Civacon
12.3.7 Automat Industries
12.3.8 Flowserve Corporation
12.3.9 L&T Valves
12.3.10 Metraflex
13 Appendix (Page No. - 184)
13.1 Insights of Industry Experts
13.2 Discussion Guide
13.3 Knowledge Store: Marketsandmarkets’ Subscription Portal
13.4 Available Customizations
13.5 Related Reports
13.6 Author Details
List of Tables (169 Tables)
Table 1 Assumptions for the Research Study
Table 2 Hybrid Valve Market Size, By Material, 2016–2024 (USD Million)
Table 3 Control Valve Market Size, By Material, 2016–2025 (USD Million)
Table 4 Market Size for Steel Material, By Size, 2016–2024 (USD Million)
Table 5 Hybrid Valve Market Size for Tungsten Carbide Material, By Size, 2016–2024 (USD Million)
Table 6 Market Size for Duplex Nickel Material, By Size, 2016–2024 (USD Million)
Table 7 Market Size for Titanium Material, By Size, 2016–2024 (USD Million)
Table 8 Market Size for Alloy Material, By Size, 2016–2024 (USD Million)
Table 9 Hybrid Valve Market Size for Other Materials, By Size, 2016–2024 (USD Million)
Table 10 Market Size, By Valve Size, 2016–2024 (USD Million)
Table 11 Control Valve Market Size, By Valve Size, 2016–2025 (USD Million)
Table 12 Rotary Control Valve Market Size, By Valve Size, 2016–2025 (USD Million)
Table 13 Linear Control Valve Market Size, By Valve Size, 2016–2025 (USD Million)
Table 14 Hybrid Valve Market Size for Valves Up to 1” in Size, By Material, 2016–2024 (USD Million)
Table 15 Market Size for Valves 1”–6” in Size, By Material, 2016–2024 (USD Million)
Table 16 Hybrid Valve Market Size for Valves 6”–25” in Size, By Material, 2016–2024 (USD Million)
Table 17 Market Size for Valves 25”–50” in Size, By Material, 2016–2024 (USD Million)
Table 18 Hybrid Valve Market Size for Valves 50” & Larger in Size, By Material, 2016–2024 (USD Million)
Table 19 Market Size, By End-Use Industry, 2016–2024 (USD Million)
Table 20 Control Valve Market Size, By End-Use Industry, 2016–2025 (USD Million)
Table 21 Oil Production and Consumption Trend, 2000–2018 (Thousand Barrels/Day)
Table 22 Natural Gas Production and Consumption Trend, 2000–2018 (Billion Cubic Meters)
Table 23 US: Oil Production and Consumption Trend, 2000–2018 (Thousand Barrels/Day)
Table 24 US: Natural Gas Production and Consumption Trend, 2000–2018 (Billion Cubic Meters)
Table 25 Canada: Oil Production and Consumption Trend, 2000–2018 (Thousand Barrels/Day)
Table 26 Canada: Natural Gas Production and Consumption Trend, 2000–2018 (Billion Cubic Meters)
Table 27 Mexico: Oil Production and Consumption Trend, 2000–2018 (Thousand Barrels/Day)
Table 28 Mexico: Natural Gas Production and Consumption Trend, 2000–2018 (Billion Cubic Meters)
Table 29 Hybrid Valve Market Size for the Oil & Gas Industry, By Region, 2016–2024 (USD Million)
Table 30 Control Valve Market Size for the Oil & Gas Industry, By Region, 2016–2025 (USD Million)
Table 31 North America: Market Size for the Oil & Gas Industry, By Country, 2016–2024 (USD Million)
Table 32 North America: Control Valve Market Size for the Oil & Gas Industry, By Country, 2016–2025 (USD Million)
Table 33 Europe: Market Size for the Oil & Gas Industry, By Country, 2016–2024 (USD Million)
Table 34 Europe: Control Valve Market Size for the Oil & Gas Industry, By Country, 2016–2025 (USD Million)
Table 35 Asia Pacific: Market Size for the Oil & Gas Industry, By Country, 2016–2024 (USD Million)
Table 36 Asia Pacific: Control Valve Market Size for the Oil & Gas Industry, By Country, 2016–2025 (USD Million)
Table 37 RoW: Market Size for the Oil & Gas Industry, By Country, 2016–2024 (USD Million)
Table 38 RoW: Control Valve Market Size for the Oil & Gas Industry, By Country, 2016–2025 (USD Million)
Table 39 Market Size for the Water & Wastewater Industry, By Region, 2016–2024 (USD Million)
Table 40 Control Valve Market Size for the Water & Wastewater Industry, By Region, 2016–2025 (USD Million)
Table 41 North America: Market Size for the Water & Wastewater Industry, By Country, 2016–2024 (USD Million)
Table 42 North America: Control Valve Market Size for the Water & Wastewater Industry, By Country, 2016–2025 (USD Million)
Table 43 Europe: Market Size for the Water & Wastewater Industry, By Country, 2016–2024 (USD Million)
Table 44 Europe: Control Valve Market Size for the Water & Wastewater Industry, By Country, 2016–2025 (USD Million)
Table 45 Asia Pacific: Market Size for the Water & Wastewater Industry, By Country, 2016–2024 (USD Million)
Table 46 APAC: Control Valve Market Size for the Water & Wastewater Industry, By Country, 2016–2025 (USD Million)
Table 47 RoW: Market Size for the Water & Wastewater Industry, By Region, 2016–2024 (USD Million)
Table 48 RoW: Control Valve Market Size for the Water & Wastewater Industry, By Region, 2016–2025 (USD Million)
Table 49 Coal Production and Consumption Trend, 2005–2015 (Million Tonnes)
Table 50 Hybrid Valve Market Size for the Energy & Power Industry, By Region, 2016–2024 (USD Million)
Table 51 Control Valve Market Size for the Energy & Power Industry, By Region, 2016–2025 (USD Million)
Table 52 North America: Control Valve Market Size for the Energy & Power Industry, By Country, 2016–2024 (USD Million)
Table 53 Europe: Market Size for the Energy & Power Industry, By Country, 2016–2024 (USD Million)
Table 54 Europe: Control Valve Market Size for the Energy & Power Industry, By Country, 2016–2024 (USD Million)
Table 55 Asia Pacific: Market Size for the Energy & Power Industry, By Country, 2016–2024 (USD Million)
Table 56 Asia Pacific: Control Valve Market Size for the Energy & Power Industry, By Country, 2016–2024 (USD Million)
Table 57 RoW: Market Size for the Energy & Power Industry, By Country, 2016–2024 (USD Million)
Table 58 RoW: Control Valve Market Size for the Energy & Power Industry, By Region, 2016–2024 (USD Million)
Table 59 Market Size for the Food & Beverage Industry, By Region, 2016–2024 (USD Million)
Table 60 Control Valve Market Size for the Food & Beverage Industry, By Region, 2016–2025 (USD Million)
Table 61 North America: Market Size for the Food & Beverage Industry, By Country, 2016–2024 (USD Million)
Table 62 Europe: Market Size for the Food & Beverage Industry, By Country, 2016–2024 (USD Million)
Table 63 Asia Pacific: Market Size for the Food & Beverage Industry, By Country, 2016–2024 (USD Million)
Table 64 RoW: Market Size for the Food & Beverage Industry, By Region, 2016–2024 (USD Million)
Table 65 Chemicals Production Market Size (1990–2020)
Table 66 Market Size for the Chemicals Industry, By Region, 2016–2024 (USD Million)
Table 67 Control Valve Market Size for the Chemicals Industry, By Region, 2016–2025 (USD Million)
Table 68 North America: Market Size for the Chemicals Industry, By Country, 2016–2024 (USD Million)
Table 69 North America: Control Valve Market Size for the Chemicals Industry, By Country, 2016–2025 (USD Million)
Table 70 Europe: Market Size for the Chemicals Industry, By Country, 2016–2024 (USD Million)
Table 71 Europe: Control Valve Market Size for the Chemicals Industry, By Country, 2016–2025 (USD Million)
Table 72 Asia Pacific: Market Size for the Chemicals Industry, By Country, 2016–2024 (USD Million)
Table 73 Asia Pacific: Control Valve Market Size for the Chemicals Industry, By Country, 2016–2025 (USD Million)
Table 74 RoW: Market Size for the Chemicals Industry, By Region, 2016–2024 (USD Million)
Table 75 RoW: Control Valve Market Size for the Chemicals Industry, By Region, 2016–2025 (USD Million)
Table 76 Pulp Production Data, By Region (%)
Table 77 Market Size for the Pulp & Paper Industry, By Region, 2016–2024 (USD Million)
Table 78 Control Valve Market Size for the Pulp & Paper Industry, By Region, 2016–2025 (USD Million)
Table 79 North America: Market Size for the Pulp & Paper Industry, By Country, 2016–2024 (USD Million)
Table 80 Europe: Market Size for the Pulp & Paper Industry, By Country, 2016–2024 (USD Million)
Table 81 Asia Pacific: Market Size for the Pulp & Paper Industry, By Country, 2016–2024 (USD Million)
Table 82 RoW: Market Size for the Pulp & Paper Industry, By Region, 2016–2024 (USD Million)
Table 83 Total Minerals Production, By Region (Metric Tonnes)
Table 84 Market Size for the Metals & Mining Industry, By Region, 2016–2024 (USD Million)
Table 85 Control Valve Market Size for the Metals & Mining Industry, By Region, 2016–2025 (USD Million)
Table 86 North America: Market Size for the Metals & Mining Industry, By Country, 2016–2024 (USD Million)
Table 87 Europe: Market Size for the Metals & Mining Industry, By Country, 2016–2024 (USD Million)
Table 88 Asia Pacific: Market Size for the Metals & Mining Industry, By Country, 2016–2024 (USD Million)
Table 89 RoW: Market Size for the Metals & Mining Industry, By Region, 2016–2024 (USD Million)
Table 90 Market Size for the Building & Construction Industry, By Region, 2016–2024 (USD Million)
Table 91 Control Valve Market Size for the Building & Construction Industry, By Region, 2016–2024 (USD Million)
Table 92 North America: Market Size for the Building & Construction Industry, By Country, 2016–2024 (USD Million)
Table 93 Europe: Market Size for the Building & Construction Industry, By Country, 2016–2024 (USD Million)
Table 94 Asia Pacific: Market Size for the Building & Construction Industry, By Country, 2016–2024 (USD Million)
Table 95 RoW: Hybrid Valve Market Size for the Building & Construction Industry, By Region, 2016–2024 (USD Million)
Table 96 Pharmaceuticals R&D Expenditure (USD Million)
Table 97 Market Size for the Pharmaceuticals Industry, By Region, 2016–2024 (USD Million)
Table 98 Control Valve Market Size for the Pharmaceuticals Industry, By Region, 2016–2025 (USD Million)
Table 99 North America: Market Size for the Pharmaceuticals Industry, By Country, 2016–2024 (USD Million)
Table 100 Europe: Market Size for the Pharmaceuticals Industry, By Country, 2016–2024 (USD Million)
Table 101 Asia Pacific: Market Size for the Pharmaceuticals Industry, By Country, 2016–2024 (USD Million)
Table 102 RoW: Market Size for the Pharmaceuticals Industry, By Region, 2016–2024 (USD Million)
Table 103 Market Size for the Agriculture Industry, By Region, 2016–2024 (USD Thousand)
Table 104 North America: Market Size for the Agriculture Industry, By Country, 2016–2024 (USD Thousand)
Table 105 Europe: Market Size for the Agriculture Industry, By Country, 2016–2024 (USD Thousand)
Table 106 Asia Pacific: Market Size for the Agriculture Industry, By Country, 2016–2024 (USD Thousand)
Table 107 RoW: Market Size for the Agriculture Industry, By Region, 2016–2024 (USD Thousand)
Table 108 Market Size for Other Industries, By Region, 2016–2024 (USD Million)
Table 109 Control Valve Market Size for Other Industries, By Region, 2016–2025 (USD Million)
Table 110 North America: Market Size for Other Industries, By Country, 2016–2024 (USD Thousand)
Table 111 Europe: Market Size for Other Industries, By Country, 2016–2024 (USD Million)
Table 112 Asia Pacific: Market Size for Other Industries, By Country, 2016–2024 (USD Million)
Table 113 RoW: Market Size for Other Industries, By Region, 2016–2024 (USD Million)
Table 114 Market Size, By Region, 2016–2024 (USD Million)
Table 115 Control Valve Market Size, By Region, 2016–2025 (USD Million)
Table 116 Market Size, By End-Use Industry, 2016–2024 (USD Million)
Table 117 Control Valve Market Size, By End-Use Industry, 2016–2025 (USD Million)
Table 118 Market Size, By Country, 2016–2024 (USD Million)
Table 119 US: Market Size, By End-Use Industry, 2016–2024 (USD Thousand)
Table 120 US: Control Valve Market Size, By End-Use Industry, 2016–2025 (USD Million)
Table 121 Canada: Market Size, By End-Use Industry, 2016–2024 (USD Thousand)
Table 122 Canada: Control Valve Market Size, By End-Use Industry, 2016–2025 (USD Million)
Table 123 Mexico: Market Size, By End-Use Industry, 2016–2024 (USD Thousand)
Table 124 Mexico: Control Valve Market Size, By End-Use Industry, 2016–2025 (USD Million)
Table 125 Europe: Market Size, By End-Use Industry, 2016–2024 (USD Million)
Table 126 Europe: Control Valve Market Size, By End-Use Industry, 2016–2025 (USD Million)
Table 127 Europe: Market Size, By Country, 2016–2024 (USD Million)
Table 128 Germany: Market Size, By End-Use Industry, 2016–2024 (USD Thousand)
Table 129 Germany: Control Valve Market Size, By End-Use Industry, 2016–2025 (USD Million)
Table 130 UK: Oil & Gas Production Data, 2000–2018
Table 131 UK: Market Size, By End-Use Industry, 2016–2024 (USD Thousand)
Table 132 UK: Control Valve Market Size, By End-Use Industry, 2016–2025 (USD Million)
Table 133 France: Market Size, By End-Use Industry, 2016–2024 (USD Thousand)
Table 134 France: Control Valve Market Size, By End-Use Industry, 2016–2025 (USD Million)
Table 135 Italy: Oil & Gas Production Data, 2000–2018
Table 136 Italy: Market Size, By End-Use Industry, 2016–2024 (USD Thousand)
Table 137 Italy: Control Valve Market Size, By End-Use Industry, 2016–2025 (USD Million)
Table 138 Rest of Europe: Market Size, By End-Use Industry, 2016–2024 (USD Thousand)
Table 139 Rest of Europe: Control Valve Market Size, By End-Use Industry, 2016–2025 (USD Million)
Table 140 Asia Pacific: Market Size, By End-Use Industry, 2016–2024 (USD Million)
Table 141 Asia Pacific: Control Valve Market Size, By End-Use Industry, 2016–2025 (USD Million)
Table 142 Asia Pacific: Market Size, By Country, 2016–2024 (USD Million)
Table 143 China: Oil & Gas Production Data, 2000–2018
Table 144 China: Market Size, By End-Use Industry, 2016–2024 (USD Million)
Table 145 China: Control Valve Market Size, By End-Use Industry, 2016–2025 (USD Million)
Table 146 Japan: Market Size, By End-Use Industry, 2016–2024 (USD Million)
Table 147 Japan: Control Valve Market Size, By End-Use Industry, 2016–2025 (USD Million)
Table 148 South Korea: Market Size, By End-Use Industry, 2016–2024 (USD Million)
Table 149 South Korea: Control Valve Market Size, By End-Use Industry, 2016–2025 (USD Million)
Table 150 India: Oil & Gas Production Data, 2000–2018
Table 151 India: Hybrid Valve Market Size, By End-Use Industry, 2016–2024 (USD Million)
Table 152 India: Control Valve Market Size, By End-Use Industry, 2016–2025 (USD Million)
Table 153 Rest of Asia Pacific: Market Size, By End-Use Industry, 2016–2024 (USD Million)
Table 154 Rest of Asia Pacific: Control Valve Market Size, By End-Use Industry, 2016–2025 (USD Million)
Table 155 RoW: Hybrid Valve Market Size, By End-Use Industry, 2016–2024 (USD Million)
Table 156 RoW: Control Valve Market Size, By End-Use Industry, 2016–2025 (USD Million)
Table 157 Market Size, By Region, 2016–2024 (USD Million)
Table 158 South America: Oil & Gas Production Data, 2000–2018
Table 159 South America: Market Size, By End-Use Industry, 2016–2024 (USD Million)
Table 160 South America: Control Valve Market Size, By End-Use Industry, 2016–2025 (USD Million)
Table 161 Middle East: Oil & Gas Production Data, 2000–2018
Table 162 Middle East: Market Size, By End-Use Industry, 2016–2024 (USD Million)
Table 163 Middle East: Control Valve Market Size, By End-Use Industry, 2016–2025 (USD Million)
Table 164 Africa: Oil & Gas Production Data, 2000–2018
Table 165 Africa: Market Size, By End-Use Industry, 2016–2024 (USD Thousand)
Table 166 Africa: Control Valve Market Size, By End-Use Industry, 2016–2025 (USD Million)
Table 167 Top 5 Product Launches (2015–2019)
Table 168 Top 3 Agreements and Contracts (2015–2018)
Table 169 Top 3 Acquisitions and Partnerships (2015–2019)
List of Figures (41 Figures)
Figure 1 Hybrid Valve Market Segmentation
Figure 2 Market: Research Design
Figure 3 Market Size Estimation Methodology: Bottom-Up Approach
Figure 4 Market Size Estimation Methodology: Top-Down Approach
Figure 5 Data Triangulation
Figure 6 Hybrid Valve Market Size, 2016–2024 (USD Million)
Figure 7 The Market Segment for Hybrid Valve 1’’–6” in Size is Projected to Account for the Largest Share By 2024
Figure 8 Market, By Material, 2019 vs 2024 (USD Million)
Figure 9 Oil & Gas Industry is Projected to Dominate the Market During the Forecast Period
Figure 10 Asia Pacific Accounted for the Largest Market Share in 2018
Figure 11 Increasing Demand for Hybrid Valves in Asia Pacific Driving Market Growth
Figure 12 Steel Segment is Projected to Grow at the Highest CAGR During Forecast Period
Figure 13 Energy & Power Industry is Projected to Account for the Largest Share By 2024
Figure 14 Hybrid Valve 1” – 6” in Size is Projected to Account for the Largest Share During the Forecast Period
Figure 15 US is Estimated to Account for the Largest Share in 2019
Figure 16 Market Dynamics of the Market
Figure 17 Impact of 3D Printing on the Valve Manufacturing Industry
Figure 18 3D Printing Impact on the Overall Valve Industry
Figure 19 Rise is the Number of Plants Resulting in the Increase in Production
Figure 20 Value Chain Analysis: Key Value Added During the Raw Material & Component Supplier and Original Equipment Manufacturing Phase
Figure 21 Market, By Material
Figure 22 Steel Segment is Projected to Account for the Largest Market Share By 2024
Figure 23 Hybrid Valve Market, By Valve Size
Figure 24 Hybrid Valve 1”–6” in Size is Projected to Dominate the Market By 2024
Figure 25 Market, By End-Use Industry
Figure 26 Market, By End-Use Industry, 2019 vs 2024 (USD Million)
Figure 27 Global Gas Production, 2008 vs 2018 (Billion Cubic Meters)
Figure 28 Expansions and Renovations of Food & Beverage Plants (2009–2018)
Figure 29 Worldwide Medical Device Forecast Up to 2020
Figure 30 The Market is Projected to Witness Significant Growth in China, Japan, and India During the Forecast Period
Figure 31 North America: Market Snapshot
Figure 32 Oil & Gas Production Trend in the Us, 2007–2017 (Thousand Barrels Per Day)
Figure 33 Europe: Hybrid Valve Market Snapshot
Figure 34 Asia Pacific: Market Snapshot
Figure 35 Organic and Inorganic Strategies Adopted By Companies Operating in the Market
Figure 36 Major Hybrid Valve Manufacturers
Figure 37 Major Disc Manufacturers
Figure 38 Market (Global): Competitive Leadership Mapping, 2018
Figure 39 IMI PLC: Company Snapshot
Figure 40 Emerson Electric Co.: Company Snapshot
Figure 41 Circor International Inc.: Company Snapshot
The study involved four major activities in estimating the current market size for hybrid valves. Exhaustive secondary research was done to collect information on the market and its peer and parent markets. The next step was to validate these findings, assumptions, and sizing with industry experts across the value chain through primary research. Both top-down and bottom-up approaches were employed to estimate the complete market size. After that, market breakdown and data triangulation were employed to estimate the market size of segments and subsegments.
Secondary Research
In the secondary research process, various secondary sources have been referred to for identifying and collecting information important for this study. These secondary sources include valve magazines, valve association data, IEEE journals; annual reports, press releases, and investor presentations of companies; white papers; certified publications and articles from recognized authors; and directories and databases such as Factiva, Hoovers, and OneSource.
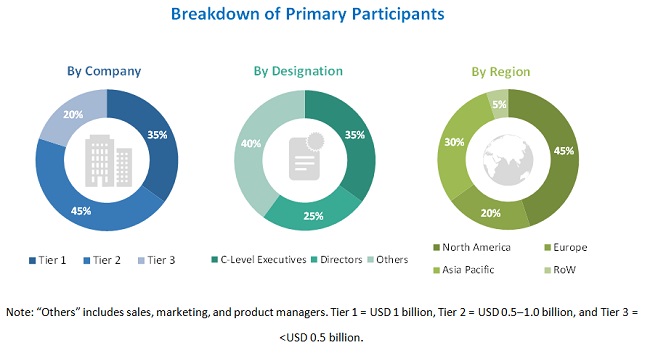
Primary Research
In the primary research process, various primary sources from both supply and demand sides have been interviewed to obtain qualitative and quantitative information important for this report. The primary sources from the supply side included industry experts such as CEOs, VPs, marketing directors, technology and innovation directors, and related executives from key companies and organizations operating in the hybrid valve market. After complete market engineering (including calculations regarding market statistics, market breakdown, market size estimations, market forecasting, and data triangulation), extensive primary research was conducted to gather information, as well as verify and validate the critical numbers arrived at.
To know about the assumptions considered for the study, download the pdf brochure
Market Size Estimation
In the complete market engineering process, both top-down and bottom-up approaches have been implemented, along with several data triangulation methods, to estimate and validate the size of the hybrid valve market and other dependent submarkets listed in this report.
- Key players in the industry and markets have been identified through extensive secondary research.
- In terms of value, the industry’s supply chain and market size have been determined through primary and secondary research processes.
- All percentage shares, splits, and breakdowns have been determined using secondary sources and verified through primary sources.
Data Triangulation
After arriving at the overall market size from the estimation process explained above, the market has been split into several segments and subsegments. To complete the overall market engineering process and arrive at the exact statistics for all segments and subsegments, market breakdown and data triangulation procedures have been employed wherever applicable. The data have been triangulated by studying various factors and trends identified from both demand and supply sides in industrial and nonindustrial verticals.
Report Objectives
The following are the major objectives of the study.
- To describe and forecast the hybrid valve market, in terms of material, size, industry, and geography
- To describe and forecast the market, in terms of value, by region, which includes North America, Asia Pacific, Europe, Rest of the World (RoW)
- To provide detailed information regarding the major factors influencing market growth (drivers, restraints, opportunities, and challenges)
- To study the complete value chain of the hybrid valve and analyze current and future market trends
- To strategically analyze the micromarkets1, in terms of individual growth trends, prospects, and their contributions to the overall market
- To analyze opportunities in the market for stakeholders by identifying high-growth segments of the hybrid valve ecosystem
- To strategically profile key players and comprehensively analyze their market positions, in terms of ranking and core competencies2, along with detailing competitive landscape for market leaders
- To benchmark the players in the market using the proprietary competitive leadership mapping, which analyzes market players on various parameters within the broad categories of business and product strategies
- To analyze strategic approaches such as product launches, acquisitions, collaborations, contracts, agreements, expansions, and partnerships in the market
Available Customizations
With the given market data, MarketsandMarkets offers customizations according to a company’s specific needs. The following customization options are available for the report:
Company Information:
- Detailed analysis and profiling of additional market players (up to 5)


Growth opportunities and latent adjacency in Hybrid Valve Market