In-store Analytics Market by Application (Marketing Management, Customer Management, Merchandising Analysis, Store Operations Management, and Risk and Compliance Management), Component, Deployment, Organization Size, and Region - Global Forecast to 2023


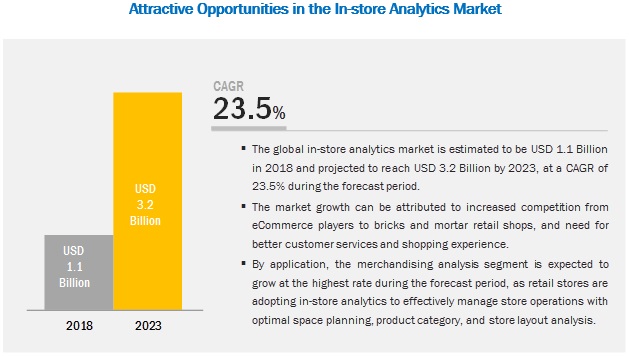
[124 Pages Report] The in-store analytics market expected to grow from USD 1.1 billion in 2018 to USD 3.2 billion by 2023, at a Compound Annual Growth Rate (CAGR) of 23.5% during the forecast period.
Factors such as a rise in the data volume around in-store operations increased competition from eCommerce players to bricks and mortar retail shops and need for better customer services and shopping experience are expected to drive the adoption of in-store analytics software and services. Moreover, the penetration of smartphones and the Internet, high growth potential in emerging economies, and the advent of cloud-based analytics are expected to create ample opportunities for in-store analytics solution vendors.
Software segment to hold a larger market size during the forecast period
The in-store analytics market by component covers software and services. The software segment outperforms the services segment and would see growth in the future, due to higher adoption of software. The in-store analytics software enables stores to monitor sales for identifying customer preferences and developing business plans accordingly. Through early identification of trends and anomalies, stores can also predict risks, such as shoplifting and OOS situations. Furthermore, emerging technologies, such as AI, and integration capabilities of in-store analytics software have facilitated prediction of customer demand in real time.
Consulting segment to grow at the highest CAGR during the forecast period
Consulting services mainly steer around the critical issues and opportunities related to strategies, marketing, operations, technologies, mergers and acquisitions, and finance, leading to increased effectiveness, improved performance, reduced costs, and enhanced resilience. Consulting services are required by retail stores, retail planners, and merchandisers for enhanced strategic outlook, improved performance efficiencies, and transformed business operations of retail-related activities into more efficient and cost-effective operations.
On-premises deployment model to grow at a higher CAGR during the forecast period
The on-premises solution provides organizations with full control over the platform, applications, systems, and data, and these can be handled and managed by the organization�s own IT staff. The growth of the on-premises deployment model is mainly attributed to the flexibility for customizing the software as per an organization�s dynamic requirements. The store that handles customers� credentials would prefer the on-premises deployment model, as the systems can be controlled by the organization�s staff themselves. Retail stores where data security and privacy is the main concern usually follow the on-premises deployment model.
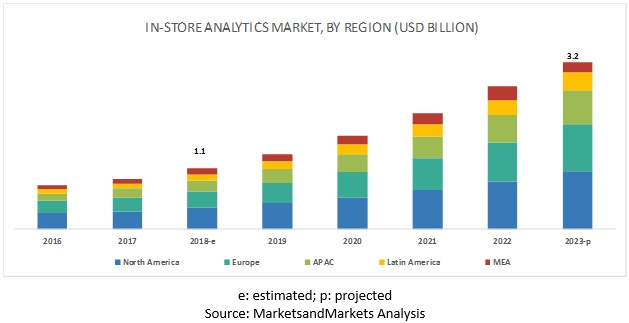
North America to account for the largest market size during the forecast period
The global in-store analytics market by region covers 5 major geographic regions, namely, North America, Asia Pacific (APAC), Europe, Middle East and Africa (MEA), and Latin America. North America is expected to account for the largest market size during the forecast period. The adoption of in-store analytics solutions is expected to be the highest in North America, as compared to the other regions. This is mainly because of the presence of various developed economies, such as Canada and US, and the increasing focus on innovations obtained from R&D and technology. The retail market in the US is one of the largest with the presence of retail giants.
Key Players
The in-store analytics market comprises major solution providers, such as RetailNext (US), SAP (Germany), Thinkinside (Italy), Mindtree (India), Happiest Minds (India), Celect (US), Capillary Technologies (Singapore), Scanalytics (US), Inpixon (US), Retail Solutions (US), Dor Technologies (US), SEMSEYE (Lithuania), InvenSense (US), Walkbase (Finland), and Amoobi (Belgium).
The study includes an in-depth competitive analysis of these key players in the in-store analytics market with their company profiles, recent developments, and key market strategies.
Scope of the report
|
Report Metric |
Details |
|
Market size available for years |
2016�2023 |
|
Base year considered |
2017 |
|
Forecast period |
2018�2023 |
|
Forecast units |
Million (USD) |
|
Segments covered |
Component, Application, Deployment Model, Organization Size, and Region |
|
Geographies covered |
North America, APAC, Europe, Latin America, and MEA |
|
Companies covered |
RetailNext (US), SAP (Germany), Thinkinside (Italy), Mindtree (India), Happiest Minds (India), Celect (US), Capillary Technologies (Singapore), Scanalytics (US), Inpixon (US), Retail Solutions (US), Dor Technologies (US), SEMSEYE (Lithuania), InvenSense (US), Walkbase (Finland), and Amoobi (Belgium) |
This research report categorizes the in-store analytics market based on component, application, deployment model, organization size, and region.
Based on Components, the market has been segmented as follows:
- Software
- Services
- Managed Services
- Professional Services
- Support and Maintenance
- Consulting
Based on Applications, the in-store analytics market has been segmented as follows:
- Customer Management
- Marketing Management
- Merchandising Analysis
- Store Operations Management
- Risk and Compliance Management
- Others (Quality Management, and BI and reporting)
Based on Deployment Models, the market has been segmented as follows
- On-premises
- Cloud
Based on Organization Sizes, the in-store analytics market has been segmented as follows
- SMEs
- Large Enterprises
Based on regions, the market has been segmented as follows:
- North America
- US
- Canada
- Europe
- UK
- Germany
- France
- Rest of Europe
- APAC
- China
- Japan
- India
- Rest of APAC
- MEA
- Middle East
- Africa
- Latin America
- Mexico
- Brazil
- Rest of Latin America
Recent Developments:
- In January 2019, Thinkinside added a new module, Funnel Analysis, in its in-store analytics platform, RetailerIN. This module enables supermarket and grocery stores to fully analyze the complete shopping funnel by integrating sales data.
Key Questions addressed by the report:
- What are the opportunities in the in-store analytics market?
- What is the competitive landscape in the market?
- What are the emerging technologies impacting the overall market?
- What are the key use cases existing in the market?
- What are the key trends and dynamics existing in the market?
Frequently Asked Questions (FAQ):
What is In-store Analytics?
What are the top vendors in in-store analytics market?
What are the benefits of in-store analytics?
In-store analytics gives retailers a real-time look at what customers do when they visit a store. This allows for a deeper understanding of the customer, helping retail managers make informed business decisions. Some of the most common advantages include:
- Understanding customer needs:
- Better product replacement
- Improving store design to guide footfall to desired areas or products
- Improving the street capture rate from people who pass the store
- Marketing attribution
- Number of visits/ times of day
- Number of new vs. known visitors
- Different advertisement methods and their effect on visits
- Different ad placements or locations and their effect on visits
- Advertising effect on hit rate and average purchases
- Personalized in-store experiences
- Send a personalized coupon on entrance
- Suggest retrieving an abandoned shopping cart from e-commerce sessions
- Personalize digital signage displays with last browsed products
- Personalize in-store personnel service gestures
What are the regulations impacting the In-store Analytics Market?
To speak to our analyst for a discussion on the above findings, click Speak to Analyst
 Exclusive indicates content/data unique to MarketsandMarkets and not available with any competitors.
Table of Contents
1 Introduction (Page No. - 17)
1.1 Objectives of the Study
1.2 Market Definition
1.3 Market Scope
1.4 Years Considered for the Study
1.5 Currency Considered
1.6 Stakeholders
2 Research Methodology (Page No. - 21)
2.1 Research Data
2.1.1 Secondary Data
2.1.2 Primary Data
2.1.2.1 Breakup of Primaries
2.1.2.2 Key Industry Insights
2.2 Market Breakup and Data Triangulation
2.3 Market Size Estimation
2.4 Market Forecast
2.5 Microquadrant Research Methodology
2.5.1 Vendor Inclusion Criteria
2.6 Research Assumptions
2.7 Limitations
3 Executive Summary (Page No. - 29)
4 Premium Insights (Page No. - 34)
4.1 Attractive Market Opportunities in the In-Store Analytics Market
4.2 Market By Application (2018�2023)
4.3 Market By Organization Size (2018�2023)
4.4 Market Share Across Regions
5 Market Overview and Industry Trends (Page No. - 36)
5.1 Introduction
5.2 Market Dynamics
5.2.1 Drivers
5.2.1.1 Increased Competition From Ecommerce Players
5.2.1.2 Need for Better Customer Service and Enhanced Shopping Experience
5.2.1.3 Rising Data Volume Around In-Store Operations
5.2.2 Restraints
5.2.2.1 Data Security and Privacy Concerns Over New Advanced Technologies
5.2.2.2 Lack of Skilled Personnel
5.2.3 Opportunities
5.2.3.1 Advent of Cloud-Based Analytics
5.2.3.2 High Growth Potential in Emerging Economies
5.2.4 Challenges
5.2.4.1 Reluctance of Retailers
5.3 Industry Trends
5.3.1 Use Cases
5.3.1.1 Use Case 1: Increasing Profits By Leveraging Store Inventories
5.3.1.2 Use Case 2: Understanding Customer Behavior to Enhance Revenue and Profitability
5.3.1.3 Use Case 3: Tracking Engagement Metrics and Monitoring Customer Behavior in Real Time
5.3.2 Impact of AI and ML on the Market
5.3.3 In-Store Analytics Process
6 In-Store Analytics Market By Component (Page No. - 43)
6.1 Introduction
6.2 Software
6.2.1 Need for Leveraging Distinct Data to Enhance Customer Retention and Store Profitability
6.3 Services
6.3.1 Professional Services
6.3.1.1 Support and Maintenance Services
6.3.1.1.1 Complexity of Operations and the Need for Regular Assistance During the Software Lifecycle to Foster the Growth of Support and Maintenance Services
6.3.1.2 Consulting Services
6.3.1.2.1 Need for A Strategic Outlook Exploring New Avenues for Improving Business Performance to Drive the Growth of Consulting Services
6.3.2 Managed Services
6.3.2.1 Need for Monitoring and Maintaining Software Operations and Reducing Overhead Costs
7 In-Store Analytics Market By Application (Page No. - 51)
7.1 Introduction
7.2 Customer Management
7.2.1 Customer Footfall Analysis
7.2.1.1 Monitoring and Measuring Footfalls to Identify Various Sales Opportunities
7.2.2 Customer Behavioral Analysis
7.2.2.1 Understanding Customer Behavior to Discover Pain Points Affecting Customer Behavior
7.2.3 Customer Service
7.2.3.1 Assisting Customers in Enhancing Customer Experience and Improving Customer Retention
7.3 Marketing Management
7.3.1 Campaign Management
7.3.1.1 Improving Customer Experience Through Customized Campaigns
7.3.2 Loyalty Management
7.3.2.1 Initiating Loyalty Programs to Target the Mass Market
7.3.3 Cross-Sell and Upsell and Point of Sale
7.3.3.1 Generating Additional Revenues and Increasing Customer Lifetime Value
7.3.4 Market Basket Analysis
7.3.4.1 Identifying Correlation Among Products to Provide Real-Time Recommendations
7.4 Merchandising Analysis
7.4.1 Space Planning and Optimization
7.4.1.1 Optimizing Spaces to Improve Operational Efficiency
7.4.2 Product Category Analysis
7.4.2.1 Categorizing Products of Similar Nature and Attributes
7.4.3 Store Layout Analysis
7.4.3.1 Optimizing Store Layout for Maximum Utilization of Floor Space
7.5 Store Operations Management
7.5.1 Workforce Optimization
7.5.1.1 Scheduling Tasks and Utilizing Workforce to Improve the Overall Efficiency
7.5.2 Top-Performing Categories and Product Identification
7.5.2.1 Predicting Customer Demands and Top Performing Categories to Drive Sales and Profitability
7.5.3 Inventory Management
7.5.3.1 Managing Inventory to Identify Non-Performing Products and Prevent Out-Of-Stock Situations
7.6 Risk and Compliance Management
7.6.1 Fraud Detection
7.6.1.1 Real-Time Recognition of Suspicious Activities to Safeguard Confidential Information
7.7 Others
8 Market By Deployment Model (Page No. - 60)
8.1 Introduction
8.2 Cloud
8.2.1 Improved Flexibility and Scalability to Drive the Growth of Cloud-Based In-Store Analytics Software
8.3 On-Premises
8.3.1 Data Security and Privacy Requirements to Remain Factors Dominating On-Premises In-Store Analytics Solutions
9 In-Store Analytics Market By Organization Size (Page No. - 64)
9.1 Introduction
9.2 Small and Medium-Sized Enterprises
9.2.1 Demand for Analytics Software With Low Operational Costs
9.3 Large Enterprises
9.3.1 Need for Leveraging Voluminous Data to Stay Competitive
10 Market By Region (Page No. - 68)
10.1 Introduction
10.2 North America
10.2.1 United States
10.2.1.1 Notable Technology Spending and Presence of A Large Number of Retailers to Bolster the Growth of Market in the United States
10.2.2 Canada
10.2.2.1 Demand for Comprehensive Marketing, Footfall Measurement, and Enhanced Customer Engagement to Propel the Market Growth
10.3 Europe
10.3.1 United Kingdom
10.3.1.1 Increasing Technology Adoption and Various Government Initiatives to Fuel the Growth of Market in the United Kingdom
10.3.2 Germany
10.3.2.1 Need for Maintaining A Competitive Edge to Drive the Adoption of Advanced Technologies, Such as In-Store Analytics, in Germany
10.3.3 France
10.3.3.1 Expansion of In-Store Analytics Vendors in France to Open New Avenues for In-Store Analytics
10.3.4 Rest of Europe
10.4 Asia Pacific
10.4.1 China
10.4.1.1 Steady Income Growth and Growing Retail Market to Drive the Implementation of In-Store Analytics in China
10.4.2 Japan
10.4.2.1 Expansion of the Retail Industry and Its Inclination Toward Emerging Technologies to Fuel the Growth of In-Store Analytics Market in Japan
10.4.3 India
10.4.3.1 Partnerships of Brick and Mortar Retailers With Leading Analytics Solution Providers to Further Bolster the Adoption of In-Store Analytics in India
10.4.4 Rest of Asia Pacific
10.5 Middle East and Africa
10.5.1 Middle East
10.5.1.1 Price Consciousness and High Purchasing Power of People to Fuel the Growth of Market Among Retailers in the Middle East
10.5.2 Africa
10.5.2.1 Making Well-Informed Business Decisions to Increase Basket Size and Footfall Driving the Growth of Market in Africa
10.6 Latin America
10.6.1 Mexico
10.6.1.1 Need to Curb Decreasing Roi and Increase Profitability Fueling the Growth of Market in Mexico
10.6.2 Brazil
10.6.2.1 Need for One-Step Pricing and Customer Engagement Solution to Propel the Growth of Market in Brazil
10.6.3 Rest of Latin America
11 Competitive Landscape (Page No. - 88)
11.1 Microquadrant Overview
11.1.1 Visionaries
11.1.2 Innovators
11.1.3 Dynamic Differentiators
11.1.4 Emerging Companies
11.2 Competitive Benchmarking
11.2.1 Strength of Product Offerings of Major Players in the Market
11.2.2 Business Strategy Excellence of Major Players in the In-Store Analytics Market
11.3 Market Ranking
12 Company Profiles (Page No. - 93)
(Business Overview, Products Offered, Recent Developments, SWOT Analysis & MnM View)*
12.1 Introduction
12.2 RetailNext
12.3 Mindtree
12.4 Thinkinside
12.5 Happiest Minds
12.6 SAP
12.7 Celect
12.8 Capillary Technologies
12.9 Inpixon
12.10 Scanalytics
12.11 Retail Solutions
12.12 Dor Technologies
12.13 SEMSEYE
12.14 InvenSense
12.15 Walkbase
12.16 Amoobi
*Details on Business Overview, Products Offered, Recent Developments, SWOT Analysis & MnM View Might Not Be Captured in Case of Unlisted Companies.
13 Appendix (Page No. - 118)
13.1 Discussion Guide
13.2 Knowledge Store: Marketsandmarkets� Subscription Portal
13.3 Available Customization
13.4 Related Reports
13.5 Author Details
List of Tables (57 Tables)
Table 1 United States Dollar Exchange Rate, 2015�2017
Table 2 Factor Analysis
Table 3 Evaluation Criteria
Table 4 In-Store Analytics Market Size and Growth Rate, 2016�2023 (USD Million, Y-O-Y %)
Table 5 Market Size By Component, 2016�2023 (USD Million)
Table 6 Software: Market Size By Region, 2016�2023 (USD Million)
Table 7 Market Size By Service, 2016�2023 (USD Million)
Table 8 Services: Market Size By Region, 2016�2023 (USD Million)
Table 9 Market Size, By Professional Service, 2016�2023 (USD Million)
Table 10 Professional Services: Market Size By Region, 2016�2023 (USD Million)
Table 11 Support and Maintenance Services: Market Size By Region, 2016�2023 (USD Million)
Table 12 Consulting Services: Market Size By Region, 2016�2023 (USD Million)
Table 13 Managed Services: Market Size By Region, 2016�2023 (USD Million)
Table 14 In-Store Analytics Market Size, By Application, 2016�2023 (USD Million)
Table 15 Customer Management: Market Size By Region, 2016�2023 (USD Million)
Table 16 Marketing Management: Market Size By Region, 2016�2023 (USD Million)
Table 17 Merchandising Analysis: Market Size By Region, 2016�2023 (USD Million)
Table 18 Store Operations Management: Market Size By Region, 2016�2023 (USD Million)
Table 19 Risk and Compliance Management: Market Size By Region, 2016�2023 (USD Million)
Table 20 Others: Market Size By Region, 2016�2023 (USD Million)
Table 21 Market Size, By Deployment Model, 2016�2023 (USD Million)
Table 22 Cloud: Market Size By Region, 2016�2023 (USD Million)
Table 23 On-Premises: Market Size By Region, 2016�2023 (USD Million)
Table 24 Market Size By Organization Size, 2016�2023 (USD Million)
Table 25 Small and Medium-Sized Enterprises: Market Size By Region, 2016�2023 (USD Million)
Table 26 Large Enterprises: Market Size By Region, 2016�2023 (USD Million)
Table 27 In-Store Analytics Market Size, By Region, 2016�2023 (USD Million)
Table 28 North America: Market Size By Component, 2016�2023 (USD Million)
Table 29 North America: Market Size By Service, 2016�2023 (USD Million)
Table 30 North America: Market Size By Application, 2016�2023 (USD Million)
Table 31 North America: Market Size By Deployment Model, 2016�2023 (USD Million)
Table 32 North America: Market Size By Organization Size, 2016�2023 (USD Million)
Table 33 North America: Market Size By Country, 2016�2023 (USD Million)
Table 34 Europe: In-Store Analytics Market Size, By Component, 2016�2023 (USD Million)
Table 35 Europe: Market Size By Service, 2016�2023 (USD Million)
Table 36 Europe: Market Size By Application, 2016�2023 (USD Million)
Table 37 Europe: Market Size By Deployment Model, 2016�2023 (USD Million)
Table 38 Europe: Market Size By Organization Size, 2016�2023 (USD Million)
Table 39 Europe: Market Size By Country, 2016�2023 (USD Million)
Table 40 Asia Pacific: Market Size, By Component, 2016�2023 (USD Million)
Table 41 Asia Pacific: Market Size By Service, 2016�2023 (USD Million)
Table 42 Asia Pacific: Market Size By Application, 2016�2023 (USD Million)
Table 43 Asia Pacific: Market Size By Deployment Model, 2016�2023 (USD Million)
Table 44 Asia Pacific: Market Size By Organization Size, 2016�2023 (USD Million)
Table 45 Asia Pacific: Market Size By Country, 2016�2023 (USD Million)
Table 46 Middle East and Africa: In-Store Analytics Market Size, By Component, 2016�2023 (USD Million)
Table 47 Middle East and Africa: Market Size By Service, 2016�2023 (USD Million)
Table 48 Middle East and Africa: Market Size By Application, 2016�2023 (USD Million)
Table 49 Middle East and Africa: Market Size By Deployment Model, 2016�2023 (USD Million)
Table 50 Middle East and Africa: Market Size By Organization Size, 2016�2023 (USD Million)
Table 51 Middle East and Africa: Market Size By Sub Region, 2016�2023 (USD Million)
Table 52 Latin America: In-Store Analytics Market Size, By Component, 2016�2023 (USD Million)
Table 53 Latin America: Market Size By Service, 2016�2023 (USD Million)
Table 54 Latin America: Market Size By Application, 2016�2023 (USD Million)
Table 55 Latin America: Market Size By Deployment Model, 2016�2023 (USD Million)
Table 56 Latin America: Market Size By Organization Size, 2016�2023 (USD Million)
Table 57 Latin America: Market Size By Country, 2016�2023 (USD Million)
List of Figures (33 Figures)
Figure 1 Market Segmentation
Figure 2 Regions Covered
Figure 3 Global In-Store Analytics Market: Research Design
Figure 4 Market Estimation and Forecast Methodology
Figure 5 Market Overview
Figure 6 Market to Witness High Growth During the Forecast Period
Figure 7 Market By Component (2018 vs 2023)
Figure 8 Market By Deployment Model (2018�2023)
Figure 9 Increasing Need to Analyze Consumer Data in Real-Time for Making Informed Decisions to Drive the In-Store Analytics Market Growth
Figure 10 Merchandising Analysis Segment to Grow at the Highest CAGR During the Forecast Period
Figure 11 Large Enterprises Segment to Hold A Higher Market Share During the Forecast Period
Figure 12 North America to Account for the Highest Market Share in 2018
Figure 13 Drivers, Restraints, Opportunities, and Challenges: In-Store Analytics Market
Figure 14 In-Store Analytics Process
Figure 15 Services Segment to Grow at A Higher CAGR During the Forecast Period
Figure 16 Managed Services Segment to Grow at A Higher CAGR During the Forecast Period
Figure 17 Consulting Services Segment to Grow at A Higher CAGR During the Forecast Period
Figure 18 Merchandising Analysis Segment to Grow at the Highest CAGR During the Forecast Period
Figure 19 On-Premises Segment to Grow at A Higher CAGR During the Forecast Period
Figure 20 Small and Medium-Sized Enterprises Segment to Grow at A Higher CAGR During the Forecast Period
Figure 21 Asia Pacific to Grow at the Highest CAGR During the Forecast Period
Figure 22 North America: Market Snapshot
Figure 23 Asia Pacific: Market Snapshot
Figure 24 In-Store Analytics, Competitive Leadership Mapping, 2018
Figure 25 Ranking of Key Players in the In-Store Analytics Market, 2018
Figure 26 RetailNext: SWOT Analysis
Figure 27 Mindtree: Company Snapshot
Figure 28 Mindtree: SWOT Analysis
Figure 29 Thinkinside: SWOT Analysis
Figure 30 Happiest Minds: SWOT Analysis
Figure 31 SAP: Company Snapshot
Figure 32 SAP: SWOT Analysis
Figure 33 Inpixon: Company Snapshot
The study involved 4 major activities in estimating the current market size for in-store analytics software and services. Exhaustive secondary research was done to collect information on the market, peer market, and parent market. The next step was to validate these findings, assumptions, and sizing with the industry experts across the value chain through primary research. Both top-down and bottom-up approaches were employed to estimate the complete market size. Thereafter, market breakup and data triangulation were used to estimate the market size of segments and subsegments.
Secondary Research
In the secondary research process, various secondary sources, such as Bloomberg and BusinessWeek have been referred for, to identify and collect information for this study. The secondary sources included annual reports, press releases, and investor presentations of companies; white papers; journals; and certified publications and articles from recognized authors, directories, and databases.
Primary Research
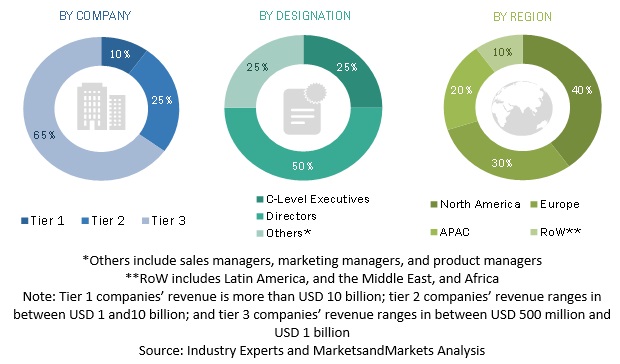
Various primary sources from both the supply and demand-sides of the in-store analytics market ecosystem were interviewed to obtain qualitative and quantitative information for this study. The primary sources from the supply-side included industry experts, such as Chief Executive Officers (CEOs), Chief Technology Officers (CTOs), Chief Operating Officers (COOs), Vice Presidents (VPs), Managing Directors (MDs), technology and innovation directors, and related key executives from various key companies and organizations operating in the in-store analytics market, associated service providers, and system integrators operating in the targeted regions. All possible parameters that affect the market covered in this research study have been accounted for, viewed in extensive detail, verified through primary research, and analyzed to get the final quantitative and qualitative data. Following is the breakup of primary respondents,
To know about the assumptions considered for the study, download the pdf brochure
Market Size Estimation
For making market estimates and forecasting the in-store analytics market, and the other dependent submarkets, top-down and bottom-up approaches were used. The bottom-up procedure was used to arrive at the overall market size using key companies� revenue and their offerings in the market. The research methodology used to estimate the market size includes the following:
- The key players in the market have been identified through extensive secondary research.
- The market size, in terms of value, has been determined through primary and secondary research processes.
- All percentage shares, splits, and breakdowns have been determined using secondary sources and verified through primary sources.
Data Triangulation
With data triangulation and validation through primary interviews, the exact value of the overall parent market size was determined and confirmed using this study. The overall market size was then used in the top-down procedure to estimate the size of other individual markets via percentage splits of the market segmentation.
Report Objectives
- To define, describe, and forecast the in-store analytics market by component (software and services), application, deployment model, organization size, and region
- To provide detailed information about the major factors (drivers, opportunities, restraints, and challenges) influencing the growth of the market
- To analyze micromarkets with respect to individual growth trends, prospects, and contributions to the total market
- To analyze the opportunities in the market for stakeholders by identifying high-growth segments of the market
- To forecast the market size of the market segments with respect to the 5 main regions, namely, North America, Europe, Middle East and Africa (MEA), Asia Pacific (APAC), and Latin America.
- To profile the key players of the market and comprehensively analyze their market size and core competencies in the market
- To track and analyze the competitive developments, such as new product launches; mergers and acquisitions; and partnerships, agreements, and collaborations, in the global in-store analytics market
Available Customizations
With the given market data, MarketsandMarkets offers customizations as per the company�s specific needs. The following customization options are available for the report:
Product Analysis
- Product matrix gives a detailed comparison of the product portfolio of each company
Company Information
- Detailed analysis and profiling of additional market players up to 5


Growth opportunities and latent adjacency in In-store Analytics Market