Inorganic Scintillators Market by Scintillation Material (NaI, CsI, LSO & LYSO), Type (Alkali Halides, Rare Earth Metals), & Application (Healthcare, Homeland Security & Defense, Nuclear Power Plants) - Analysis - Global Forecast to 2021


The global inorganic scintillators market size is projected to grow at a CAGR of 5.2%. The growth of the overall market can be attributed to growing safety concerns post the Fukushima disaster, growing security threats, growing security budgets of global sporting events, increasing incidence of cancer, growth in the number of PET/CT scans, and growing threat of nuclear terrorism.
In the coming years, the inorganic scintillators market is expected to witness the highest growth in the Asia-Pacific region. This can be attributed to high spending on homeland security in Asia, Japan’s decision to continue with the use of nuclear power, high growth expected in China’s nuclear power industry, presence of global and local players in the Chinese market, increasing number of nuclear power plants in India, and increasing installations of nuclear imaging systems in India.
North America is expected to account for the largest share of the global inorganic scintillators market. This can be attributed to the increasing prevalence of cancer, rising adoption of nuclear imaging systems, government initiatives and increase in the number of nuclear power plants in the U.S., growing security concerns, and rising number of conferences.
The report segments inorganic scintillators market based on scintillation material, type, application, and region.
The sodium iodide (NaI) segment is expected to account for the largest share of the inorganic scintillators market, by scintillation material, in 2016. This is attributed to factors such as rising application horizon of sodium iodide, rise in homeland security expenditure to combat terrorism worldwide, and increasing number of nuclear power plants. However, the lutetium oxyorthosilicate (LSO) & lutetium-yttrium oxyorthosilicate (LYSO) segment is expected to grow at the highest CAGR during the forecast period (2016-2021). This is mainly due to its benefits over other scintillators, increasing research activities in the field of high-energy and nuclear physics, and rising demand for PET scanners worldwide. Due to distinguished properties of LSO and LYSO, especially their higher light output and short decay time as compared to BGO, they can potentially replace BGO in many applications.
On the basis of type, the global inorganic scintillators market is segmented into alkali halides, oxide compounds, and rare earth halides. The alkali halides segment is expected to account for the largest share of the global market in 2016. This can be attributed to the rising application horizon of alkali halides, increase in the research activities for space exploration, rise in government defense budgets, and growing need for environmental radiation testing. However, the rare earth metals segment is projected to grow at the highest CAGR from 2016 to 2021. This can be attributed to its high light yield, energy resolution crystals, faster response times, and good gamma ray-stopping efficiency, and improved decay time (as compared to alkali halides).
On the basis of application, the inorganic scintillators market is segmented into healthcare, homeland security and defense, nuclear power plants, industrial, and other applications (high-energy physics, astrophysics, environmental monitoring, and academic research). In 2016, the healthcare segment is expected to command the largest share of the global market, by application. This can be attributed to the increasing incidence of cancer, rising research activity, increasing installations of PET scanners worldwide, and growing preference for effective radiation protection in medical facilities. However, the homeland security and defense segment is projected to grow at the highest CAGR from 2016 to 2021. Rising terrorism levels globally, growing government initiatives by governments worldwide to improve homeland security, and increasing security and defense expenditure are expected to augment the demand for inorganic scintillators in the homeland security and defense industry in the coming years.
Saint Gobain S.A. (France), Hamamatsu Photonics K.K. (Japan), Dynasil Corporation of America (U.S.), Hitachi Metals Group (Japan), Rexon Components, Inc. (U.S.), Detec (Canada), Toshiba Materials Co., Ltd. (Japan), Scintacor (U.K.), EPIC Crystal Company Limited (China), Amcrys (Ukraine), Alpha Spectra, Inc. (U.S.), Shanghai SICCAS High Technology Corporation (China), and Nihon Kessho Kogaku Co., Ltd. (Japan) are some of the key players in the inorganic scintillators market worldwide.
Stakeholders of the Market
- Radiation Detection, Monitoring, and Safety Devices and Accessories Manufacturing Companies
- Suppliers and Distributors of Radiation Detection, Monitoring, and Safety Devices and Accessories
- Research and Consulting Firms
- Homeland Security and Defense Departments
- Research Institutes
- Venture Capitalists
To know about the assumptions considered for the study, download the pdf brochure
Inorganic Scintillators Market Report Scope
This research report categorizes the global inorganic scintillators market into the following segments:
By Scintillation Material
- Sodium Iodide (NaI)
- Cesium Iodide (CsI)
- Lutetium Oxyorthosilicate (LSO) and Lutetium-yttrium Oxyorthosilicate (LYSO)
- Bismuth Germanate Oxide (BGO)
- Others [Barium Fluoride (BaF2), Lead Tungstate (PbWO4), Cadmium Tungstate (CdWO4), Cerium Bromide (CeBr3), Lanthanum Bromide (LaBr3), and Gadolinium Orthosilicate (GSO)]
By Type
- Alkali Halides
- Oxide Compounds
- Rare Earth Metals
By Application
- Healthcare
- Homeland Security and Defense
- Nuclear Power Plants
- Industrial Applications
- Other Applications (high-energy physics, environmental monitoring, astrophysics, and academic research)
By Region
-
North America
- U.S.
- Canada
-
Europe
- Europe5
- Rest of Europe (RoE)
-
Asia-Pacific
- China
- Japan
- India
- Rest of Asia-Pacific (RoAPAC)
- Rest of the World (RoW)
Available Customizations
With the given market data, MarketsandMarkets offers customizations as per the company’s specific needs. The following customization option is available for the report:
Portfolio Assessment
Product Matrix, which gives a detailed comparison of the product portfolios of the top three companies in the market.
Growing safety concerns post the Fukushima disaster, growing security threats, growing security budgets of global sporting events, increasing incidence of cancer, growth in the number of PET/CT scans, and growing threat of nuclear terrorism are expected to drive the growth of the market in the coming years.
The global inorganic scintillators market is segmented on the basis of scintillation material, type, and application. By scintillation material, the market is categorized into sodium iodide (NaI), cesium iodide (CsI), bismuth germanate (BGO), lutetium oxyorthosilicate (LSO) and lutetium –yttrium oxyorthosilicate (LYSO), and other scintillation materials [barium fluoride (BaF2), lead tungstate (PbWO4), cadmium tungstate (CdWO4), cerium bromide (CeBr3), lanthanum bromide (LaBr3), and gadolinium orthosilicate (GSO)]. The sodium iodide (NaI) is estimated to account for the largest share of the global market. Rising application horizon of sodium iodide, increasing homeland security expenditure to combat terrorism worldwide, and rising number of nuclear power plants are some of the reasons contributing to the growth of the market. The lutetium oxyorthosilicate (LSO) & lutetium-yttrium oxyorthosilicate (LYSO) segment is expected to grow at the highest rate during the forecast period (2016-2021). This is mainly due to its benefits over other scintillators, increasing research activities in the field of high-energy and nuclear physics, and rising demand for PET scanners worldwide. Due to distinguished properties of LSO and LYSO, especially their higher light output and short decay time as compared to BGO, they can potentially replace BGO in many applications.
On the basis of type, the global inorganic scintillators market is segmented into alkali halides, oxide compounds, and rare earth halides. The alkali halides segment is expected to account for the largest share of the global market in 2016. This can be attributed to the rising application horizon of alkali halides, increase in the research activities for space exploration, rise in government defense budgets, and growing need for environmental radiation testing. However, the rare earth metals segment is projected to grow at the highest CAGR from 2016 to 2021, owing to its high light yield, energy resolution crystals, faster response times, and good gamma ray-stopping efficiency, and improved decay time (as compared to alkali halides).
On the basis of application, the inorganic scintillators market is segmented into healthcare, homeland security and defense, nuclear power plants, industrial applications, and other applications (high-energy physics, astrophysics, environmental monitoring, and academic research). The healthcare is expected to command the largest share of the global market, by application in 2016. This can be attributed to the increasing incidence of cancer, rising research activity, increasing installations of PET scanners worldwide, and growing preference for effective radiation protection in medical facilities. However, the homeland security and defense segment is projected to grow at the highest CAGR of 5.8% from 2016 to 2021. Growing government initiatives by governments worldwide to improve homeland security, rising terrorism levels globally, , and increasing security and defense expenditure are expected to bolster the demand for inorganic scintillators in the homeland security and defense industry in the coming years.
On the basis of region, this market is categorized into North America, Europe, Asia-Pacific, and the Rest of the World (RoW). North America is expected to account for the largest share of the market in 2016. The U.S. is the largest market in North America, owing to the increasing prevalence of cancer, rising adoption of nuclear imaging systems, government initiatives, increase in the number of nuclear power plants in the U.S., growing security concerns, and rising number of conferences. However, the Asia-Pacific region is expected to grow at the highest CAGR during the forecast period. This can be attributed to the high spending on homeland security in Asia, the Japanese government’s decision to reverse its nuclear power phase-out, high expected growth in China’s nuclear power industry, presence of global and local players in the Chinese market, increasing number of nuclear power plants in India, and increasing installations of nuclear imaging systems in India are expected to propel the growth of the inorganic scintillators market in the Asia-Pacific region.
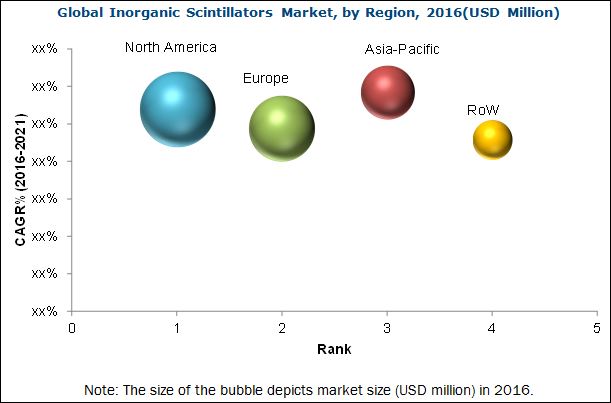
The inorganic scintillators market is expected to be dominated by North America, followed by Europe, Asia-Pacific, and the Rest of the World (RoW). Asia-Pacific is expected to grow at the highest rate during the forecast period.
Saint-Gobain S.A. (France), Hamamatsu Photonics K.K. (Japan), Dynasil Corporation of America (U.S.), Hitachi Metals Group (Japan), Rexon Components, Inc. (U.S.), Detec (Canada), Toshiba Materials Co., Ltd. (Japan), Scintacor (U.K.), EPIC Crystal Company Limited (China), Amcrys (Ukraine), Alpha Spectra, Inc. (U.S.), Shanghai SICCAS High Technology Corporation (China), and Nihon Kessho Kogaku Co., Ltd. (Japan) are some of the key players in the inorganic scintillators market worldwide.
Frequently Asked Questions (FAQ):
What is the size of Inorganic Scintillators Market ?
The global Inorganic Scintillators Market size is growing at a CAGR of 5.2%
What are the major growth factors of Inorganic Scintillators Market ?
The growth of the overall market can be attributed to growing safety concerns post the Fukushima disaster, growing security threats, growing security budgets of global sporting events, increasing incidence of cancer, growth in the number of PET/CT scans, and growing threat of nuclear terrorism.
Who all are the prominent players of Inorganic Scintillators Market ?
Saint Gobain S.A. (France), Hamamatsu Photonics K.K. (Japan), Dynasil Corporation of America (U.S.), Hitachi Metals Group (Japan), Rexon Components, Inc. (U.S.), Detec (Canada), Toshiba Materials Co., Ltd. (Japan), Scintacor (U.K.), EPIC Crystal Company Limited (China), Amcrys (Ukraine), Alpha Spectra, Inc. (U.S.), Shanghai SICCAS High Technology Corporation (China), and Nihon Kessho Kogaku Co., Ltd. (Japan) are some of the key players in the inorganic scintillators market worldwide. .
To speak to our analyst for a discussion on the above findings, click Speak to Analyst
 Exclusive indicates content/data unique to MarketsandMarkets and not available with any competitors.
Table of Contents
1 Introduction (Page No. - 17)
1.1 Objectives of Study
1.2 Market Definition
1.2.1 Markets Covered
1.2.2 Years Considered for the Study
1.3 Currency
1.4 Limitations
1.5 Stakeholders
2 Research Methodology (Page No. - 20)
2.1 Research Methodology Steps
2.2 Secondary and Primary Research Methodology
2.2.1 Secondary Research
2.2.2 Primary Research
2.2.2.1 Key Data From Primary Sources
2.2.2.2 Key Insights From Primary Sources
2.3 Key Industry Insights
2.4 Market Size Estimation Methodology
2.5 Market Data Validation and Triangulation
2.6 Assumptions for the Study
3 Executive Summary (Page No. - 32)
3.1 Introduction
3.2 Conclusion
4 Premium Insights (Page No. - 37)
4.1 Global Market Overview
4.2 Geographic Analysis: Market, By Type
4.3 Global Inorganic Scintillators, By Application (2016 vs 2021)
4.4 Geographic Snapshot: Inorganic Scintillators Market
5 Market Overview (Page No. - 41)
5.1 Introduction
5.2 Market Dynamics
5.2.1 Market Drivers
5.2.1.1 Increasing Volume of Pet/CT Scans
5.2.1.1 Growing Safety Concerns Post the Fukushima Disaster
5.2.1.2 Growing Security Threats to Drive the Inorganic Scintillators Market for Homeland Security
5.2.1.3 Rising Security Budgets of Global Sporting Events
5.2.1.4 Increasing Incidence of Cancer
5.2.1.5 Growing Threat of Nuclear Terrorism
5.2.2 Market Restraints
5.2.2.1 Shortage of Nuclear Power Workforce
5.2.2.2 Nuclear Power Phase-Out in Some European and Asian Countries
5.2.3 Market Opportunities
5.2.3.1 Proposed Increase in the Number of Nuclear Power Plants
5.2.3.2 Japan’s Decision to Reverse Nuclear Phase-Out
5.2.3.3 Rising Focus on Nuclear Power in India to Meet Energy Demands
5.2.3.4 Growing Demand for A Clean and Reliable Source of Electricity Generation in China
5.2.3.5 Introduction of Nuclear Power in Pacific Countries
5.2.4 Market Threat
5.2.4.1 Substitutes Such as Renewable Energy
6 Global Inorganic Scintillators Market, By Scintillation Material (Page No. - 51)
6.1 Introduction
6.2 Sodium Iodide
6.3 Cesium Iodide
6.4 Lutetium Oxyorthosilicate & Lutetium–Yttrium Oxyorthosilicate
6.5 Bismuth Germanate
6.6 Other Scintillation Materials
7 Global Inorganic Scintillators Market, By Type (Page No. - 68)
7.1 Introduction
7.2 Alkali Halides
7.3 Oxide Compounds
7.4 Rare Earth Metals
8 Inorganic Scintillators Market, By Application (Page No. - 74)
8.1 Introduction
8.2 Healthcare
8.3 Homeland Security and Defense
8.4 Nuclear Power Plants
8.5 Industrial Applications
8.6 Others
9 Global Inorganic Scintillators Market, By Region (Page No. - 84)
9.1 Introduction
9.2 North America
9.2.1 U.S.
9.2.1.1 Increased Adoption of Nuclear Imaging Systems
9.2.1.2 Government Initiatives and Increasing Number of Nuclear Power Plants
9.2.1.3 Conferences as A Platform for Knowledge Exchange
9.2.1.4 Growing Security Concerns
9.2.2 Canada
9.2.2.1 Rise in Funding
9.2.2.2 Increasing Adoption of Nuclear Imaging Systems
9.3 Europe
9.3.1 Growing Research Activities in Europe
9.3.2 France and Russia to Lead the Growth of the European Nuclear Industry
9.3.3 Increasing Partnerships for the Construction of Nuclear Power Plants
9.3.4 Europe-5
9.3.4.1 Security Concerns
9.3.4.2 Stabilization of Europe’s Nuclear Power Industry, Post the Fukushima Disaster
9.3.4.3 Increasing Adoption of Nuclear Imaging Systems/Equipment
9.3.4.4 Favorable Funding Scenario in Germany
9.3.4.5 Increasing Number of Pet-CT Procedures and Investments on Pet/CT Scanners in the U.K.
9.3.5 Rest of Europe (RoE)
9.3.5.1 Conferences & Symposia
9.4 Asia-Pacific
9.4.1 Heightened Spending on Homeland Security in Asia
9.4.2 Increasing Research on Inorganic Scintillators
9.4.3 Japan
9.4.3.1 Japan’s Decision to Continue With the Use of Nuclear Power
9.4.4 China
9.4.4.1 High Growth Expected in China’s Nuclear Power Industry
9.4.4.2 Presence of Global and Local Players in the Chinese Market
9.4.5 India
9.4.5.1 Increasing Number of Nuclear Power Plants in India
9.4.5.2 Increasing Installations of Nuclear Imaging Systems in India
9.4.6 Rest of Asia-Pacific
9.4.6.1 Infrastructural Development
9.5 Rest of the World (RoW)
9.5.1 South Africa’s Strong Commitment to Adopting Nuclear Power
9.5.2 Strengthening of Homeland Security
9.5.3 Favorable Reimbursement Scenario in Brazil
9.5.4 Development of New Airports in Latin America
9.5.5 Increasing Number of Nuclear Power Plants in the Middle East
10 Competitive Landscape (Page No. - 120)
10.1 Overview
10.2 Market Share Analysis
10.2.1 Saint-Gobain S.A.
10.2.2 Hamamatsu Photonics K.K.
10.2.3 Dynasil Corporation of America
10.3 Competitive Situation and Trends
10.3.1 Expansions
10.3.2 New Product Launches
10.3.3 Marketing and Promotion
10.3.4 Agreements, Collaborations, Contracts, Partnerships, and Joint Ventures
10.3.5 Funding
10.3.6 Acquisitions
10.3.7 Other Developments
10.4 Empirical Assesment of Growth Strategies
10.4.1 Route to Growth: Organic vs Inorganic Strategies
10.4.1.1 Organic Growth Strategies
10.4.1.2 Inorganic Growth Strategies
11 Company Profiles (Page No. - 136)
(Introduction, Products & Services, Strategy, & Analyst Insights, Developments, MnM View)*
11.1 Introduction
11.2 Saint-Gobain S.A.
11.3 Hamamatsu Photonics K.K.
11.4 Dynasil Corporation of America
11.5 Hitachi Metals Group
11.6 Rexon Components, Inc.
11.7 Detec
11.8 Toshiba Materials Co., Ltd.
11.9 Scintacor
11.10 EPIC Crystal Co., Ltd.
11.11 Amcrys
11.12 Alpha Spectra, Inc.
11.13 Shanghai Siccas High Technology Corporation
11.14 Nihon Kessho Kogaku Co., Ltd.
*Details on Marketsandmarkets View, Introduction, Product & Services, Strategy, & Analyst Insights, New Developments Might Not Be Captured in Case of Unlisted Companies.
12 Appendix (Page No. - 156)
12.1 Discussion Guide
12.2 Knowledge Store: Marketsandmarkets’ Subscription Portal
12.3 Introducing RT: Real-Time Market Intelligence
12.4 Available Customizations
12.5 Related Reports
List of Tables (76 Tables)
Table 1 Major Sporting Events and Their Security Budgets
Table 2 Increased Safety Concerns at Nuclear Facilities and Threat of Nuclear Terrorism are the Major Drivers for Radiation Monitoring and Safety Market
Table 3 Shortage of Nuclear Power Workforce Restraining the Growth of the Nuclear Industry and the Inorganic Scintillators Market
Table 4 Increasing Number of Nuclear Power Plants to Offer Significant Growth Opportunities for Market Players
Table 5 Comparative Assessment of Inorganic Scintillation Materials
Table 6 Inorganic Scintillators Market Size, By Scintillation Material, 2014–2021 (USD Million)
Table 7 Global Sodium Iodide Market Size, By Region, 2014–2021 (USD Million)
Table 8 North America: Sodium Iodide Market Size, By Country, 2014–2021 (USD Million)
Table 9 Europe: Sodium Iodide Market Size, By Country, 2014–2021 (USD Million)
Table 10 Asia-Pacific: Sodium Iodide Market Size, By Country, 2014–2021 (USD Million)
Table 11 Global Cesium Iodide Market Size, By Region, 2014–2021 (USD Million)
Table 12 North America: Cesium Iodide Market Size, By Country, 2014–2021 (USD Million)
Table 13 Europe: Cesium Iodide Market Size, By Country, 2014–2021 (USD Million)
Table 14 Asia-Pacific: Cesium Iodide Market Size, By Country, 2014–2021 (USD Million)
Table 15 Global Lutetium Oxyorthosilicate & Lutetium–Yttrium Oxyorthosilicate Market Size, By Region, 2014–2021 (USD Million)
Table 16 North America: Lutetium Oxyorthosilicate & Lutetium–Yttrium Oxyorthosilicate Market Size, By Country, 2014–2021 (USD Million)
Table 17 Europe: Lutetium Oxyorthosilicate & Lutetium–Yttrium Oxyorthosilicate Market Size, By Country, 2014–2021 (USD Million)
Table 18 Asia-Pacific: Lutetium Oxyorthosilicate & Lutetium–Yttrium Oxyorthosilicate Market Size, By Country, 2014–2021 (USD Million)
Table 19 Bismuth Germanate Market Size, By Region, 2014–2021 (USD Million)
Table 20 North America: Bismuth Germanate Market Size, By Country, 2014–2021 (USD Million)
Table 21 Europe: Bismuth Germanate Market Size, By Country, 2014–2021 (USD Million)
Table 22 Asia-Pacific: Bismuth Germanate Market Size, By Country, 2014–2021 (USD Million)
Table 23 Global Other Scintillation Materials Market Size, By Region, 2014–2021 (USD Million)
Table 24 North America: Other Scintillation Materials Market Size, By Country, 2014–2021 (USD Million)
Table 25 Europe: Other Scintillation Materials Market Size, By Country, 2014–2021 (USD Million)
Table 26 Asia-Pacific: Other Scintillation Materials Market Size, By Country, 2014–2021 (USD Million)
Table 27 Global Inorganic Scintillators Market Size, By Type, 2014–2021 (USD Million)
Table 28 Alkali Halides Market Size, By Region, 2014–2021 (USD Million)
Table 29 Oxide Compounds Market Size, By Region, 2014–2021 (USD Million)
Table 30 Rare Earth Metals Market Size, By Region, 2014–2021 (USD Million)
Table 31 Inorganic Scintillators Market Size, By Application, 2014–2021 (USD Million)
Table 32 Healthcare Market Size, By Region, 2014–2021 (USD Million)
Table 33 Homeland Security and Defense Market Size, By Region, 2014–2021 (USD Million)
Table 34 Nuclear Power Plants Market Size, By Region, 2014–2021 (USD Million)
Table 35 Industrial Applications Market Size, By Region, 2014–2021 (USD Million)
Table 36 Research Projects and Activities
Table 37 Research Projects and Activities
Table 38 Other Applications Market Size, By Region, 2014–2021 (USD Million)
Table 39 Inorganic Scintillators Market Size, By Region, 2014–2021 (USD Million)
Table 40 North America: Inorganic Scintillators Market Size, By Country, 2014–2021 (USD Million)
Table 41 North America: Inorganic Scintillators Market Size, By Type, 2014–2021 (USD Million)
Table 42 North America: Inorganic Scintillators Market Size, By Application, 2014–2021 (USD Million)
Table 43 U.S.: Inorganic Scintillators Market Size, By Type, 2014–2021 (USD Million)
Table 44 U.S.: Inorganic Scintillators Market Size, By Application, 2014–2021 (USD Million)
Table 45 Canada: Inorganic Scintillators Market Size, By Type, 2014–2021 (USD Million)
Table 46 Canada: Inorganic Scintillators Market Size, By Application, 2014–2021 (USD Million)
Table 47 Europe: Inorganic Scintillators Market Size, By Region, 2014-2021 (USD Million)
Table 48 Europe: Inorganic Scintillators Market Size, By Type, 2014–2021 (USD Million)
Table 49 Research Studies on Inorganic Scintillators
Table 50 Europe: Inorganic Scintillators Market Size, By Application, 2014–2021 (USD Million)
Table 51 Europe-5: Inorganic Scintillators Market Size, By Type, 2014–2021 (USD Million)
Table 52 Europe-5: Inorganic Scintillators Market Size, By Application, 2014–2021 (USD Million)
Table 53 Conferences, Symposia, & Workshops Hosted in Europe (2013-2017)
Table 54 RoE: Inorganic Scintillators Market Size, By Type, 2014-2021 (USD Million)
Table 55 RoE: Inorganic Scintillators Market Size, By Application, 2014-2021 (USD Million)
Table 56 Asia-Pacific: Inorganic Scintillators Market Size, By Country, 2014-2021 (USD Million)
Table 57 Asia-Pacific: Inorganic Scintillators Market Size, By Type, 2014-2021 (USD Million)
Table 58 Asia-Pacific: Inorganic Scintillators Market Size, By Application, 2014-2021 (USD Million)
Table 59 Japan: Inorganic Scintillators Market Size, By Type, 2014-2021 (USD Million)
Table 60 Japan: Inorganic Scintillators Market Size, By Application, 2014-2021 (USD Million)
Table 61 China: Inorganic Scintillators Market Size, By Type, 2014-2021 (USD Million)
Table 62 China: Inorganic Scintillators Market Size, By Application, 2014-2021 (USD Million)
Table 63 India: Inorganic Scintillators Market Size, By Type, 2014-2021 (USD Million)
Table 64 India: Inorganic Scintillators Market Size, By Application, 2014-2021 (USD Million)
Table 65 RoAPAC: Inorganic Scintillators Market Size, By Type, 2014-2021 (USD Million)
Table 66 RoAPAC: Inorganic Scintillators Market Size, By Application, 2014-2021 (USD Million)
Table 67 Major Projects at Existing Airports in Latin America
Table 68 RoW: Inorganic Scintillators Market Size, By Type, 2013–2020 (USD Million)
Table 69 RoW: Inorganic Scintillators Market Size, By Application, 2013–2020 (USD Million)
Table 70 Expansions, 2013–2016
Table 71 New Product Launches, 2013–2016
Table 72 Marketing and Promotion, 2013–2016
Table 73 Agreements, Collaborations, Contracts, Partnerships, and Joint Ventures, 2013–2016
Table 74 Funding, 2013–2016
Table 75 Acquisitions, 2013–2016
Table 76 Other Developments, 2013–2016
List of Figures (49 Fiogures)
Figure 1 Global Inorganic Scintillators Market
Figure 2 Global Inorganic Scintillators Market: Research Methodology Steps
Figure 3 Breakdown of Primary Interviews: By Company Type, Designation, and Region
Figure 4 Primary Research: Sampling Frame
Figure 5 Primary Research - Current Sampling Frame
Figure 6 Market Size Estimation Methodology: Bottom-Up Approach
Figure 7 Market Size Estimation Methodology: Top-Down Approach
Figure 8 Research Design
Figure 9 Data Triangulation Methodology
Figure 10 Global Inorganic Scintillators Market, By Scintillation Material, 2016 vs 2021, (USD Million)
Figure 11 Global Inorganic Scintillators Market, By Application, 2016 vs 2021, (USD Million)
Figure 12 Global Inorganic Scintillators Market, By Type, 2016 vs 2021, (USD Million)
Figure 13 Asia-Pacific to Witness Highest Growth Rate From 2016 to 2021
Figure 14 Growing Safety Concerns, Growing Volume of Pet Scanners, and Rising Security Budgets are Driving the Market Growth for Inorganic Scintillators
Figure 15 Alkali Halides Segment to Dominate the Inorganic Scintillators Market in 2016
Figure 16 Healthcare Segment to Command the Largest Share in 2016
Figure 17 Asia-Pacific to Witness the Highest Growth Rate During the Forecast Period
Figure 18 Inorganic Scintillators Market: Drivers, Restraints, Opportunities, and Challenges
Figure 19 Global Inorganic Scintillators Market, By Scintillation Material
Figure 20 LSO and LYSO Segment to Grow at the Highest CAGR During the Forecast Period
Figure 21 Global Inorganic Scintillators Market, By Type
Figure 22 Rare Earth Metals Segment to Grow at the Highest CAGR During the Forecast Period
Figure 23 Global Inorganic Scintillators Market, By Application
Figure 24 Healthcare Segment to Grow at the Highest CAGR During the Forecast Period
Figure 25 North America to Command the Largest Share in the Inorganic Scintillators Market
Figure 26 North America: Inorganic Scintillators Market Snapshot
Figure 27 Growing Cancer Prevalence, A Major Driver of the North American Inorganic Scintillators Market
Figure 28 Europe: Inorganic Scintillators Market Snapshot
Figure 29 Asia-Pacific: Inorganic Scintillators Market Snapshot
Figure 30 Rest of the World: Inorganic Scintillators Market Snapshot
Figure 31 Global Inorganic Scintillators Market Share, By Company, 2015
Figure 32 Expansions Was the Key Strategic Development Adopted By Players in the Inorganic Scintillators Market
Figure 33 Expansions, By Company, 2013–2016
Figure 34 New Product Launches, By Company, 2013–2016
Figure 35 Marketing and Promotion, By Company, 2013–2016
Figure 36 Agreements, Collaborations, Contracts, Partnerships, and Joint Ventures, By Company, 2013–2016
Figure 37 Funding, By Company, 2013–2016
Figure 38 Acquisitions, By Company, 2013–2016
Figure 39 Other Developments, By Company, 2013–2016
Figure 40 Industry Trends: Organic and Inorganic Growth Strategies
Figure 41 Organic Growth Strategies, By Key Player, 2013–2016
Figure 42 Organic Growth Strategies, 2013-2016
Figure 43 Inorganic Growth Strategies, By Key Player, 2013–2016
Figure 44 Inorganic Growth Strategies, 2013-2016
Figure 45 Geographical Revenue Mix of the Top 3 Players in the Market
Figure 46 Saint-Gobain S.A.: Company Snapshot
Figure 47 Hamamatsu Photonics K.K.: Company Snapshot
Figure 48 Dynasil Corporation of America: Company Snapshot
Figure 49 Hitachi Metals Group: Company Snapshot

 Generating Response ...


Growth opportunities and latent adjacency in Inorganic Scintillators Market