Scintillator Market by Composition of Material, Application (Healthcare, Homeland security, Industrial application, Nuclear Power Plants, and others), End Product (Personal Instrument, Hand-Held Instruments, Fixed, and Installed Instruments) & Geography - Global Forecast and Analysis to 2013 � 2020


The Scintillator market is expected to reach $479.16 Million by 2020, at an estimated CAGR of 5.62% from 2014 to 2020.
The scintillator market is undergoing a significant transformation, with the changing landscape of healthcare, nuclear power plants, homeland security and defense, and manufacturing industries. The growth of this market is majorly influenced by the dynamics of these industries. Huge R&D investments and government funding in new scintillator discoveries are driving the growth of the overall market, globally. Rising demand for new radiological medical applications and increasing investments for radiation monitoring in homeland security are some of the drivers which are driving the scintillator market.
In this report, the scintillator market is segmented on the basis of its chemical composition into inorganic and organic scintillators. Sodium iodide scintillators are the most popular inorganic scintillators since they possess� the highest coefficient of conversion of ionizing radiation into light energy, a convenient emission range, ability to produce large size crystals, and are available at low prices with respect to other scintillation materials. The segmentation based on the end product is classified as pocket size or personal devices, hand-held devices; and large size, fixed and installed systems.
The report covers the geographical segmentation of the scintillator market as Americas, Europe, APAC, and Rest of the World (RoW). Among all these regions, Americas is estimated to dominate the market owing to the growing security concerns and increasing nuclear threats or nuclear terrorism in the country. The medical imaging application will also create a boom in Europe, which will impact the revenue generation in the country with respect to scintillators. However, in the near future, it is expected that the APAC market will grow at a considerable rate.
Some of the major players in scintillator market include: Canberra Industries Inc. (U.S.), Hamamatsu Photonics K.K. (Japan), Hitachi Metals Ltd. (Japan), Ludlum Measurements Inc. (U.S.), Mirion Technologies Inc. (U.S.), Radiation Monitoring Devices (U.S.), Saint Gobain (France), and Zecotek Photonics (Canada), among others.
Scope of the report
This research report categorizes the scintillator market on the basis of its various applications, material composition, end products, and geography; it also covers the revenue foretold from 2013 to 2020. It describes the demand of scintillators in various regions. The report describes the application mapping in the scintillators market with respect to the growth potential.
Scintillator Market By Composition of Material
The composition of scintillator materials described in this report is segmented into organic and inorganic materials. The �inorganic scintillators hold the future prospect of the market.
Scintillator Market By Applications
Scintillators are used for various applications such as in the healthcare industry; for homeland security, defense, nuclear power plants; and industrial and research sectors.
Scintillator Market By End Products
In this research report, the scintillator market is segregated into different end products such as pocket size, hand- held instruments, and fixed or installed systems.
Scintillator Market By Geography
Geographical analysis covers Americas, Europe, Asia-Pacific, and ROW. In accordance with this report, the Americas, currently, leads the scintillator market, and the APAC region is the fastest growing market.
The Scintillator market is expected to reach $479.16 Million by 2020, at an estimated CAGR of 5.62% from 2014 to 2020.
Scintillator is a material that identifies nuclear particles and radiation by reemitting the incident radiation in the form of light photons, which are further converted to electric signals by photomultiplier tubes. Initially, applications of these materials were limited to medical and visual counting purposes, but in the recent few years, scintillators have made a radical shift towards security, high energy physics, astrophysics, nuclear power plants, and scientific applications. Though, inorganic compounds are the most dominant materials leveraged for radiation detection in radiation monitoring and measurement devices, still many new compound scintillators have evolved due to the surge in research initiatives by the private and government sectors; such as cerium doped lanthanum halides, Europium doped strontium iodide, LSO, LYSO, and others. These continuous developments are driven by the emergence of new applications and due to the growing need of hand held and portable radiation detectors. Scintillators have a huge growth potential, especially, in markets that are characterized by low cost, and high resolution and performance in terms of the radiation monitoring equipment.
The main driving factors responsible for the explosive growth of the overall scintillator market include application driven research activities, need to find alternatives for neutron detection, supportive regulations, government funding, and radiation exposure related safety concerns. Among all the application sectors, healthcare, nuclear power plants, and homeland security account for the largest market share. Moreover, healthcare, including medical imaging and nuclear medicine, homeland security, and nuclear power industry are estimated to grow exponentially in the coming future.
In terms of the geographical analysis of the scintillator market with regards to the end products, materials, and related applications �the Americas have been accounting for the largest market share followed by Europe. However, the APAC is expected to be the fastest growing market in the coming future; supportive government policies, increased financial investments by governments, increasing number of nuclear power reactors, and huge R&D activities are the major reasons behind this tremendous growth. Some of the major players in the scintillator market include Saint Gobain (France), Hamamatsu (Japan), Ludlum Measurements (U.S.), Mirion Technologies (U.S.), Hitachi Metals (Japan), Zecotek Photonics (Canada), Applied Scintillation Technologies (U.K.), and Radiation Monitoring Devices (U.S.), among others.
The below bar chart gives an overview of the overall estimated scintillator market revenue from 2013 to 2020.
Scintillator Material Market Value, 2013-2018 ($Million)
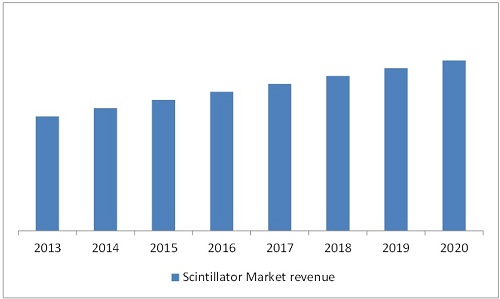
Source: MarketsandMarkets Analysis
 Exclusive indicates content/data unique to MarketsandMarkets and not available with any competitors.
Table of Contents
1 Introduction (Page No. - 17)
1.1 Objectives
1.2 Markets Covered
1.3 Stakeholders
1.4 Research Methodology
1.4.1 Market Size Estimation
1.4.2 Key Points Taken From the Secondary Sources
1.4.3 Key Points Taken From the Primary Sources
1.4.4 Assumptions Made for This Report
1.4.5 List of Companies Covered During Primaries
2 Executive Summary (Page No. - 26)
3 Cover Story: Expert Interview (Page No. - 29)
3.1 Applied Scintillation Technologies
3.2 Horiba Instruments Inc.
4 Market Overview (Page No. - 34)
4.1 Market Definition
4.2 History and Evolution
4.3 Market Dynamics
4.3.1 Market Drivers
4.3.1.1 Demand for Low Cost and High Performance Scintillators
4.3.1.2 Growing Safety Concerns in the Wake of Fukushima Disaster
4.3.1.3 Rising Demand of Existing and New Radiological Medical Applications
4.3.1.4 Increasing Investments for Radiation Monitoring in Homeland Security
4.3.2 Restraints
4.3.2.1 Human Capital Crisis Among Radiation Safety Professionals
4.3.2.2 Competition From Direct Radiation Conversion Technologies
4.3.3 Opportunities
4.3.3.1 Growing Need for Neutron Detection Alternative to Helium�3
4.3.3.2 Proposed Increase in the Number of Nuclear Power Plants Particularly in India and China
4.4 Burning Issue
4.4.1 Intellectual Property Rights and Legal Frameworks Limit Use of Scintillator Based Detectors
4.5 Winning Imperative
4.5.1 Combined Detectors Or Semiconductor Scintillators offer New Opportunities for X-Ray and Gamma Ray Detection
4.6 Value Chain Analysis
4.7 Porter�s Five forces Model for the Scintillator Market
4.7.1 Degree of Competition
4.7.1 Bargaining Power of Buyers
4.7.2 Bargaining Power of Suppliers
4.7.3 Threat From Substitutes
4.7.4 Threat of New Entrants
5 Scintillator Market Analysis, By Composition of Material (Page No. - 64)
5.1 Introduction
5.2 In-Organic Scintillator
5.2.1 Alkali Halides
5.2.1.1 Thallium Doped Sodium Iodide: NAI(TL)
5.2.1.2 Thallium Doped Cesium Iodide: CSI(TL)
5.2.1.3 Sodium Doped Cesium Iodide: CSI(NA)
5.2.1.4 UN-Doped Cesium Iodide: Csi
5.2.1.5 Europium Doped LII Or LII(EU)
5.2.2 Oxide Based Scintillators
5.2.2.1 Bismuth Germanate (BI4GE3O12 Or BGO)
5.2.2.2 Gadolinium Silicate GD2SIO5 (CE) Or (GSO)
5.2.2.3 Cadmium Tungstate (CDWO4 Or CWO)
5.2.2.4 Lead Tungstate (PBWO4 Or PWO)
5.2.3 Other Inorganic Scintillators
5.2.3.1 Glass Scintillators: (Cerium Activated Lithium Silicate)
5.2.3.2 Cerium Activated Lanthanum Bromide (Labr3)
5.3 Organic Scintillator
5.3.1 Single Crystal
5.3.2 Liquid Scintillators
5.3.3 Plastic Scintillators
6 Scintillator Market Analysis, By Application (Page No. - 103)
6.1 Introduction
6.2 Healthcare
6.3 Homeland Security
6.4 Nuclear Power Plants
6.5 Industrial Application
6.6 Others
7 Scintillator Market Analysis, By End Product (Page No. - 124)
7.1 Introduction
7.2 Personal Or Pocket Size Instruments
7.2.1 Pocket Dosimeter
7.2.1.1 Non Self-Reading Dosimeters
7.2.1.1.1 Film Badges
7.2.1.1.2 thermo-Luminescent Dosimeters (TLD)
7.2.1.1.3 Optically Stimulated Luminescence (Osl) Dosimeter
7.2.1.2 Self-Reading Dosimeters
7.3 Hand-Held Instruments
7.3.1 Radio-Isotope Identification Devices (RIID)
7.3.2 Survey Meter
7.3.3 Spectrometer
7.4 Fixed, Installed, and Automatic Instruments
7.4.1 Contamination Monitors
7.4.1.1 Area Monitor
7.4.1.2 Air Monitor
7.4.2 Portal Monitor
7.4.3 Non Portable Spectrometer
7.4.4 Medical Imaging Devices
8 Geographic Analysis (Page No. - 142)
8.1 Introduction
8.2 Americas
8.2.1 Major Players in Americas
8.3 Europe
8.3.1 Major Players in Europe
8.4 APAC
8.4.1 Major Players in APAC
8.5 ROW
9 Competitive Landscape (Page No. - 167)
9.1 Introduction
9.1.1 Key Growth Strategies
9.1.2 Major Companies and their Rankings
9.1.3 New Product Developments/Launches
9.1.4 Others (Expansions and Awards)
9.1.5 Patents in Scintillator Market
9.1.6 Mergers and Acquisitions in Scintillator Market
9.1.7 Partnerships, Agreements, and Joint Ventures in Scintillator Market
9.1.8 Contracts in Scintillator Report
10 Company Profiles (Page No. - 180)
(Overview, Products and Services, Financials, Strategy & Development)*
10.1 Applied Scintillation Technologies Ltd.
10.2 Argus Imaging Bv Inc.
10.3 Canberra Industries
10.4 Hamamatsu Photonics
10.5 Hitachi Metals Ltd
10.6 Ludlum Measurements Inc.
10.7 Mirion Technologies Inc.
10.8 Radiation Monitoring Devices Inc
10.9 Rexon Components and TLD Systems Inc.
10.10 Saint Gobain
10.11 Zecotek Photonics Inc
*Details on Overview, Products and Services, Financials, Strategy & Development Might Not Be Capturedin Case of Unlisted Companies.
List of Tables (76 Tables)
Table 1 Global Scintillator Market Size, By Application, 2013-2020 ($Million)
Table 2 Global Scintillator Market Size, By End Product, 2013-2020 ($Million)
Table 3 Impact Analysis of the Market Drivers
Table 4 Impact Analysis of Restraints
Table 5 Alternatives to He-3 for Neutron Detection
Table 6 Scintillator Market Size, By Composition of Material, 2013-2020 ($Million)
Table 7 Inorganic Scintillator Market Size, By Type, 2013-2020 ($Million)
Table 8 Inorganic Scintillator Market Size, By Application, 2013-2020 ($Million)
Table 9 Alkali Halide: Inorganic Scintillator Market Size, By Type, 2013-2020 ($Million)
Table 10 Alkali Halide: Inorganic Scintillator Market Size, By Application, 2013-2020 ($Million)
Table 11 Thalium Doped Sodium Iodideinorganic Scintillator Market Size, By Application, 2013-2020 ($Million)
Table 12 Thallium Doped Cesium Iodide: Inorganic Scintillator Market Size, By Application, 2013-2020 ($Million)
Table 13 Sodium Doped Cesium Iodide: Inorganic Scintillator Market Size, By Application, 2013-2020 ($Million)
Table 14 UN-Doped Cesium Iodide: Inorganic Scintillator Market Size, By Application, 2013-2020 ($Million)
Table 15 Europium Doped Lithium Iodide: Inorganic Scintillator Market Size, By Application, 2013-2020 ($Million)
Table 16 Physical Properties of Alkali Halide Inorganic Scintillators
Table 17 Alkali Metal Inorganic Scintillators With Applications
Table 18 Oxide Based: Inorganic Scintillator Market Size, By Type, 2013-2020 ($Million)
Table 19 Oxide Based: Inorganic Scintillator Market Size, By Application, 2013-2020 ($Million)
Table 20 BGO: Inorganic Scintillator Market Size, By Application, 2013-2020 ($Million)
Table 21 GSO: Inorganic Scintillator Market Size, By Application, 2013-2020 ($Million)
Table 22 CWO: Inorganic Scintillator Market Size, By Application, 2013-2020 ($Million)
Table 23 PWO: Inorganic Scintillator Market Size, By Application, 2013-2020 ($Million)
Table 24 Physical Properties of Select Oxide Based Inorganic Scintillators
Table 25 Oxide Based Inorganic Scintillators With Applications
Table 26 Others: Inorganic Scintillator Market Size, By Type, 2013-2020 ($Million)
Table 27 Others: Inorganic Scintillator Market Size, By Application, 2013-2020 ($Million)
Table 28 Glass: Inorganic Scintillator Market Size, By Application, 2013-2020 ($Million)
Table 29 Lanthanum Bromide: Inorganic Scintillator Market Size, By Application, 2013-2020 ($Million)
Table 30 Organic Scintillator Market Size, By Type, 2013-2020 ($Million)
Table 31 Organic Scintillator Market Size, By Application, 2013-2020 ($Million)
Table 32 Single Crystal Scintillator Market Size, By Application, 2013-2020 ($Million)
Table 33 Liquid Scintillator Market Size, By Application, 2013-2020 ($Million)
Table 34 Plastic Scintillator Market Size, By Application, 2013-2020 ($Million)
Table 35 Properties of Organic Scintillators
Table 36 Applications of Scintillators
Table 37 Global Scintillator Market Size, By Application, 2013-2020 ($Million)
Table 38 Scintillator Market Size in Healthcare, By End Product, 2013-2020 ($Million)
Table 39 Scintillator Market Size in Healthcare, By Geography, 2013-2020 ($Million)
Table 40 Scintillator Market Size in Homeland Security, By End Product, 2013-2020 ($Million)
Table 41 Scintillator Market Size in Homeland Security, By Geography, 2013-2020 ($Million)
Table 42 Scintillator Market Size in Nuclear Power Plant, By End Product, 2013-2020 ($Million)
Table 43 Scintillator Market Size in Nuclear Power Plant, By Geography, 2013-2020 ($Million)
Table 44 Scintillator Market Size in Industrial, By End Product, 2013-2020 ($Million)
Table 45 Scintillator Market Revenue in Industrial, By Geography, 2013-2020 ($Million)
Table 46 Scintillator Market Size in Other Applications, By End Product, 2013-2020 ($Million)
Table 47 Scintillator Market Size in Other Applications, By Geography, 2013-2020 ($Million)
Table 48 Scintillator Market Size, By End Product, 2013-2020 ($Million)
Table 49 Scintillator Market Size in Personal/Pocket Size Systems, By Application, 2013-2020 ($Million)
Table 50 Scintillator Market Size in Personal/Pocket Size Systems, By Geography, 2013-2020 ($Million)
Table 51 Scintillator Market Size in Hand-Held Instruments, By Application, 2013-2020 ($Million)
Table 52 Scintillator Market Size in Hand-Held Instruments, By Geography, 2013-2020 ($Million)
Table 53 Scintillator Market Size for Fixed, Installed, Automatic Instruments, By Application, 2013-2020 ($Million)
Table 54 Scintillator Market Size for Fixed, Installed, Automatic Instruments, By Geography, 2013-2020 ($Million)
Table 55 Global Scintillator Market Size, By Geography, 2013-2020 ($Million)
Table 56 Americas: Scintillator Market Size, By End Product, 2013-2020 ($Million)
Table 57 Americas: Scintillator Market Size, By Application, 2013-2020 ($Million)
Table 58 Americas: Scintillator Market Size, By Region, 2013-2020 ($Million)
Table 59 Americas: Scintillator Market Size, By Country, 2013-2020 ($Million)
Table 60 Europe: Scintillator Market Size, By End Product, 2013-2020 ($Million)
Table 61 Europe: Scintillator Market Size, By Application, 2013-2020 ($Million)
Table 62 Europe: Scintillator Market Size, By Country, 2013-2020 ($Million)
Table 63 APAC: Scintillator Market Size, By End Product, 2013-2020 ($Million)
Table 64 APAC: Scintillator Market Size, By Application, 2013-2020 ($Million)
Table 65 APAC: Scintillator Market Size, By Country, 2013-2020 ($Million)
Table 66 ROW: Scintillator Market Size, By End Product, 2013-2020 ($Million)
Table 67 ROW: Scintillator Market Size, By Application, 2013-2020 ($Million)
Table 68 ROW: Scintillator Market Size, By Country, 2013-2020 ($Million)
Table 69 Market Rankings of the Key Players in 2013 ($Billion)
Table 70 New Product Developments/Launches, 2011-2013
Table 71 Others (Expansions and Awards), 2011-2014
Table 72 Patents, 2011-2014
Table 73 Mergers and Acquisitions, 2011-2014
Table 74 Partnerships, Agreements and Joint Ventures, 2011-2014
Table 75 Contracts, 2011-2013
Table 76 Hitachi Metals' Ceramic Scintillator Information
List of Figures (52 Figures)
Figure 1 Scintillator Market Segmentation
Figure 2 Research Methodology
Figure 3 Market Size Estimation
Figure 4 Market Crackdown & Data Trinangulation
Figure 5 Process of Radiation Detection
Figure 6 Scintillator Market Segmentation
Figure 7 Timeline of Scintillator Development
Figure 8 Scintillator Market Value Chain
Figure 9 Porter�s Five forces Analysis for the Scintillator Market
Figure 10 Degree of Competition in Scintillator Market
Figure 11 Bargaining Power of the Buyer in the Scintillator Market
Figure 12 Bargaining Power of the Supplier in Scintillator Market
Figure 13 Threat From Substitutes in the Scintillator Market
Figure 14 Threat of New Entrants in the Scintillator Market
Figure 15 Difference Between Organic and Inorganic Scintillators
Figure 16 Scintillator Market Segmentation By Composition of Material
Figure 17 Market Segmentation, By Application
Figure 18 Market Segmentation, By End Product
Figure 19 Scintillator Market, By Geography
Figure 20 Americas Scintillator Market, By Country
Figure 21 Europe Scintillator Market, By Country
Figure 22 APAC Scintillator Market, By Country
Figure 23 ROW Scintillator Market, By Country
Figure 24 Scintillator Market: Competitive Landscape
Figure 25 Key Growth Strategies in Scintillator Market
Figure 26 Applied Scintillation Technologies: Products
Figure 27 Applied Scintillation Technologies: Markets Served
Figure 28 Argus Imaging Bv inc: Business Segment
Figure 29 Argus Imaging Bv Inc.: Services
Figure 30 Canberra Industries : Products and Applications
Figure 31 Hamamatsu Photonic K.K.: Company Snapshot
Figure 32 Hamamatsu Photonics K.K. : Business Division and Products
Figure 33 Hamamatsu Photonics K.K. : SWOT Analysis
Figure 34 Hitachi Metals: Company Snapshot
Figure 35 Hitachi Metals Ltd: Operating Segments
Figure 36 Hitachi Metals Ltd: Product Portfolio
Figure 37 Hitachi Metals Ltd: SWOT Analysis
Figure 38 Ludlum Measurements Inc: Products and Applications
Figure 39 Mirion Technologies : Company Snapshot
Figure 40 Mirion Technologies Inc. : Products and Applications
Figure 41 Mirion Technologies Inc.: SWOT Analysis
Figure 42 Radiation Monitoring Devices Inc: Business Division
Figure 43 Radiation Monitoring Devices Inc: Radiation Detection and Imaging Materials
Figure 44 Radiation Monitoring Devices Inc.: Product Portfolio
Figure 45 Rexon Components and TLD Systems Inc.: Products
Figure 46 Saint Gobain: Company Snapshot
Figure 47 Saint Gobain: Operating Segments
Figure 48 Saint Gobain: Radiation Detection Product Portfolio
Figure 49 Saint Gobain: SWOT Analysis
Figure 50 Zecotek Photonics Inc: Company Snapshot
Figure 51 Zecotek Photonics Inc: Business Segment
Figure 52 Zecotek Photonics: SWOT Analysis


Growth opportunities and latent adjacency in Scintillator Market