Light Control Switches Market by Product Type (Switches, Dimmers), Communication Technology (Wired, Wireless), End-use Application, Switch Solutions (Standalone, Integrated), Light Source, Geography - Global Forecast to 2025


The light control switches industry is estimated to grow from USD 6.6 billion in 2020 to USD 10.2 billion by 2025, growing at a CAGR of 8.9% during the forecast period.
A light switch can be defined as a device that is used to operate electrical lamps and lighting fixtures. Generally, light switches have been synonymous with simple manual on/off switches; however, rapid changes in lighting technologies during the last decade have led to the evolution of sensor-based switches, timer switches, and other advanced switches.
A dimmer is a kind of switch which regulates the luminosity of the installed lights/lighting system rather than just switching it on and off. Smart lighting control switches and dimmers consist of automated controls, which can adjust the lighting based on criteria such as occupancy and daylight. These control devices can also switch lights on and off or dim them in accordance with time, events, alarms, or manual override.
Light control switches and dimmers use different communication technologies for communication between connected devices depending on the requirement of the application/use case. These devices use both wired and wireless communication technologies, where the associated cost and complexity restrict the deployment of conventional wired controls. Light control switches and dimmers can be either a standalone light control solution or an integrated light control solution.

Light Control Switches Market Forecast to 2025
To know about the assumptions considered for the study, Request for Free Sample Report
Light Control Switches Market Dynamics:
Driver: Ongoing and upcoming smart city projects in developing economies
Smart cities are an application of the Internet of Things (IoT), which helps the growth of smart lighting initiatives to maintain a secure lighting network with an expanding array of city-to-citizen data-enabled products and services. There is a huge opportunity for smart lighting projects as cities are willing to implement them in their locality. The adoption of LED street lighting has shown about 50-70% energy savings as compared to traditional lighting and hence presents an urgency to raise the adoption of LED adoption across the global market. Los Angeles is one of the early adopters of LED streetlights. To date, the city has installed more than 180,000 units, which amounted to 65% of energy savings and CO2 reduction of 65,000 metric tons per year. Jakarta, Indonesia, has plans of replacing over 90,000 streetlights with LED lighting systems, thereby targeting to achieve about 70% energy savings.
The main objective of a smart city is to use electricity efficiently to achieve sustainability; this can be achieved with the advent of smart lighting solutions. Smart lighting solutions, integrated with advanced light control switches, increase energy efficiency and promise to deliver reliable performance. Demand for smart home technologies equipped with voice control and growth in smart home offerings (e.g., Amazon Alexa, Apple’s Home Kit, Google’s Nest, Samsung’s SmartThings) are creating more opportunities for implementing smart lighting solutions. Such developments in the smart lighting solution market are helping in increasing the demand for light control switches to enable efficient performance and reliability.
Restraint: Privacy and security issues with smart lighting control systems
The emergence of connected lighting solutions integrated with smart homes, offices, and warehouses is the beginning of a new era pertaining to the green strategy. With the help of IoT devices such as security systems, door locks, lighting, and thermostats, everyday items are now connected to the Internet, which makes the lives of users easy. While the usefulness of IoT devices is well-known, something that is not highlighted is the potential risk it tags along with Wi-Fi home networks. As the system is connected to the Internet, it becomes an exploiting area for hackers and increases the possibility of messing with smart lighting, security systems, door unlocking systems, etc. A connected lighting system is a sophisticated array of LED features with built-in sensors and cameras connected to the wireless network. Since all the collected data is stored on the cloud, it becomes vulnerable to a wide range of attacks.
Opportunity: Growing inclination towards energy-efficient lighting solutions
The rapid depletion of natural resources and global warming have generated an indispensable need for energy conservation across the globe. Both government and organizations across the world are working on reducing energy consumption by adopting smart LED lighting solutions integrated with advanced luminaire switches. Energy-efficiency programs, such as the ENERGY STAR certification and Lighting Design Lab certification by the US Environmental Protection Agency, are some of the programs aimed at highlighting the importance and need for energy efficiency. These programs actively encourage and promote the use of energy-efficient lighting sources that help organizations and households across the globe to achieve energy efficiency and reduce their carbon footprints. Along with that, the FIFA World Cup 2018, held in Russia, also contributed significantly to the global LED market by increasing the construction of sports infrastructures. This led to significant growth in the lighting solutions and switches market across the globe.
According to the US EIA, the residential and commercial sectors consumed around 232 billion kilowatt-hours of electricity for lighting in 2018, which is approximately 8% of the total electricity consumed in both sectors. The electricity consumption by the residential and commercial sectors for lighting in 2016 was 10% of the total electricity consumption. This decline is primarily due to the use of energy-efficient smart LED lighting solutions. Thus, the rising requirement for energy-efficient lighting solutions would result in a high demand for smart lighting systems and light control switches.
Challenge: Interoperability issues between different network components
IoT is transforming the way devices interact with each other by integrating smart homes, warehouses, and offices with connected lighting solutions. However, interoperability issues between different network components are hampering the IoT business. Traditional lighting control systems usually consist of hardware and software manufactured by the same manufacturer, whereas, in connected lighting solutions, controls are developed by different manufacturers. The lack of interoperability prevents devices from connecting autonomously, discovering each other, and collaboratively engaging with other smart devices and services, which is a barrier for companies to build automated ecosystems. Such issues are the consequence of factors such as vendor lock-in, problems in developing cross-platform IoT applications, and difficulties in plugging non-interoperable IoT devices into different IoT platforms. Hence, there is a need for establishing standard protocols to develop compatible products. Several organizations such as The Connected Lighting Alliance (TCLA) and the ZigBee Alliance are trying to standardize the protocols used in connected lighting technologies so that luminaires could be used to collect and share data for analytics purposes.
Light Control Switches Market Segment Insights:

Based on product, switches accounted for the largest share of the light control switches market in 2020
Electronic switches held a major share of the light control switches market in 2020 and similar trend is expected to continue during the forecast period. The market for electronic switches is also expected to grow at a higher CAGR during the forecast period, due to the rise in the number of units of smart switches installed for various indoor end-use applications. Switches are one of the most common interfaces between the lighting system and the occupant. They are mainly used to operate and control an electric light. A switch can be permanently connected or can be installed on electrical outlets, depending on its application or use. A switch is used for different purposes and provides more flexible lighting. It saves energy and helps in extending the lifespan of the lighting source.
Based on solution type, standalone light control solutions to dominate light control switches market during forecast period
Standalone light control solutions held the major share in the overall light control switches market in 2020. This is mainly due to their long presence in the market and cost-effectiveness. Standalone lighting control products include sensors, switches, and dimmers, which are hard-wired to control light fixtures in a room with no communication outside the space. Usually, most of the traditional lighting control products are referred to as standalone lighting control solutions. In general, along with retrofitted traditional or LED lights and luminaries, standalone lighting control solutions are installed along with a set of controls for each room. These solutions are simple, require primarily localized wiring changes, and thus are very cost-effective.
DALI protocol to account for major share of light control switches market for wired communication protocol during forecast period
DALI protocol held largest share among all wired communication technology in 2020 and is expected to dominate the market during the forecast period. As of now, DALI is the predominant communication technology used owing to its ease of installation, open protocol, and requirement of less branch wiring than traditional controls.
DALI is a standard protocol that is followed in the US along with the European Standard 60929 and NEMA 243-2004. In the lighting control and management system market, DALI provides centralized control daylighting and occupant control capabilities, enables application flexibility, and provides significant energy savings. DALI can be used for scene selection and for getting feedback regarding faulty light sources, which makes this protocol useful in cases where remote supervising is required. A DALI system could be as small as a single luminaire. It is also scalable to multiple systems across a building or more where DALI systems can be connected using lighting hubs/routers.
Based on indoor application, commercial segment likely to witness fastest growth during the forecast period
The light control switches market for indoor applications has been segmented into residential, commercial, industrial, and others. The light control switches market for commercial application is expected to grow at the highest CAGR during the forecast period due to the increase in demand for smart lighting control products such as electronic switches and wireless dimmers. Commercial spaces such as offices, malls, and retail shops, which are usually large in terms of area, require an efficient lighting system to help control the cost of electricity.
Regional Insights:

Light Control Switches Market by Region
To know about the assumptions considered for the study, download the pdf brochure
US to hold major share of light control switches market in North America during forecast period
The US held the major share of the North American light control switches market in 2020, mainly due to the presence of major manufacturers of light control switches and dimmers along with the demand from various sectors for lighting control systems. Mandates and regulations by the US government over energy consumption are also among the key factors driving the light control switches market in the US. The US is expected to remain the largest market for light control switches in North America despite an uneven economic recovery, which includes increasing GDP growth but low wage rates. The building codes in the US are increasingly being designed to create energy-efficient building systems. According to the US Department of Energy, lighting contributes to almost 16% of the overall energy consumption. Hence, building codes are mandating energy-efficient light sources and technologies to reduce energy consumption through lighting. The energy consumption by residential and commercial buildings in the US is growing and accounts for a major share of the ever-increasing energy consumption in the country.
Germany to lead light control switches market in Europe during the forecast period
Germany is expected to dominate the European light control switches market during the forecast period. It held the largest share in 2020, mainly due to its robust economy, high standard of living of its citizens, and its commitment to reduce its carbon footprint. The adoption of Industry 4.0 is expected to further boost the market for light control switches and dimmers for indoor end-use application in the country. Germany is Europe’s economic powerhouse and plays a crucial role in the European market for light control switches and dimmers. The German population prefers well-equipped smart homes. Moreover, in the next 4–5 years, the number of new households is expected to rise, which would offer opportunities for new and innovative lighting solutions.
Key Market Players
The light control switches market is a highly competitive market, with a large number of global and regional players operating in this market. Some of the key players in the light control switches market are Signify (Philips Lighting N.V.) (Netherlands), Legrand S.A. (France), Leviton Manufacturing Company, Inc. (US), Lutron Electronics (US), and Eaton Corporation (Ireland). These players have adopted various growth strategies such as contracts, joint ventures, partnerships & agreements, acquisitions, and new product launches to further expand their presence in the light control switches market.
Signify is an industry leader in the lighting market. The company’s market experience and brand name allow it to capitalize on the fundamental market dynamics in the lighting industry and deliver innovative solutions that create value and ensure its growth. The company aims to further invest in connected lighting systems to win contracts related to the supply of connected lighting systems and other lighting control equipment. It also adopts the strategy of acquisition. For instance, in October 2019, Signify acquired Cooper Lighting Solutions from Eaton. This acquisition would strengthen its position in the North American lighting market. Also, in April 2019, it acquired WiZ Connected—a developer of the WiZ Wi-Fi-based connected lighting ecosystem. This acquisition will allow Signify to extend its leadership position in the Wi-Fi-based smart lighting control switches market.
Legrand is a global specialist in electrical and digital building infrastructure. The company has a strong product portfolio pertaining to the light control switches market. This enables the company to maintain its leading position in this market. Legrand focuses on growth strategies such as acquisitions, partnerships, and product launches. For instance, in May 2019, the company launched wireless DLM systems, which are designed for easy installation, which, in turn, saves cost and time, thereby benefiting engineers, electrical contractors, and facility managers needing reliable, code-compliant lighting controls. In December 2018, the company acquired Kenall, a leading manufacturer of innovative, energy-efficient, and sustainable specification-grade lighting and control solutions.
Leviton delivers a range of innovative and reliable indoor and outdoor lighting and control solutions, specifically designed to maximize performance, energy efficiency, and cost savings. The company emphasizes on the development of new products and solutions with a few advanced technologies for the customers across the world. For instance, in January 2019, the company introduced two new devices— Decora Smart Wi-Fi and Smart Z-Wave Plus In-Wall Receptacle’s—for homeowners to control their lamps, small appliances, and other electronics. Leviton has adopted the strategies of collaborations and partnerships to grow in the light control switches market. For instance, in November 2019, it acquired Viscor, Canada’s largest independent lighting manufacturer, which specializes in lighting for architectural, commercial, medical, institutional, and industrial applications. With this acquisition, Leviton strengthened its ability to expand its lighting and controls product offerings.
Lutron is a leading provider of energy-saving wireless light and shade controls. Its partners and affiliations are its key strengths, and product recalls the primary area of concern. It is an established player with significant experience in providing energy management and lighting management systems for industrial, residential, and commercial applications. However, the company has a huge dependency on North America for its revenue. The ongoing integration of IoT in various lighting applications could create ample opportunities for the company, which, in turn, could positively impact its profitability.
Light Control Switches Market Report Scope
|
Report Metric |
Details |
| Market size value in 2020 | USD 6.6 Billion |
| Market size value in 2025 | USD 10.2 Billion |
| Growth rate | CAGR of 8.9% |
| Market Size Available for years | 2017-2025 |
| Base year considered | 2019 |
| Forecast Period | 2020-2025 |
| Forecast units (for market in terms of value) | USD million, USD billion |
| Segments conver |
|
| Regions cover |
|
| Companies Covered |
|
| Key Market Driver | Smart City Projects In Developing Economies |
| Largest Growing Region | Asia Pacific |
| Largest Market Share Segment | Light Control Switches |
| Highest CAGR Segment | Commercial Application |
Light Control Switches Market Segmentation
Market, by Product Type
- Switches
- Manual On/Off Switches
- Toggle switches
- Rocker switches
- Illuminated switches
- Electronic Switches
- Wireless switches
- Sensor-based switches
- Others
- Dimmers
- Wired Dimmers
- Wireless dimmers
By End-use Application
- Indoor
- Residential
- Commercial
- Industrial
- Others
- Outdoor
- Highways & Roadways Lighting
- Architectural Lighting
- Lighting for Public Places
By Communication Protocol
- Wired
- DALI
- PLC
- Wired Hybrid Protocols
- Wireless
- ZigBee
- Bluetooth/BLE
- EnOcean
- Wi-Fi
- Wireless Hybrid Protocols
By Switch Solution
- Standalone switch solution
- Integrated switch solution
By Light source
- Incandescent
- Fluorescent
- Compact Fluorescent Lamp (CFL)
- Linear Fluorescent Lamp (LFL)
- High-Intensity Discharge
- Light-Emitting Diode (LED)
By Geography
- North America
- Europe
- APAC
- RoW
Light Control Switches Market Highlights:

Recent Developments
- In May 2022, Signify completed the acquisition of Fluence from ams OSRAM (SIX: AMS).
- In March 2022, ams OSRAM (SIX: AMS) expanded its partnership with Roleds, a global smart IoT solutions provider specialized in smart city lighting, to provide highly innovative and efficient LED lighting technology.
- In October 2021, Hubbell Incorporated (NYSE: HUBB) entered into a definitive agreement to sell its commercial and industrial Lighting business to GE Current, a Daintree company
- In February 2020, Signify introduced a new integrated Philips Combo Charge Controller for streetlights, enabling the emergence of a hybrid solar system.
- In September 2019, Signify announced the launch of various smart lighting products, including the Hue Smart Button to control the Hue lights.
- In September 2019, Osram announced that it would install over 1,300 LED luminaires at the Beijing Daxing International Airport. The installed luminaires would be controlled intelligently by a central system.
- In July 2019, Leviton partnered with Alarm.com as an approved provider of certain Z-Wave lighting controls for Alarm.com installations.
Key Benefits of the Report/Reason to Buy
Target Audience
Frequently Asked Questions (FAQ):
What is the current size of the light control switches market?
The light control switches market is projected to grow from USD 6.6 billion in 2020 to USD 10.2 billion by 2027, at a CAGR of 8.9% from 2022 to 2027.
Who are the winners in the light control switches market?
Signify (Philips Lighting N.V.) (Netherlands), Legrand S.A. (France), Leviton Manufacturing Company, Inc. (US), Lutron Electronics (US), and Eaton Corporation (Ireland) are some of the key players in light control switches market.
What are the key emerging trends in light control switches market?
Innovations in IoT and technological developments have enhanced the traditional lighting control systems by embedding miniaturized sensors and controllers to control luminaires, thereby adding intelligence to the entire lighting system.
What are the factors driving the growth of the market?
The most significant factor driving the growth of this market is the requirement of energy-efficient connected lighting controls. This requirement is due to the increased awareness toward reducing energy consumption.
Which region is expected to offer lucrative growth opportunity the in light control switches market?
The light control switches market in APAC is expected to grow at the highest CAGR during the forecast period. This growth can be attributed to the rapid infrastructure building activities being undertaken in APAC, mainly in China, where smart lighting paves the way for the modernization of infrastructure.
What are the emerging application areas in light control switches market?
The light control switches market for outdoor end-use application is expected to grow at a higher CAGR during the forecast period. This growth is mainly due to the increasing focus on enhancing connectivity by constructing roads and installing lights for these roads, especially in the developing countries in the APAC region. This, in turn, would spur the growth of the outdoor light control switches market.
What are the major challenges in light control switches market?
Interoperability issues between different network components are proving to be a challenge for the light control switches market.
Who are the emerging leaders in light control switches market?
The major emerging leaders in light control switches market are LSI Industries, Inc., Helvar, Rako Controls, Havells India Limited, and NexLight.
Which communication technology in light control switches market is expected to dominate by 2025?
As of now, DALI is the predominant communication technology used owing to its ease of installation, open protocol, and requirement of less branch wiring than traditional controls. However, the technology is not seen as a dominant protocol in the future due to the escalated demand for wireless technologies.
Which region is expected to dominate light control switches market?
APAC region is likely to dominate light control switches market by 2025. Increasing construction activities in Asia Pacific are contributing significantly to the growth of the light control switches market in the region. There are several new opportunities for energy-efficient lighting and advanced lighting controls in the next few years as ~200 million homes and ~18 million homes are expected to be constructed in China and India, respectively.
To speak to our analyst for a discussion on the above findings, click Speak to Analyst
 Exclusive indicates content/data unique to MarketsandMarkets and not available with any competitors.
TABLE OF CONTENTS
1 INTRODUCTION
1.1 Study Objectives
1.2 Definition
1.2.1 Inclusions and Exclusions
1.3 Scope
1.3.1 Markets Covered
1.3.2 Geographic Scope
1.3.3 Years Considered for the Study
1.4 Currency
1.5 Stakeholders
2 RESEARCH METHODOLOGY
2.1 Research Data
2.1.1 Secondary Data
2.1.1.1 Key Data from Secondary Sources
2.2 Primary Data
2.2.1 Primary sources
2.2.2 Key Industry Insights
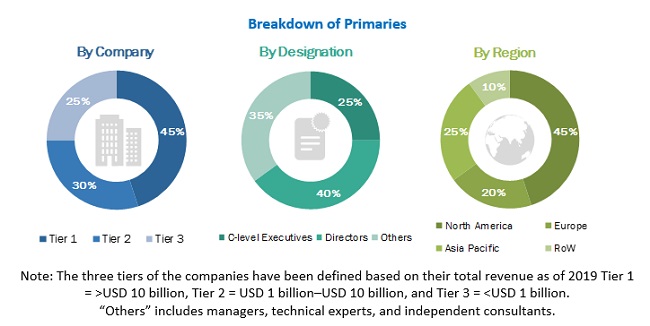
2.2.3 Breakdown of Primaries
2.3 Market Size Estimation
2.3.1 Bottom-Up Approach
2.3.2 Top-Down Approach
2.4 Market Breakdown and Data Triangulation
2.5 Research Assumptions
3 EXECUTIVE SUMMARY
4 PREMIUM INSIGHT
5 MARKET OVERVIEW
5.1 Introduction
5.2 Market Dynamics
5.2.1 Drivers
5.2.2 Restraints
5.2.3 Opportunities
5.3 Value Chain Analysis
6 LIGHT CONTROL SWITCHES MARKET, BY PRODUCT TYPE
6.1 Introduction
6.2 Switches
6.2.1 Manual ON/OFF Switches
6.2.2 Electronic Switches
6.3 Dimmers
6.3.1 Wired Dimmers
6.3.2 Wireless Dimmers
7 MARKET, BY SOLUTION TYPE
7.1 Introduction
7.2 Standalone Light Control Solutions
7.3 Integrated Light Control Solutions
8 LIGHT CONTROL SWITCHES MARKET, BY COMMUNICATION TECHNOLOGY
8.1 Introduction
8.2 Wired Technology
8.2.1 DALI
8.2.2 PLC
8.2.3 Wired Hybrid Protocols
8.3 Wireless Technology
8.3.1 ZigBee
8.3.2 Wi-Fi
8.3.3 BLE
8.3.4 EnOcean
8.3.5 Wireless Hybrid Protocols
9 MARKET, BY END-USE APPLICATION
9.1 Introduction
9.2 Indoor
9.2.1 Residential
9.2.2 Commercial
9.2.3 Industrial
9.2.4 Others
9.3 Outdoor
9.3.1 Highways & Roadways Lighting
9.3.2 Architectural Lighting
9.3.3 Lighting For Public Places
10 LIGHT CONTROL SWITCHES MARKET, BY LIGHT SOURCE
10.1 Introduction
10.2 Incandescent
10.3 Fluorescent (FL)
10.4 High-Intensity Discharge (HID)
10.5 Light-Emitting diode (LED)
11 MARKET, BY GEOGRAPHY
11.1 Introduction
11.2 North America
11.2.1 US
11.2.2 Canada
11.2.3 Mexico
11.3 Europe
11.3.1 France
11.3.2 Germany
11.3.3 UK
11.3.4 Spain
11.3.5 Italy
11.3.6 Rest of Europe
11.4 APAC
11.4.1 China
11.4.2 Japan
11.4.3 India
11.4.4 South Korea
11.4.5 Rest of APAC
11.5 RoW
11.5.1 Middle East & Africa
11.5.2 South America
12 COMPETITIVE LANDSCAPE
12.1 Introduction
12.2 Market Analysis, 2019
12.3 Competitive Scenario
12.3.1 New Product Developments
12.3.2 Mergers & Acquisitions
12.3.3 Partnerships, Collaborations, Contracts
12.4 Competitive Leadership Mapping
12.4.1 Visionary Leaders
12.4.2 Dynamic Differentiators
12.4.3 Innovators
12.4.4 Emerging Companies
13 COMPANY PROFILES
13.1 Introduction
13.2 Key Players
13.2.1 Signify
13.2.2 Legrand
13.2.3 Leviton manufacturing company, Inc
13.2.4 Lutron electronics co., Inc.
13.2.5 Eaton
13.2.6 Osram
13.2.7 Hubbell
13.2.8 Acuity Brands
13.2.9 Honeywell
13.2.10 Schneider Electric
13.2.11 Havells
13.3 Other Important Players
13.3.1 DIALIGHT PLC
13.3.2 HELVAR
13.3.3 Zumtobel Group AG
13.3.4 ABB
13.3.5 Siemens
13.3.6 GE
13.3.7 Ideal Industries
13.4 Key Innovators
13.4.1 LIGHTWAVERF PLC
13.4.2 RAB Lighting
13.4.3 SYNAPSE WIRELESS, INC. (MCWANE, INC.)
13.4.4 Panasonic
14 APPENDIX
14.1 Insights from Industry Experts
14.2 Discussion Guide
14.3 Knowledge Store
14.4 Available Customizations
14.5 Related Reports
14.6 Author Details
LIST OF TABLES (105 Tables)
TABLE 1 LIGHT CONTROL SWITCHES MARKET, BY PRODUCT TYPE, 2017–2025 (USD MILLION)
TABLE 2 SWITCHES MARKET, BY SWITCH TYPE, 2017–2025 (USD MILLION)
TABLE 3 ELECTRONIC SWITCHES MARKET, BY SWITCH TYPE, 2017–2025 (USD MILLION)
TABLE 4 DIMMERS MARKET, BY DIMMER TYPE, 2017–2025 (USD MILLION)
TABLE 5 MARKET, BY SOLUTION TYPE, 2017–2025 (USD MILLION)
TABLE 6 MARKET, BY COMMUNICATION TECHNOLOGY, 2017–2025 (USD MILLION)
TABLE 7 MARKET FOR WIRED COMMUNICATION TECHNOLOGY, BY TYPE, 2017–2025 (USD MILLION)
TABLE 8 MARKET FOR WIRED COMMUNICATION TECHNOLOGY, BY REGION, 2017–2025 (USD MILLION)
TABLE 9 WIRELESS LIGHTING PROTOCOLS
TABLE 10 MARKET FOR WIRELESS COMMUNICATION TECHNOLOGY, BY TYPE, 2017–2025 (USD MILLION)
TABLE 11 MARKET FOR WIRELESS COMMUNICATION TECHNOLOGY, BY REGION, 2017–2025 (USD MILLION)
TABLE 12 MARKET, BY END-USE APPLICATION, 017–2025 (USD MILLION)
TABLE 13 MARKET, BY INDOOR END-USE APPLICATION, 2017–2025 (USD MILLION)
TABLE 14 MARKET FOR INDOOR END-USE APPLICATION, BY REGION, 2017–2025 (USD MILLION)
TABLE 15 MARKET FOR INDOOR END-USE APPLICATION IN APAC, BY COUNTRY, 2017–2025 (USD MILLION)
TABLE 16 MARKET FOR INDOOR END-USE APPLICATION IN EUROPE, BY COUNTRY, 2017–2025 (USD MILLION)
TABLE 17 MARKET FOR INDOOR END-USE APPLICATION IN NORTH AMERICA, BY COUNTRY, 2017–2025 (USD MILLION)
TABLE 18 LIGHT CONTROL SWITCHES MARKET FOR INDOOR END-USE APPLICATION IN ROW, BY REGION, 2017–2025 (USD MILLION)
TABLE 19 MARKET FOR RESIDENTIAL APPLICATION, BY REGION, 2017–2025 (USD MILLION)
TABLE 20 MARKET FOR COMMERCIAL APPLICATION, BY REGION, 2017–2025 (USD MILLION)
TABLE 21 MARKET FOR INDUSTRIAL APPLICATION, BY REGION, 2017–2025 (USD MILLION)
TABLE 22 MARKET FOR OTHER APPLICATIONS, BY REGION, 2017–2025 (USD MILLION)
TABLE 23 MARKET, BY OUTDOOR END-USE APPLICATION, 2017–2025 (USD MILLION)
TABLE 24 MARKET FOR OUTDOOR END-USE APPLICATION,BY REGION, 2017–2025 (USD MILLION)
TABLE 25 MARKET FOR OUTDOOR END-USE APPLICATION IN APAC, BY COUNTRY, 2017–2025 (USD MILLION)
TABLE 26 MARKET FOR OUTDOOR END-USE APPLICATION IN EUROPE, BY COUNTRY, 2017–2025 (USD MILLION)
TABLE 27 MARKET FOR OUTDOOR END-USE APPLICATION IN NORTH AMERICA, BY COUNTRY, 2017–2025 (USD MILLION)
TABLE 28 MARKET FOR OUTDOOR END-USE APPLICATION IN ROW, BY REGION, 2017–2025 (USD MILLION)
TABLE 29 LIGHT CONTROL SWITCHES MARKET FOR HIGHWAYS & ROADWAYS LIGHTING APPLICATION, BY REGION, 2017–2025 (USD MILLION)
TABLE 30 MARKET FOR ARCHITECTURAL LIGHTING APPLICATION, BY REGION, 2017–2025 (USD MILLION)
TABLE 31 MARKET FOR LIGHTING FOR PUBLIC PLACES APPLICATION, BY REGION, 2017–2025 (USD MILLION)
TABLE 32 LIGHT SOURCES COMPARISON
TABLE 33 MARKET, BY REGION, 2017–2025 (USD MILLION)
TABLE 34 MARKET IN NORTH AMERICA, BY END-USE APPLICATION, 2017–2025 (USD MILLION)
TABLE 35 MARKET IN NORTH AMERICA, BY INDOOR END-USE APPLICATION, 2017–2025 (USD MILLION)
TABLE 36 MARKET IN NORTH AMERICA, BY OUTDOOR END-USE APPLICATION, 2017–2025 (USD MILLION)
TABLE 37 MARKET IN NORTH AMERICA, BY COMMUNICATION TECHNOLOGY, 2017–2025 (USD MILLION)
TABLE 38 LIGHT CONTROL SWITCHES MARKET IN NORTH AMERICA, BY COUNTRY, 2017–2025 (USD MILLION)
TABLE 39 MARKET IN US, BY END-USE APPLICATION, 2017–2025 (USD MILLION)
TABLE 40 MARKET IN CANADA, BY END-USE APPLICATION, 2017–2025 (USD MILLION)
TABLE 41 MARKET IN MEXICO, BY END-USE APPLICATION, 2017–2025 (USD MILLION)
TABLE 42 MARKET IN EUROPE, BY END-USE APPLICATION, 2017–2025 (USD MILLION)
TABLE 43 MARKET IN EUROPE, BY INDOOR END-USE APPLICATION, 2017–2025 (USD MILLION)
TABLE 44 MARKET IN EUROPE, BY OUTDOOR END-USE APPLICATION, 2017–2025 (USD MILLION)
TABLE 45 MARKET IN EUROPE, BY COMMUNICATION TECHNOLOGY, 2017–2025 (USD MILLION)
TABLE 46 MARKET IN EUROPE, BY COUNTRY, 2017–2025 (USD MILLION)
TABLE 47 MARKET IN UK, BY END-USE APPLICATION, 2017–2025 (USD MILLION)
TABLE 48 MARKET IN GERMANY, BY END-USE APPLICATION, 2017–2025 (USD MILLION)
TABLE 49 MARKET IN FRANCE, BY END-USE APPLICATION, 2017–2025 (USD MILLION)
TABLE 50 MARKET IN ITALY, BY END-USE APPLICATION, 2017–2025 (USD MILLION)
TABLE 51 MARKET IN SPAIN, BY END-USE APPLICATION, 2017–2025 (USD MILLION)
TABLE 52 LIGHT CONTROL SWITCHES MARKET IN REST OF EUROPE, BY END-USE APPLICATION, 2017–2025 (USD MILLION)
TABLE 53 MARKET IN APAC, BY END-USE APPLICATION, 2017–2025 (USD MILLION)
TABLE 54 MARKET IN APAC, BY INDOOR END-USE APPLICATION, 2017–2025 (USD MILLION)
TABLE 55 MARKET IN APAC, BY OUTDOOR END-USE APPLICATION, 2017–2025 (USD MILLION)
TABLE 56 MARKET IN APAC, BY COMMUNICATION TECHNOLOGY, 2017–2025 (USD MILLION)
TABLE 57 MARKET IN APAC, BY COUNTRY, 2017–2025 (USD MILLION)
TABLE 58 MARKET IN CHINA, BY END-USE APPLICATION, 2017–2025 (USD MILLION)
TABLE 59 MARKET IN JAPAN, BY END-USE APPLICATION, 2017–2025 (USD MILLION)
TABLE 60 MARKET IN INDIA, BY END-USE APPLICATION, 2017–2025 (USD MILLION)
TABLE 61 MARKET IN SOUTH KOREA, BY END-USE APPLICATION, 2017–2025 (USD MILLION)
TABLE 62 MARKET IN REST OF APAC, BY END-USE APPLICATION, 2017–2025 (USD MILLION)
TABLE 63 MARKET IN ROW, BY END-USE APPLICATION, 2017–2025 (USD MILLION)
TABLE 64 MARKET IN ROW, BY INDOOR END-USE APPLICATION, 2017–2025 (USD MILLION)
TABLE 65 MARKET IN ROW, BY OUTDOOR END-USE APPLICATION, 2017–2025 (USD MILLION)
TABLE 66 MARKET IN ROW, BY COMMUNICATION TECHNOLOGY, 2017–2025 (USD MILLION)
TABLE 67 MARKET IN ROW, BY REGION, 2017–2025 (USD MILLION)
TABLE 68 MARKET IN MIDDLE EAST & AFRICA, BY END-USE APPLICATION, 2017–2025 (USD MILLION)
TABLE 69 MARKET IN SOUTH AMERICA, BY END-USE APPLICATION, 2017–2025 (USD MILLION)
TABLE 70 MARKET IN US, BY BY COMMUNICATION TECHNOLOGY, 2017–2025 (USD MILLION)
TABLE 71 MARKET IN CANADA, BY BY COMMUNICATION TECHNOLOGY, 2017–2025 (USD MILLION)
TABLE 72 MARKET IN MEXICO, BY BY COMMUNICATION TECHNOLOGY, 2017–2025 (USD MILLION)
TABLE 73 MARKET IN UK, BY COMMUNICATION TECHNOLOGY, 2017–2025 (USD MILLION)
TABLE 74 MARKET IN GERMANY, BY COMMUNICATION TECHNOLOGY, 2017–2025 (USD MILLION)
TABLE 75 MARKET IN FRANCE, BY COMMUNICATION TECHNOLOGY, 2017–2025 (USD MILLION)
TABLE 76 LIGHT CONTROL SWITCHES MARKET IN ITALY, BY COMMUNICATION TECHNOLOGY, 2017–2025 (USD MILLION)
TABLE 77 MARKET IN SPAIN, BY COMMUNICATION TECHNOLOGY, 2017–2025 (USD MILLION)
TABLE 78 MARKET IN REST OF EUROPE, BY COMMUNICATION TECHNOLOGY, 2017–2025 (USD MILLION)
TABLE 79 MARKET IN CHINA, BY COMMUNICATION TECHNOLOGY, 2017–2025 (USD MILLION)
TABLE 80 MARKET IN JAPAN, BY BY COMMUNICATION TECHNOLOGY, 2017–2025 (USD MILLION)
TABLE 81 MARKET IN SOUTH KOREA, BY COMMUNICATION TECHNOLOGY, 2017–2025 (USD MILLION)
TABLE 82 MARKET IN INDIA, BY COMMUNICATION TECHNOLOGY, 2017–2025 (USD MILLION)
TABLE 83 MARKET IN REST OF APAC, BY COMMUNICATION TECHNOLOGY, 2017–2025 (USD MILLION)
TABLE 84 LIGHT CONTROL SWITCHES MARKET IN MIDDLE EAST & AFRICA, BY COMMUNICATION TECHNOLOGY, 2017–2025 (USD MILLION)
TABLE 85 MARKET IN SOUTH AMERICA, BY COMMUNICATION TECHNOLOGY, 2017–2025 (USD MILLION)
TABLE 86 MARKET FOR WIRED COMMUNICATION TECHNOLOGY IN NORTH AMERICA, BY COUNTRY, 2017–2025 (USD MILLION)
TABLE 87 MARKET FOR WIRED COMMUNICATION TECHNOLOGY IN EUROPE, BY COUNTRY, 2017–2025 (USD MILLION)
TABLE 88 MARKET FOR WIRED COMMUNICATION TECHNOLOGY IN APAC, BY COUNTRY, 2017–2025 (USD MILLION)
TABLE 89 MARKET FOR WIRED COMMUNICATION TECHNOLOGY IN ROW, BY COUNTRY, 2017–2025 (USD MILLION)
TABLE 90 MARKET FOR WIRELESS COMMUNICATION TECHNOLOGY IN NORTH AMERICA, BY COUNTRY, 2017–2025 (USD MILLION)
TABLE 91 MARKET FOR WIRELESS COMMUNICATION TECHNOLOGY IN EUROPE, BY COUNTRY, 2017–2025 (USD MILLION)
TABLE 92 MARKET FOR WIRELESS COMMUNICATION TECHNOLOGY IN APAC, BY COUNTRY, 2017–2025 (USD MILLION)
TABLE 93 MARKET FOR WIRELESS COMMUNICATION TECHNOLOGY IN ROW, BY COUNTRY, 2017–2025 (USD MILLION)
TABLE 94 MARKET IN NORTH AMERICA, BY PRODUCT TYPE, 2017–2025 (USD MILLION)
TABLE 95 MARKET IN EUROPE, BY PRODUCT TYPE, 2017–2025 (USD MILLION)
TABLE 96 MARKET IN APAC, BY PRODUCT TYPE, 2017–2025 (USD MILLION)
TABLE 97 MARKET IN ROW, BY PRODUCT TYPE, 2017–2025 (USD MILLION)
TABLE 98 LIGHT CONTROL SWITCHES MARKET FOR SWITCHES, BY REGION, 2017–2025 (USD MILLION)
TABLE 99 MARKET FOR DIMMERS, BY REGION, 2017–2025 (USD MILLION)
TABLE 100 MARKET IN NORTH AMERICA, BY SWITCH SOLUTIONS, 2017–2025 (USD MILLION)
TABLE 101 MARKET IN EUROPE, BY SWITCH SOLUTIONS, 2017–2025 (USD MILLION)
TABLE 102 MARKET IN APAC, BY SWITCH SOLUTIONS, 2017–2025 (USD MILLION)
TABLE 103 MARKET IN ROW, BY SWITCH SOLUTIONS, 2017–2025 (USD MILLION)
TABLE 104 MARKET FOR STANDALONE SWITCH SOLUTION, BY REGION, 2017–2025 (USD MILLION)
TABLE 1O5 MARKET FOR INTEGRATED SWITCH, BY REGION, 2017–2025 (USD MILLION)
List of Figures (55 Figures)
Figure 1 Light Control Switches Market: Market Segmentation
Figure 2 Market: Process Flow of Market Size Estimation
Figure 3 Market: Research Design
Figure 4 Bottom-Up Approach to Arrive at Market Size
Figure 5 Top-Down Approach to Arrive at Market Size
Figure 6 Data Triangulation
Figure 7 Assumptions of Research Study
Figure 8 Market for Wireless Communication Technology Expected to Grow at Higher CAGR During Forecast Period
Figure 9 Outdoor End-Use Application Expected to Grow at Higher CAGR in Market During Forecast Period
Figure 10 Dimmers to Exhibit High Growth in Market During Forecast Period
Figure 11 APAC to Grow at Highest CAGR in Market During Forecast Period
Figure 12 Market Expected to Exhibit High Growth Between 2020 and 2025
Figure 13 Wireless Communication Technology to Register Higher Growth Rate During Forecast Period
Figure 14 Indoor Application to Dominate Market During Forecast Period
Figure 15 Integrated Light Control Solutions to Exhibit Higher Growth in Market During Forecast Period
Figure 16 APAC Market to Exhibit Highest CAGR During Forecast Period
Figure 17 Market: Drivers, Restraints, Opportunities, and Challenges
Figure 18 Market: Value Chain Analysis
Figure 19 Market, By Product Type
Figure 20 Switches to Dominate Market During Forecast Period
Figure 21 Lighting Control System Market, By Solution Type
Figure 22 Integrated Light Control Solutions to Exhibit High Growth in Market During Forecast Period
Figure 23 Market, By Communication Technology
Figure 24 Wired Communication Technology to Dominate Market During Forecast Period
Figure 25 DALI Protocol to Hold Largest Size of Market for Wired Communication Technology During Forecast Period
Figure 26 ZigBee Protocol to Hold Largest Size of Market for Wireless Communication Technology During Forecast Period
Figure 27 Light Control Switches Market, By End-Use Application
Figure 28 Outdoor Application Expected to Grow at A Higher CAGR in Market During Forecast Period
Figure 29 Residential Application Held Largest Size of Market for Indoor End-Use Application in 2019
Figure 30 Highways & Roadways Lighting to Hold Largest Size of Market for Outdoor Application During Forecast Period
Figure 31 Market, By Light Source
Figure 32 Market, By Region
Figure 33 Market, Geographic Snapshot
Figure 34 Snapshot: Market in North America
Figure 35 Market for Commercial End-Use Application in North America to Grow at Highest CAGR During Forecast Period
Figure 36 US to Account for Largest Share of Market in North America During Forecast Period
Figure 37 Snapshot: Market in Europe
Figure 38 Residential Indoor Application to Lead Market in Europe
Figure 39 Germany to Hold Largest Size of Market in Europe
Figure 40 Snapshot: Market in APAC
Figure 41 Commercial Indoor Application in APAC to Grow at Highest CAGR During Forecast Period
Figure 42 Market in China Expected to Grow at Highest CAGR During Forecast Period
Figure 43 Middle East & Africa Expected to Hold Larger Size of Market in RoW
Figure 44 Key Developments By Leading Players in Market From 2017 to 2020
Figure 45 Market Ranking of Top 5 Players in Market, 2019
Figure 46 Market (Global) Competitive Leadership Mapping, 2019
Figure 47 Signify: Company Snapshot
Figure 48 Legrand: Company Snapshot
Figure 49 Eaton Corporation PLC: Company Snapshot
Figure 50 OSRAM Licht AG: Company Snapshot
Figure 51 Hubbell Incorporated: Company Snapshot
Figure 52 Acuity Brands: Company Snapshot
Figure 53 Honeywell International Inc: Company Snapshot
Figure 54 Schneider Electric Se: Company Snapshot
Figure 55 Havells India Limited: Company Snapshot
The study involved four major activities for estimating the size of the light control switches market. Exhaustive secondary research has been done to collect information on the market, including its peer markets. These findings, assumptions, and sizing with industry experts across the value chain through primary research has been the next step. Both top-down and bottom-up approaches have been employed to estimate the complete market size. After that, market breakdown and data triangulation methods have been employed to estimate the market size of segments and subsegments.
Secondary Research
In the secondary research process, various secondary sources have been referred to for identifying and collecting information important for this study. Secondary sources include corporate filings (such as annual reports, press releases, investor presentations, and financial statements); trade, business, and professional associations; white papers, lighting control system-based marketing-related journals, certified publications, and articles from recognized authors; gold and silver standard websites; directories; and databases. Secondary data has been collected and analyzed to arrive at the overall market size, which has further been validated through primary research. The secondary data has been collected and analyzed to arrive at the global market size, which has also been validated by primary research.
Primary Research
In the primary research process, various primary sources from the supply and demand sides have been interviewed to obtain the qualitative and quantitative information relevant to this report. Primary sources from the supply side include key industry participants, subject matter experts (SMEs), C-level executives of key companies, and consultants from various key companies and organizations operating in the light control switches market.
Primary research has also been conducted to identify segmentation types and key players, as well as analyze the competitive landscape, key market dynamics (drivers, restraints, opportunities, and challenges), and major growth strategies adopted by market players. During market engineering, both top-down and bottom-up approaches have been extensively used, along with several data triangulation methods, to estimate and forecast the market, including the overall market segments and subsegments listed in this report. Extensive qualitative and quantitative analyses have been performed during the complete market engineering process to list the key information/insights throughout the report. Primary data has been collected through questionnaires, e-mails, and telephonic interviews.
Market Size Estimation
In the market engineering process, both top-down and bottom-up approaches, along with several data triangulation methods, have been used to estimate and validate the size of the overall market and other dependent submarkets listed in this report. Extensive qualitative and quantitative analyses have been performed during market engineering to list key information/insights.
Major players in the market have been identified through secondary research, and their market ranking has been determined through primary and secondary research. This involved studying the annual and financial reports of top market players and interviews with industry experts (such as CEOs, vice presidents, directors, and marketing executives) for key insights—both quantitative and qualitative.
All percentage shares split, and breakdowns have been determined using secondary sources and verified through primary sources. All possible parameters that affect the markets covered in this research study have been accounted for, viewed in extensive detail, verified through primary research, and analyzed to obtain the final quantitative and qualitative data. This data has been consolidated and supplemented with detailed inputs and analysis from MarketsandMarkets and presented in this report.
Data Triangulation
After arriving at the overall market size through the process explained above, the total market has been split into several segments. To complete the whole market engineering process and arrive at the exact statistics for all the segments, the market breakdown and data triangulation procedures have been employed, wherever applicable. The data has been triangulated by studying various factors and trends from both the demand and supply sides. The market has also been validated using both top-down and bottom-up approaches.
Study Objectives
- To describe and forecast the size of the light control switches market, in terms of value, by product type, end-use application, communication protocol, switch solutions, by light source and geography
- To provide market statistics with detailed classifications, along with the respective market sizes for a few of the segments
- To analyze the opportunities in market for stakeholders and detailing the competitive landscape for the market leaders
- To strategically analyze micro markets with respect to individual growth trends, prospects, and contribution to the total market
- To forecast the market size for various segments with respect to the following regions: North America, Europe, Asia Pacific (APAC), and Rest of the World (RoW)
- To provide detailed information on the major factors influencing the growth of market (drivers, restraints, opportunities, and industry-specific challenges)
- To strategically profile the key players and comprehensively analyze their market rankings and core competencies
- To analyze competitive developments such as contracts, joint ventures, mergers and acquisitions, product developments, and research and development (R&D) in market
- To benchmark players within the market using competitive leadership mapping, which analyzes market players on various parameters within the broad categories of business and product strategy
- To map the competitive intelligence based on company profiles, key player strategies, and game-changing developments such as contracts, product launches, collaborations, and acquisitions
Available Customization
With the given market data, MarketsandMarkets offers customizations according to companies’ specific needs. The following customization options are available for the report.
- Detailed analysis and profiling of additional market players (up to 5)


Growth opportunities and latent adjacency in Light Control Switches Market