Liquid Encapsulation Market by Material (Epoxy Resin & Epoxy-Modified Resin), Product (Integrated Circuits, Optoelectronics & Sensors), Application (Automotive, Telecommunication & Electronics), and Geography - Global Forecast to 2020


The semiconductor technology has rapidly evolved with the development of more advanced product and process technologies for various end users, applications, and verticals across the supply chain. For instance, according to Semiconductor Industry Association (2014); the worldwide sales for the semiconductors industry have increased from USD 77.3 Billion in 1993 to USD 305.6 Billion in 2013, with an average annual rate of increase of 7.11% per year.
Encapsulation is one of the advanced packaging processes of almost all semiconductor devices that offer low stress, low warpage, and high thermal conductivity. Encapsulation can be of two forms, namely, solid and liquid. Solid encapsulants are epoxy-molding compounds (EMC) that are a blend of solid epoxy resins, hardeners, flame retardants, fillers, and several additives. Liquid encapsulants have similar compositions, but the resin and hardener are liquid and allow the material to be directly applied onto the chip; they interconnect typically by wire bonding instead of molding. Furthermore, the encapsulants can be of three types, namely, glass, ceramic, & metal (hermetic type), plastic (non-hermetic type), and polymer (near-hermetic package (NHP)).
One of the major reasons for choosing the encapsulation technique for devices is the growing trend of miniaturization, where smaller and complex structures of devices can be managed without harming its performance. In the liquid encapsulation process, liquid encapsulant materials are implanted on the device to overcome issues such as misconnection of electrical components on devices and to ensure the proper functioning of the device.
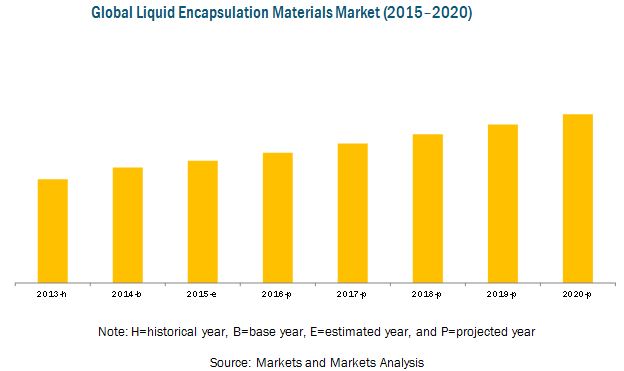
The global liquid encapsulation market is projected to grow at a CAGR of 6.7% between 2015 and 2020, from an estimated value of USD 1,011.97 Million in 2015 to USD 1,397.46 Million by 2020. APAC is estimated to account for more than 65% of the total market till 2020. It is also projected to be the fastest-growing region between 2015 and 2020 for this market, owing to the growing demand from sensors devices, wireless technologies, and optoelectronics segment. Moreover, APAC countries such as Japan, China, Taiwan, and South Korea are likely to offer a huge opportunity for the semiconductor liquid encapsulants market owing to the growing electronics and telecommunication sector in the region.
The report describes the market trends and challenges for the global liquid encapsulation materials market and forecasts the market till 2020, on the basis of material, product, application, and geography. It also features a detailed competitive landscape which includes the identification of the key players in the global liquid encapsulation materials market, in addition to identifying the major strategies adopted by these players. The report provides the drivers, restraints, opportunities, and challenges for the global liquid encapsulation market. The report estimates the global liquid encapsulation materials market in terms of value and also forecasts the same for the different regions, namely, the Americas, Europe, Asia–Pacific (APAC), and Rest of the World (RoW). It also involves the study of the market dynamics and trends in the global liquid encapsulation market. It profiles over 12 companies across the globe, along with their recent activities such as mergers & acquisitions, joint ventures, and new product developments.
The major players in the global liquid encapsulation market are Shin-Etsu Chemical Co., Ltd. (Japan), Sumitomo Bakelite Co., Ltd. (Japan), Hitachi Chemical Co. Ltd. (Japan), Henkel AG and Co. KGaA (Germany), Kyocera Corporation (Japan), Nagase & Co., Ltd. (Japan), Nitto Denko Corporation (Japan), Panasonic Corporation (Japan), BASF Se (Germany), Sanyu Rec Co. Ltd. (Japan), Resin Technical Systems (U.K.), and Epic Resins (U.S.) among others.
The global liquid encapsulation market is projected to grow at a CAGR of 6.7% between 2015 and 2020. Among all applications of global liquid encapsulation market, the electronics application is estimated to hold the major market share of the global market and telecommunication application is estimated to grow at the highest CAGR between 2015 and 2020. The market in APAC is expected to grow at the highest CAGR and is also estimated to hold the major market share till 2020.
 Exclusive indicates content/data unique to MarketsandMarkets and not available with any competitors.
Table of Contents
1 Introduction (Page No. - 16)
1.1 Objectives of the Study
1.2 Market Definition
1.3 Study Scope
1.3.1 Markets Covered
1.3.2 Years Considered for the Study
1.4 Currency
1.5 Limitations
1.6 Stakeholders
2 Research Methodology (Page No. - 21)
2.1 Research Data
2.2 Market Size Estimation
2.3 Market Breakdown and Data Triangulation
2.4 Market Size Estimation
2.4.1 Secondary Data
2.4.1.1 Key Data From Secondary Sources
2.4.2 Primary Data
2.4.2.1 Key Data From Primary Sources
2.4.3 Key Industry Insights
2.4.4 Assumptions
3 Executive Summary (Page No. - 31)
4 Premium Insights (Page No. - 36)
4.1 Global Liquid Encapsulation Market Expected to Grow at A Stable Rate Till 2020
4.2 Global liquid encapsulation material market – Product Segment
4.3 Global liquid encapsulation material market, By Application
4.4 Global liquid encapsulation material market, USD Million (2015)
4.5 Taiwan Held the Largest Share of the Global Liquid Encapsulation Market, 2015 (USD Million)
4.6 Global Liquid Encapsulation Market (2015–2020)
4.7 Global liquid encapsulation material market, By Product (2015–2020)
4.8 Life Cycle Analysis, By Geography
5 Market Overview (Page No. - 41)
5.1 Introduction
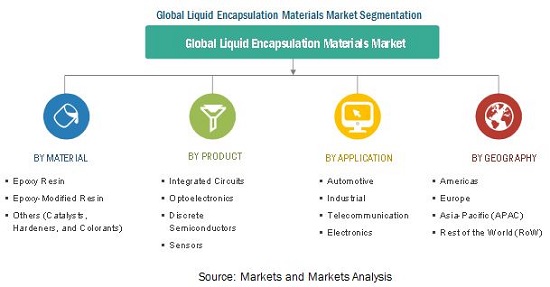
5.2 Market Segmentation
5.2.1 By Material
5.2.2 By Product
5.2.3 By Application
5.3 Market Dynamics
5.3.1 Drivers
5.3.1.1 Growing Demand for Advanced Packaging Techniques
5.3.1.2 Rising Demand for Consumer Electronics Products
5.3.1.3 Trend of Miniaturization of Electronic Products Expected to Drive the Growth of the Liquid Encapsulation Market
5.3.2 Restraints
5.3.2.1 Sluggish Demand for Liquid Encapsulants in Developed Regions Such as North America & Europe
5.3.3 Opportunities
5.3.3.1 Automotive Electronics Application Offering New Growth Avenues for the Global Liquid Encapsulation Market
5.3.4 Challenges
5.3.4.1 Recovering the Leading Position for Developed Regions in the Semiconductor Materials Industry
6 Industry Trends (Page No. - 50)
6.1 Introduction
6.2 Value Chain Analysis
6.3 Overview of Recent Patents in Liquid Encapsulation
6.4 Strategic Benchmarking
6.4.1 Major Strategies Adopted By the Key Players
7 Market, By Material (Page No. - 55)
7.1 Introduction
7.1.1 Epoxy Resins
7.1.2 Epoxy-Modified Resins
7.1.3 Other Materials
8 Market, By Product (Page No. - 62)
8.1 Introduction
8.2 Integrated Circuits
8.3 Optoelectronics
8.4 Discrete Semiconductors
8.5 Sensors
9 Market, By Application (Page No. - 70)
9.1 Introduction
9.2 Automotive
9.3 Industrial
9.4 Telecommunication
9.5 Electronics
10 Geographic Analysis (Page No. - 93)
10.1 Introduction
10.2 Americas
10.2.1 North America
10.2.1.1 U.S.
10.2.1.2 Canada
10.2.1.3 Rest of North America
10.2.2 South America
10.3 Europe
10.3.1 Germany
10.3.2 U.K.
10.3.3 France
10.3.4 Italy
10.3.5 Rest of Europe
10.4 Asia-Pacific (APAC)
10.4.1 Japan
10.4.2 China
10.4.3 Taiwan
10.4.4 South Korea
10.4.5 Rest of APAC
10.5 Rest of the World
10.5.1 Middle East
10.5.2 Africa
11 Competitive Landscape (Page No. - 135)
11.1 Overview
11.2 Key Players in Global Liquid Encapsulation Materials Market
11.3 Competitive Situation and Trends
11.3.1 New Product Launches
11.3.2 Mergers & Acquisitions
11.3.3 Other Developments
11.3.4 Expansions
11.3.5 Joint Ventures
12 Company Profiles (Page No. - 145)
(Overview, Products and Services, Financials, Strategy & Development)*
12.1 Introduction
12.2 Sumitomo Bakelite Co., Ltd.
12.3 Shin-Etsu Chemical Co., Ltd
12.4 Panasonic Coporation
12.5 Kyocera Corporation (Japan)
12.6 Hitachi Chemical Co., Ltd.
12.7 Henkel AG and Co. KGAA
12.8 Nagase & Co., Ltd.
12.9 Nitto Denko Corporation
12.10 BASF SE
12.11 EPIC Resins
12.12 Resin Technical Systems
12.13 Sanyu Rec Co., Ltd.
*Details on Overview, Products and Services, Financials, Strategy & Development Might Not Be Captured in Case of Unlisted Companies.
13 Appendix (Page No. - 173)
13.1 Insights of Industry Experts
13.2 Discussion Guide
13.3 Introducing RT: Real-Time Market Intelligence
13.4 Available Customizations
13.5 Related Reports
List of Tables (76 Tables)
Table 1 Growing Demand for Advanced Packaging Techniques and Consumer Electronics Products Would Fuel the Demand for Global Liquid Encapsulation Materials
Table 2 Sluggish Demand in Europe & the Americas Likely to Restrain the Growth of the Liquid Encapsulation Market
Table 3 Automotive Electronics Application Offering New Growth Avenues for the Liquid Encapsulation Market
Table 4 Recovering the Leading Position in the World in Semiconductor Materials Industry Presents the Major Challenge for Developed Regions
Table 5 Recent Patents Related to Liquid Encapsulation Materials in Semiconductors
Table 6 Global Liquid Encapsulation Market Size, By Material, 2013–2020 (USD Million)
Table 7 Americas: Liquid Encapsulation Materail Market Size, By Material, 2013–2020 (USD Million)
Table 8 Europe: Liquid Encapsulation Market Size, By Material, 2013–2020 (USD Million)
Table 9 APAC: Liquid Encapsulation Market Size,By Material, 2013–2020 (USD Million)
Table 10 RoW: Liquid Encapsulation Materail Market Size,By Material, 2013–2020 (USD Million)
Table 11 Global Liquid Encapsulation Materail Market, By Product, 2013–2020 (USD Million)
Table 12 Global Liquid Encapsulation Materail Market for Integrated Circuits, By Region 2013–2020 (USD Million)
Table 13 Global Liquid Encapsulation Materail Market for Optoelectronics, By Region 2013–2020 (USD Million)
Table 14 Global liquid encapsulation material marketfor Discrete Semiconductors, By Region, 2013–2020 (USD Million)
Table 15 Global Liquid Encapsulation Materials Market Size for Sensors, By Region, 2013–2020 (USD Million)
Table 16 Global Liquid Encapsulation Materials Market Size, By Application, 2013–2020 (USD Million)
Table 17 Americas: Liquid Encapsulation Materials Market for Automotive Application, By Region, 2013–2020 (USD Million)
Table 18 North America: Liquid Encapsulation Market Forautomotive Application, 2013–2020 (USD Million)
Table 19 Europe: Liquid Encapsulation Materail Market for Automotive Application, By Country, 2013–2020 (USD Million)
Table 20 APAC: Liquid Encapsulation Materail Market for By Automotive Application, By Country, 2013–2020 (USD Million)
Table 21 RoW: Liquid Encapsulation Materail Market for Automotive Application, By Region, 2013–2020 (USD Million)
Table 22 Americas: Liquid Encapsulation Materail Market for Industrial Application, By Region, 2013–2020 (USD Million)
Table 23 North America: liquid encapsulation material market for Industrial Application, By Country, 2013–2020 (USD Million)
Table 24 Europe: Liquid Encapsulation Materail Market for Industrial Application, By Country, 2013–2020 (USD Million)
Table 25 APAC: Liquid Encapsulation Materail Market for Industrial Application, By Country, 2013–2020 (USD Million)
Table 26 RoW: Liquid Encapsulation Materail Market for Industrial Application, By Region, 2013–2020 (USD Million)
Table 27 Americas: Liquid Encapsulation Materail Market for Telecommunication Application, By Region, 2013–2020 (USD Million)
Table 28 North America: Liquid Encapsulation Materail Market for Telecommunication Application, By Country, 2013–2020 (USD Million)
Table 29 Europe: Liquid Encapsulation Materail Market for Telecommunication Application, By Country, 2013–2020 (USD Million)
Table 30 APAC: Liquid Encapsulation Materail Market for Telecommunication Application, By Country, 2013–2020 (USD Million)
Table 31 RoW: Liquid Encapsulation Materail Market for Telecommunication Application, By Region,2013–2020 (USD Million)
Table 32 Americas: Liquid Encapsulation Market for Electronics Application, By Region, 2013–2020 (USD Million)
Table 33 North America: Liquid Encapsulation Materail Market for Electronics Application, By Country, 2013–2020 (USD Million)
Table 34 Europe: Liquid Encapsulation Market for Electronics Application, By Country, 2013–2020 (USD Million)
Table 35 APAC: Liquid Encapsulation Materail Market for Electronics Application, By Country, 2013–2020 (USD Million)
Table 36 RoW: Liquid Encapsulation Materail Market for Electronics Application, By Region, 2013–2020 (USD Million)
Table 37 Country-Wise Ranking in Terms of Semiconductor Export Markets (2015)
Table 38 Semiconductor Manufacturing Equipment Export Markets (2015)
Table 39 Global Liquid Encapsulation Market Size, By Region, 2013–2020 (USD Million)
Table 40 Americas: Liquid Encapsulation Materail Market Size, By Region, 2013–2020 (USD Million)
Table 41 Americas: Liquid Encapsulation Materail Market Size, By Product, 2013–2020 (USD Million)
Table 42 Americas: Liquid Encapsulation Materail Market Size, By Application, 2013–2020 (USD Million)
Table 43 North America: Liquid Encapsulation Materail Market Size, By Country, 2013–2020 (USD Million)
Table 44 North America: Liquid Encapsulation Materail Market Size, By Application, 2013–2020 (USD Million)
Table 45 U.S.: Liquid Encapsulation Market Size, By Application, 2013–2020 (USD Million)
Table 46 Canada: Liquid Encapsulation Materail Market Size, By Application, 2013–2020 (USD Million)
Table 47 Rest of North America: Liquid Encapsulation Materail Market Size, By Application, 2013–2020 (USD Million)
Table 48 South America: Liquid Encapsulation Materail Market Size, By Application, 2013–2020 (USD Million)
Table 49 Europe: Liquid Encapsulation Market Size, By Country, 2013–2020 (USD Million)
Table 50 Europe: Liquid Encapsulation Materail Market Size, By Product, 2013–2020 (USD Million)
Table 51 Europe: Liquid Encapsulation Materail Market Size, By Application, 2013–2020 (USD Million)
Table 52 Germany: Liquid Encapsulation Materail Market Size, By Application, 2013–2020 (USD Million)
Table 53 U.K.: Liquid Encapsulation Market Size, By Application, 2013–2020 (USD Million)
Table 54 France: Liquid Encapsulation Materail Market Size, By Application, 2013–2020 (USD Million)
Table 55 Italy: Liquid Encapsulation Materail Market Size, By Application, 2013–2020 (USD Million)
Table 56 Rest of Europe: Liquid Encapsulation Materail Market Size, By Application, 2013–2020 (USD Million)
Table 57 APAC: Liquid Encapsulation Materail Market Size, By Country, 2013–2020 (USD Million)
Table 58 APAC: Liquid Encapsulation Market Size, By Product, 2013–2020 (USD Million)
Table 59 APAC: Liquid Encapsulation Materail Market Size, By Application, 2013–2020 (USD Million)
Table 60 Japan: Liquid Encapsulation Market Size, By Application, 2013–2020 (USD Million)
Table 61 China: Liquid Encapsulation Materail Market Size, By Application, 2013–2020 (USD Million)
Table 62 Taiwan: Liquid Encapsulation Materail Market Size, By Application, 2013–2020 (USD Million)
Table 63 South Korea: Liquid Encapsulation Materail Market Size, By Application, 2013–2020 (USD Million)
Table 64 Rest of APAC: Liquid Encapsulation Market Size, By Application, 2013–2020 (USD Million)
Table 65 RoW: Liquid Encapsulation Materail Market Size, By Region, 2013–2020 (USD Million)
Table 66 RoW: Liquid Encapsulation Materail Market Size, By Product, 2013–2020 (USD Million)
Table 67 RoW: Liquid Encapsulation Materail Market Size, By Application, 2013–2020 (USD Million)
Table 68 Middle East: Liquid Encapsulation Market Size, By Application, 2013–2020 (USD Million)
Table 69 Africa: Liquid Encapsulation Materail Market Size, By Application, 2013–2020 (USD Million)
Table 70 Revenue of Major Players, USD Million (2012–2014)
Table 71 Major Players in the Global Liquid Encapsulation Materail Market, 2014
Table 72 New Product Launches, 2011–2015
Table 73 Mergers and Acquisitions (2012–2015)
Table 74 Other Developments (2012–2013)
Table 75 Expansions (2011–2013)
Table 76 Joint Ventures (2014-2015)
List of Figures (103 Figures)
Figure 1 Markets Covered
Figure 2 Research Design
Figure 3 Bottom-Up Approach
Figure 4 Top-Down Approach
Figure 5 Breakdown of Primary Interviews: By Company Type, Designation, & Region
Figure 6 Market Breakdown and Data Triangulation
Figure 7 Flow of Report Writing
Figure 8 Assumptions of the Research Study
Figure 9 Global Liquid Encapsulation Materials Market Snapshot, USD Million (2015–2020)
Figure 10 Epoxy Resin Estimated to Hold the Major Market Share Till 2020 (USD Million)
Figure 11 Global Liquid Encapsulation Materail Market, By Application (USD Million)
Figure 12 Global Liquid Encapsulation Materail Market Snapshot, USD Million (2015–2020)
Figure 13 Attractive Opportunities in the Global Liquid Encapsulation Materail Market
Figure 14 Sensors Expected to Grow at the Highest Rate Among All Product Types Between 2015 and 2020
Figure 15 Electronics Application Likely to Dominate the Global Liquid Encapsulation Market Till 2020
Figure 16 APAC Accounted for ~68% of the Global Liquid Encapsulation Market, 2015
Figure 17 Taiwan Estimated to Account for Over A Share of One-Fourth in the Global Liquid Encapsulation Market, 2015
Figure 18 Epoxy Resin is Expected to Hold the Major Share of the Global Liquid Encapsulation Market Till 2020
Figure 19 Integrated Circuits is Expected to Dominate the Global Liquid Encapsulation Market in 2015
Figure 20 APAC Expected to Lead the Global Liquid Encapsulation Market By 2020
Figure 21 Global Liquid Encapsulation Market, By Product
Figure 22 Global Liquid Encapsulation Market, By Application
Figure 23 Increasng Adoption of Better Packaging Techniques is Driving the Growth of the Liquid Encapsulation Market
Figure 24 Surge in Semiconductor Materials Market is Expected to Drive the Growth in Liquid Encapsulation Market
Figure 25 Value Chain Analysis
Figure 26 New Product Development: the Major Strategy Adopted By Market Players
Figure 27 Key Mergers & Acquisitions Between 2012 and 2014
Figure 28 Global Liquid Encapsulation Market, By Material (2015–2020)
Figure 29 Epoxy Resin Expected to Hold the Major Share in the Global Liquid Encapsulation Market (2015–2020)
Figure 30 Epoxy-Modified Resin Expected to Grow at the Highest Rate Between 2015 and 2020
Figure 31 APAC Likely to Lead the Global Liquid Encapsulation Market By 2020
Figure 32 Integrated Circuits Holds the Largest Share of the Liquid Encapsulation Market, 2015
Figure 33 Integrated Circuits Expected to Dominate the Global Liquid Encapsulation Materail Market, By Product (2015–2020)
Figure 34 APAC Likely to Grow at the Highest Rate for Integrated Circuits in the Liquid Encapsulation Market (2015–2020)
Figure 35 APAC Estimated to Hold the Major Market Share for Optoelectronics in the Global Liquid Encapsulation Market (2015–2020)
Figure 36 APAC Likely to Hold the Major Share for Discrete Semiconductors in the Global Liquid Encapsulation Market (2015–2020)
Figure 37 Global Liquid Encapsulation Market, By Application (2015–2020)
Figure 38 Electronics Application Expected to Lead the Global Liquid Encapsulation Market Between 2015 and 2020 (USD Million)
Figure 39 North America Expected to Hold the Major Market Share for the Automotive Application, USD Million (2015–2020)
Figure 40 The U.S. Likely to Dominate the Automotive Application in North America, USD Million (2015–2020)
Figure 41 Germany Expected to Hold the Major Market Share for the Automotive Application in Europe, USD Million (2015–2020)
Figure 42 Japan Likely to Hold the Major Market Share for the Automotive Application in APAC, USD Million (2015–2020)
Figure 43 North America Expected to Lead the Industrial Application, USD Million (2013–2020)
Figure 44 The U.S. Likely to Account for ~96% of the Industrial Application in 2015, USD Million
Figure 45 The U.K. Expected to Lead the European Liquid Encapsulation Market for the Industrial Application (2015–2020)
Figure 46 Taiwan Expected to Hold the Major Market Share for the Industrial Application By 2020
Figure 47 North America Likely to Grow at the Highest Rate Between 2015 and 2020, USD Million
Figure 48 The U.S. Expected to Lead the Telecommunication Application Market By 2020, USD Million (2015–2020)
Figure 49 The U.K. Expected to Dominate the Market for Telecommunication Application (2013–2020)
Figure 50 Taiwan Expected to Hold the Major Market Share for the Telecommunication Application in APAC (2015–2020)
Figure 51 North America Expected to Hold the Major Market Share for the Electronics Application, USD Million (2015–2020)
Figure 52 U.S. Expected to Dominate the Electronics Application, USD Million (2015–2020)
Figure 53 U.K. Expected to Lead the Electronics Application in the European Liquid Encapsulation Market (USD Million)
Figure 54 Taiwan Expected to Lead the Electronics Application Market, USD Million (2015–2020)
Figure 55 Geographic Snapshot of Global Liquid Encapsulation Market (2015–2020)
Figure 56 APAC: an Attractive Destination for Global Liquid Encapsulation Market (2015–2020)
Figure 57 APAC Likely to Account for More Than 65% of the Global Liquid Encapsulation Market, 2015 (USD Million)
Figure 58 Americas Market Snapshot – North America is Likely to Lead the Liquid Encapsulation Market, 2015–2020 (USD Million)
Figure 59 North America Likely to Hold the Major Market Share in the Americas Till 2020 (USD Million)
Figure 60 Integrated Circuits Expected to Hold the Major Market Share of the Overall Product Market of Americas Till 2020 (USD Million)
Figure 61 Electronics Application Expected to Lead the Americas Market Till 2020 (USD Million)
Figure 62 U.S. Likely to Hold the Major Share in the North American Liquid Encapsulation Market, 2015 (USD Million)
Figure 63 Telecommunication Application Expected to Grow at the Highest Rate in the North American Liquid Encapsulation Market (2015–2020)
Figure 64 Electronics Application Expected to Hold the Major Share of the U.S. Market Till 2020 (USD Million)
Figure 65 Canada Market Snapshot – Application Segment, 2015 (USD Million)
Figure 66 European Market Snapshot – Germany Likely to Lead the Liquid Encapsulation Market, 2015–2020 (USD Million)
Figure 67 German Market Expected to Grow at the Highest Rate in the European Liquid Encapsulation Market (2015–2020)
Figure 68 Sensors Expected to Grow at the Highest Rate in the European Liquid Encapsulation Market, USD Million (2015–2020)
Figure 69 Automotive Application Expected to Hold the Major Market Share of the European Liquid Encapsulation Market Till 2020 (USD Million)
Figure 70 Automotive Application Expected to Lead the German Liquid Encapsulation Market Till 2020 (USD Million)
Figure 71 Industrial Application Expected to Hold the Major Market Share of the U.K. Market Till 2020 (USD Million)
Figure 72 Automotive Application Expected to Hold the Major Share in Italian Liquid Encapsulation Market, 2015 (USD Million)
Figure 73 APAC Market Snapshot – Taiwan Likely to Lead the Liquid Encapsulation Materials Market, 2015–2020 (USD Million)
Figure 74 Taiwan Expected to Hold the Major Share of the Liquid Encapsulation Materials Market of APAC, 2015–2020 (USD Million)
Figure 75 Integrated Circuits is Estimated to Hold the Major Market Share in Liquid Encapsulation Materials Market of APAC (USD Million)
Figure 76 Electronics Application Likely to Hold the Major Share of the Liquid Encapsulation Materials Market in APAC, 2013–2020 (USD Million)
Figure 77 Electronics Application Likely to Hold the Major Market Share in Japanese Liquid Encapsulation Materials Market (USD Million)
Figure 78 Telecommunication Application Expected to Grow at the Highest CAGR Between 2015 and 2020 (USD Million)
Figure 79 Electronics Application Estimated to Hold the Major Market Share Between 2015 and 2020 (USD Million)
Figure 80 Rest of the World Market Snapshot – Middle East Likely to Lead the Liquid Encapsulation Materials Market, 2013–2020 (USD Million)
Figure 81 Middle East Expected to Hold the Major Market Share Till 2020 (USD Million)
Figure 82 Electronics Application Estimated to Lead in the RoW Region, 2015 (USD Million)
Figure 83 Electronics Application Estimated to Hold the Major Market Share Till 2020 (USD Million)
Figure 84 Companies Adopted New Product Development as the Key Growth Strategy Between 2012 and 2015
Figure 85 Panasonic Corporation Registered Comparatively Higher Growth Rate Between 2012 and 2014
Figure 86 Market Evolution Framework—New Product Development Was the Major Strategy Adopted By Key Players
Figure 87 Battle for Market Ranking: New Product Developments and Mergers & Acquisitions—The Key Growth Strategies
Figure 88 Geographic Revenue Mix of the Major Market Players
Figure 89 Competitive Benchmarking of the Major Market Players (2012–2014): Panasonic Corporation Had A Comparatively Higher Growth Rate Owing to Its Diversified Product Portfolio in Liquid Encapsulation
Figure 90 Sumitomo Bakelite Co., Ltd.: Company Snapshot
Figure 91 Sumitomo Bakelite Co., Ltd.: SWOT Analysis
Figure 92 Shin-Etsu Chemical Co., Ltd: Company Snapshot
Figure 93 Shin-Etsu Chemical Co., Ltd: SWOT Analysis
Figure 94 Panasonic Corporation: Company Snapshot
Figure 95 Panasonic Corporation: SWOT Analysis
Figure 96 Kyocera Corporation: Company Snapshot
Figure 97 Kyocera Corporation: SWOT Analysis
Figure 98 Hitachi Chemical Co., Ltd.: Company Snapshot
Figure 99 Hitachi Chemical Co., Ltd.: SWOT Analysis
Figure 100 Henkel AG and Co. KGAA: Company Snapshot
Figure 101 Nagase & Co., Ltd.: Company Snapshot
Figure 102 Nitto Denko Corporation: Company Snapshot
Figure 103 BASF SE: Company Snapshot
p align="justify"> Moreover, the WSTS Fall 2014 Semiconductor Industry Forecast predicts the worldwide semiconductor industry sales to reach USD 345 Billion in 2015 and USD 355 Billion in 2016. Some of the major growth drivers for the semiconductor industry are the upsurge in the consumer electronics market, growing investments from public and private firms, strong research initiatives, growing market for integrated circuits, and advancements in the sensors market among others.
Electronics and semiconductor devices are made up of small components which need to be placed properly and accurately over the device; any misconnection or malfunctioning of these components can affect the functioning of the device. The liquid encapsulation technique plays a vital role in this. Threats such as misconnection of electronic components, managing complex structure without affecting the performance of device, and so on are handled efficiently with the help of liquid encapsulation materials.
The global liquid encapsulation market is projected to grow at a CAGR of 6.7% between 2015 and 2020, from an estimated value of USD 1,011.97 Million in 2015 to reach USD 1,397.46 Million by 2020. With regard to the various products considered for this market, integrated circuits are estimated to account for more than 75% of the total market till 2020. Similarly, electronics applications are considered to hold the major market share among all the applications till 2020.
The report on global liquid encapsulation materials also analyzes the value chain for the market. The global market has been segmented on the basis of material, product, application, and geography (Americas, Europe, APAC, and RoW). The report also evaluates various market trends and dynamics in the global market such as drivers, restraints, opportunities, and challenges.
This market research report profiles some of the key technological developments in the recent times. It also profiles some of the leading players in the market and analyzes their key strategies. The competitive landscape section of the report provides a clear insight into the market ranking analysis of the key players. The global liquid encapsulation materials market also analyzes the major strategies adopted by the players to expand their geographic presence and to consolidate their position in the market.
The major players in the global liquid encapsulation market are Shin-Etsu Chemical Co., Ltd. (Japan), Sumitomo Bakelite Co., Ltd. (Japan), Hitachi Chemical Co. Ltd. (Japan), Henkel AG and Co. KGaA (Germany), Kyocera Corporation (Japan), Nagase & Co., Ltd. (Japan), Nitto Denko Corporation (Japan), Panasonic Corporation (Japan), BASF Se (Germany), Sanyu Rec Co. Ltd. (Japan), Resin Technical Systems (U.K.), and Epic Resins (U.S.) among others.
Market, by Material: The global liquid encapsulation materials market has been segmented on the basis of material into epoxy resin, epoxy-modified resin, and others (catalysts, hardeners, and colorants).
Market, by Product: The global liquid encapsulation market has been segmented on the basis of product into integrated circuits, optoelectronics, discrete semiconductor, and sensors.
Market, by Application: The global liquid encapsulation market has been segmented on the basis of application into automotive, industrial, telecommunication, and electronics.
Market, by Geography: The report segments the global liquid encapsulation material market into four major geographic regions, namely, the Americas, Europe, APAC, and RoW. The Americas market for liquid encapsulation materials has been further segmented into North America (the U.S., Canada, and Rest of North America) and South America. Europe includes the U.K., Germany, France, Italy, and Rest of Europe; APAC includes China, Japan, Taiwan, South Korea, and Rest of APAC; and RoW includes the Middle East and Africa.


Growth opportunities and latent adjacency in Liquid Encapsulation Market