Managed Mobility Services Market by Function (Device Management, Application Management, Security Management, and Maintenance & Support), by Organization Size (SME and Enterprise), Industry Vertical, and Region - Global Forecast to 2021


[154 Pages Report] The Managed Mobility Services (MMS) market is expected to grow from USD 4.56 Billion in 2016 to USD 19.40 Billion by 2021, at a high Compound Annual Growth Rate (CAGR) of 33.6%.
The year 2015 has been considered as the base year while 2016 to 2021 is the forecast period for performing the market estimation and forecasting. The Managed Mobility Services market is in the introductory stage and is expected to exhibit expansive growth in the years to come. The market is expected to grow substantially due to the fast-paced adoption among Small and Medium Enterprises (SMEs). With the pervasive penetration of mobile devices globally, employees are encouraged to use these devices for personal and business work. This has fostered the companies to adopt mobility solutions. The market is undergoing technological advancements and is also experiencing significant adoption. Thus, it is expected to experience an exponential growth in the coming years. The market is broadly segmented by function, organization size, industry vertical, and region. The global Managed Mobility Services market is segmented across five main regions, namely, North America, Europe, Asia-Pacific (APAC), Middle East and Africa (MEA), and Latin America.
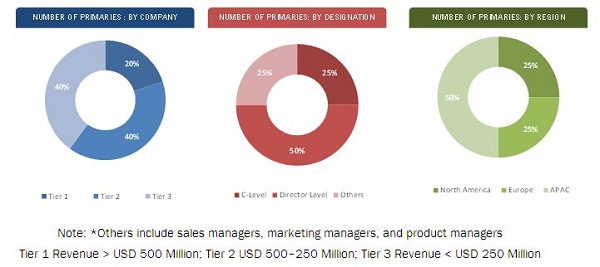
The research methodology used to estimate the market size includes the following details: the key players in the market were identified through secondary research and their market shares in respective regions were determined through primary and secondary research. This entire procedure includes the study of the annual and financial reports of the top market players and extensive interviews for key insights from industry leaders, such as CEOs, VPs, directors, and marketing executives. All percentage shares, splits, and breakdowns were determined by using secondary sources and verified through primary sources. Top-down and bottom-up approaches were used to estimate and validate the size of the global market and to estimate the size of various other dependent submarkets in the overall Managed Mobility Services market. All possible parameters that affect the markets covered in this research study have been accounted for, viewed in extensive detail, verified through primary research, and analyzed to get the final quantitative and qualitative data. This data is consolidated and added with detailed inputs and analysis from MarketsandMarkets and presented in this report.
To know about the assumptions considered for the study, download the pdf brochure
The MMS ecosystem comprises supply side, intermediates, and demand side. The supply side vendors include MMS service providers, MMS platform providers, Cloud Service Providers (CSP), Telecom Network Operator (TNO), and device manufacturers. The top vendors include AT&T, Fujitsu, IBM Corporation, Wipro, Orange Business Services, Telef�nica, Deutsche Telekom AG, Hewlett-Packard, Vodafone, and Accenture, among others. The intermediate includes system integrators and value-added service providers and distributors. The system integrators are responsible for the integration of MMS resources and cloud resources. The demand side includes the end users of MMS, such as Retail, IT & telecom, public sector, manufacturing, healthcare, education, and others.
Key Target Audience for Managed Mobility Services Market
- MMS Service Providers
- MMS Platform Providers
- CSPs
- TNOs
- Device Manufacturers
- Open-Source Platform Providers
- System Integrators
- External Service Providers (ESPs)
- Telecom Expense Management (TEM) Providers
Scope of the Managed Mobility Services Market Report
|
Report Metrics |
Details |
|
Market size available for years |
2016�2021 |
|
Base year considered |
2015 |
|
Forecast period |
2016�2021 |
|
Forecast units |
Billion (USD) |
|
Segments covered |
Function, Organization Size, Industry Vertical and Region |
|
Geographies covered |
North America, Europe, MEA, APAC and Latin America |
|
Companies covered |
AT&T, Fujitsu, IBM Corporation, Wipro, Orange Business Services, Telef�nica, Deutsche Telekom AG, Hewlett-Packard, Vodafone, and Accenture. |
The Managed Mobility Services market report is broadly segmented into the following.
Global Managed Mobility Services Market, by Function
- Device Management
- Application Management
- Security Management
- Support and Maintenance
Market by Organization Size
- SMEs
- Large Enterprises
Market by Industry Vertical
- Healthcare
- Manufacturing
- Logistics and Transportation
- Retail
- Financial Services
- Telecom and IT
- Media and Entertainment
- Travel and Hospitality
- Public Sector
- Education
- Others
Global Managed Mobility Services Market, by Region
- North America
- Europe
- APAC
- MEA
- Latin America
Available Customizations:
With the given market data, MarketsandMarkets offers customizations as per the company�s specific needs. The following customization options are available for the report:
Product Analysis
- Product Matrix which gives a detailed comparison of the product portfolio of each company
Geographic Analysis
- Further breakdown of the regions according to the feasibility
Company Information
- Detailed analysis and profiling of additional market players (Up to 5)
The Managed Mobility Services (MMS) market is estimated to grow from USD 4.56 Billion in 2016 to USD 19.40 Billion by 2021, at a high Compound Annual Growth Rate (CAGR) of 33.6% during the forecast period. Emergence of various mobile apps to enable mobility among businesses has increased the usage of mobile devices among companies. This increased usage has further developed the need for Telecom Expense Management (TEM) among businesses as well as to manage enterprise mobility at a cost-effective manner. Consequently, various Managed Service Providers (MSPs) are leveraging this gap between demand and supply and have initiated delivering MMS solutions to businesses seeking cost-efficient bundled mobility solutions. There has been an increased BYOD trend due to the wide adoption of mobile devices and growing internet consumption across the globe. In addition, companies demand various solutions that can enhance business productivity by providing real-time employee collaboration and business information access to the workers to perform diverse office work regardless of employee location. This in turn creates increased need for MMS.
This report provides detailed insights into the global Managed Mobility Services market, which is segmented based on function types, organization size, industry verticals, and regions. The device management function type contributes the highest market share, whereas the application management segment is expected to register a significant growth rate.
The Managed Mobility Services market by device management includes device and system management, sourcing and logistics management, and mobile service management. The widespread embracement of mobile devices among businesses and the emergence of certain regulations such as HIPAA for healthcare to maintain privacy of consumer�s sensitive information have encouraged the adoption of MMS solutions that are compliant with these specific regulations. The usage of MMS enables organizations to proficiently manage enterprise mobility along with maintaining organizational information security.
The adoption of MMS solutions is expansive among Small and Medium Enterprises (SMEs) as the implementation of these services does not demand expansion of IT resources since the services are managed comprehensively by MSPs. Moreover, North America in general and the U.S. and Canada in particular are rapidly adopting MMS solutions due to the substantial penetration of mobile devices among organizations in these regions for seamless connectivity among employees and for providing agile services to the customers. In addition, the mandatory compliance with certain industry-specific regulations, such as HIPAA for healthcare and PCI DSS for financial services vertical, further encourage the adoption of MMS solutions across these verticals. The Managed Mobility Services market is booming, and it is expected that within the next five years, the adoption rate will increase leading to the high growth of this market. The report provides detailed insights into the global MSS market. The market has been segmented into many industry verticals, namely, financial services, IT & telecom, public sector, healthcare, and others. The healthcare sector shows great opportunities and contributes the maximum market share in 2016, whereas the retail sector accounts for highest CAGR.
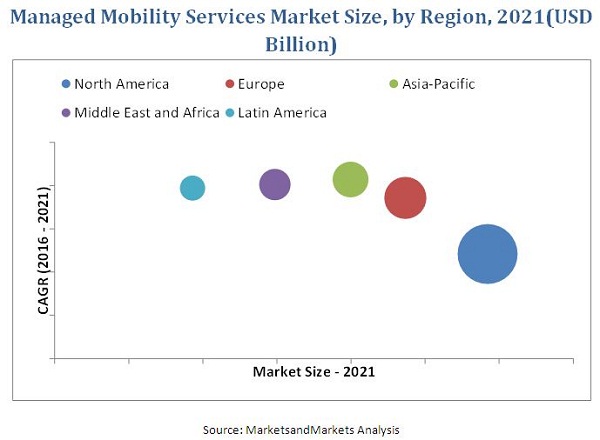
The report covers all the major aspects of the Managed Mobility Services market and provides an in-depth analysis on the basis of regions. For geographic analysis, the market has been segmented into North America, Europe, Asia-Pacific (APAC), Middle East and Africa (MEA), and Latin America. North America is expected to hold the largest market share. The APAC region is projected to have great opportunities in this market and would grow at the highest CAGR by 2021 due to the presence of various developing countries, such as China, India, Philippines, and others.
However, MMS faces some challenges such as the lack of awareness among businesses and lower cost-visibility in the adoption of MMS thereby inhibiting its implementation across various businesses.
Major MMS vendors such as AT&T, Fujitsu, IBM Corporation, Wipro, Orange Business Services, Telef�nica, Deutsche Telekom AG, Hewlett-Packard, Vodafone, and Accenture offer advanced MMS solutions pertaining to the needs of enterprises as well as SMEs. These vendors have adopted different types of organic and inorganic growth strategies, such as new product launches, partnerships & collaborations, and mergers & acquisitions, to expand their offerings in the Managed Mobility Services market.
To speak to our analyst for a discussion on the above findings, click Speak to Analyst
 Exclusive indicates content/data unique to MarketsandMarkets and not available with any competitors.
Table of Contents
1 Introduction (Page No. - 14)
1.1 Objectives of the Study
1.2 Market Definition
1.3 Market Scope
1.3.1 Markets Covered
1.3.2 Years Considered for Study
1.4 Currency
1.5 Limitations
1.6 Stakeholders
2 Research Methodology (Page No. - 18)
2.1 Introduction
2.2 Market Size Estimation
2.3 Market Breakdown and Data Triangulation
2.4 Market Size Estimation
2.4.1 Key Data From Secondary Sources
2.4.2 Key Data From Primary Sources
2.5 Key Industry Insights
2.6 Assumptions
3 Executive Summary (Page No. - 27)
4 Premium Insights (Page No. - 33)
4.1 Attractive Market Opportunities in the Market
4.2 Managed Mobility Services Market: By Function
4.3 Global Maanged Mobility Services Market: By Vertical and By Region
4.4 Life Cycle Analysis, By Region (2016)
5 Market Overview (Page No. - 36)
5.1 Introduction
5.2 Evolution
5.3 Market Segmentation
5.3.1 By Function
5.3.2 By Organization Size
5.3.3 Global Managed Mobility Services Market Segmentation: By Organization Size
5.3.4 By Industry Vertical
5.3.5 By Region
5.4 Market Dynamics
5.4.1 Drivers
5.4.1.1 IT Dependency on New Technologies
5.4.1.2 Increasing Adoption of Mobile Technology
5.4.1.3 Accelerating Byod Policies in Organizations
5.4.1.4 Outsourcing Non-Core Business Activities
5.4.2 Restraints
5.4.2.1 Open-Source Platform Penetration in Small and Medium Enterprises
5.4.2.2 Lack of Cost Visibility and Control
5.4.3 Opportunities
5.4.3.1 Need for Reliability Using Cloud-Based Mms Solution
5.4.3.2 Identity and Access Management Provides Roadmap to Managed Mobility Services
5.4.4 Challenges
5.4.4.1 Complex Mms Technology
5.4.4.2 Constrained Adoption Among Enterprises
6 Industry Trends (Page No. - 48)
6.1 Introduction
6.2 Value Chain Analysis
6.3 Strategic Benchmarking
6.4 Pest Analysis
6.4.1 Political Factors
6.4.2 Economic Factors
6.4.3 Social Factors
6.4.4 Technological Factors
7 Managed Mobility Services Market Analysis, By Function (Page No. - 53)
7.1 Introduction
7.2 Device Management
7.2.1 Device and System Management
7.2.2 Sourcing and Logistics Management
7.2.3 Mobile Service Management
7.3 Application Management
7.3.1 Application and Collaboration Management
7.3.2 Program and Financial Management
7.4 Security Management
7.4.1 Security Mangement
7.4.2 Content Management
7.5 Support and Maintenance
8 Managed Mobility Services Market Analysis, By Organization Size (Page No. - 65)
8.1 Introduction
8.2 Small and Medium Enterprises
8.3 Large Enterprises
9 Managed Mobility Services Market, By Vertical (Page No. - 69)
9.1 Introduction
9.2 Healthcare
9.3 Manufacturing
9.4 Logistics and Transportation
9.5 Retail
9.6 Financial Services
9.7 Telecom and IT
9.8 Media and Entertainment
9.9 Travel and Hospitality
9.10 Public Sector
9.11 Education
9.12 Others
10 Geographic Analysis (Page No. - 81)
10.1 Introduction
10.2 North America
10.3 Europe
10.4 Asia-Pacific (APAC)
10.5 Middle East and Africa
10.6 Latin America
11 Competitive Landscape (Page No. - 102)
11.1 Overview
11.2 Competitive Situation and Trends
11.2.1 Partnerships, Agreements, and Collaborations
11.2.2 Mergers and Acquisitions
11.2.3 New Solution and Service Launches/Enhancements
12 Company Profiles (Page No. - 111)
(Overview, Products & Services, Strategies & Insights, Developments and Mnm View)*
12.1 Introduction
12.2 AT&T, Inc.
12.3 Fujitsu Ltd.
12.4 IBM Corporation
12.5 Wipro Ltd.
12.6 Orange S.A.
12.7 Telef�nica S.A.
12.8 Deutsche Telekom AG
12.9 Hewlett-Packard
12.10 Vodafone Group PLC.
12.11 Accenture PLC.
*Details on Overview, Products & Services, Strategies & Insights, Developments and Mnm View Might Not Be Captured in Case of Unlisted Companies.
13 Appendix (Page No. - 146)
13.1 Insight of Industry Experts
13.2 Discussion Guide
13.3 Introducing RT: Real-Time Market Intelligence
13.4 Knowledge Store: Marketsandmarkets� Subscription Portal
13.5 Available Customizations
13.6 Related Reports
List of Tables (68 Tables)
Table 1 Managed Mobility Services Market Size, 2014�2021 (USD Million)
Table 2 Market Size, By Organization Size, 2014�2021 (USD Million)
Table 3 Market Size, By Vertical, 2014�2021 (USD Million)
Table 4 Rising Consumerization of It is Propelling the Growth of the Global Market
Table 5 Increasing Usage of Open-Source Platform is Restraining the Market Growth
Table 6 Reliability in Cloud-Based Mms Solutions Among Businesses are Paving the Enhanced Growth Avenues for Mms Vendors
Table 7 Complex Technologies in Mms are the Key Challenges of the Market Growth
Table 8 Managed Mobility Services Market Size, By Function, 2014�2021 (USD Million)
Table 9 Device Management: Market Size, By Region, 2014�2021 (USD Million)
Table 10 Device and System Management: Market Size, By Region, 2014�2021 (USD Million)
Table 11 Sourcing and Logistics Management: Market Size, By Region, 2014�2021 (USD Million)
Table 12 Mobile Service Management: Market Size, By Region, 2014�2021 (USD Million)
Table 13 Application Management: Market Size, By Region, 2014�2021 (USD Million)
Table 14 Application and Collaboration Management: Market Size, By Region, 2014�2021 (USD Million)
Table 15 Program and Financial Management: Market Size, By Region, 2014�2021 (USD Million)
Table 16 Security Management: Market Size, By Region, 2014�2021 (USD Million)
Table 17 Security Management: Market Size, By Region, 2014�2021 (USD Million)
Table 18 Content Management: Market Size, By Region, 2014�2021 (USD Million)
Table 19 Support and Maintenance: Market Size, By Region, 2014�2021 (USD Million)
Table 20 Managed Mobility Services Market Size, By Organization Size, 2014�2021 (USD Million)
Table 21 Small and Medium Enterprises: Market Size, By Region, 2014�2021 (USD Million)
Table 22 Large Enterprises: Market Size, By Region, 2014�2021 (USD Million)
Table 23 Market, By Vertical, 2014�2021 (USD Million)
Table 24 Healthcare: Market Size, By Region, 2014�2021 (USD Million)
Table 25 Manufacturing: Market Size, By Region, 2014�2021 (USD Million)
Table 26 Logistics and Transportation: Market Size, By Region, 2014�2021 (USD Million)
Table 27 Retail: Managed Mobility Services Market Size, By Region, 2014�2021 (USD Million)
Table 28 Financial Services: Market Size, By Region, 2014�2021 (USD Million)
Table 29 Telecom and IT: Market Size, By Region, 2014�2021 (USD Million)
Table 30 Media and Entertainment: Market Size, By Region, 2014�2021 (USD Million)
Table 31 Travel and Hospitality: Managed Mobility Services Market Size, By Region, 2014�2021 (USD Million)
Table 32 Public Sector: Market Size, By Region, 2014�2021 (USD Million)
Table 33 Education: Market Size, By Region, 2014�2021 (USD Million)
Table 34 Others: Market Size, By Region, 2014�2021 (USD Million)
Table 35 Managed Mobility Services Market Size, By Region, 2014�2021 (USD Million)
Table 36 North America: Market Size, By Function, 2014�2021 (USD Million)
Table 37 North America: Market Size, By Device Management, 2014�2021 (USD Million)
Table 38 North America: Market Size, By Application Management, 2014�2021 (USD Million)
Table 39 North America: Market Size, By Security Management, 2014�2021 (USD Million)
Table 40 North America: Market Size, By Organization Size, 2014�2021 (USD Million)
Table 41 North America: Market Size, By Industry Vertical, 2014�2021 (USD Million)
Table 42 Europe: Managed Mobility Services Market Size, By Function, 2014�2021 (USD Million)
Table 43 Europe: Market Size, By Device Management, 2014�2021 (USD Million)
Table 44 Europe: Market Size, By Application Management, 2014�2021 (USD Million)
Table 45 Europe: Market Size, By Security Management, 2014�2021 (USD Million)
Table 46 Europe: Market Size, By Organization Size, 2014�2021 (USD Million)
Table 47 Europe: Market Size, By Industry Vertical, 2014�2021 (USD Million)
Table 48 Asia-Pacific: Market Size, By Function, 2014�2021 (USD Million)
Table 49 Asia-Pacific: Market Size, By Device Management, 2014�2021 (USD Million)
Table 50 Asia-Pacific: Market Size, By Application Management, 2014�2021 (USD Million)
Table 51 Asia-Pacific: Market Size, By Security Management, 2014�2021 (USD Million)
Table 52 Asia-Pacific: Market Size, By Organization Size, 2014�2021 (USD Million)
Table 53 Asia-Pacific: Market Size, By Industry Vertical, 2014�2021 (USD Million)
Table 54 Middle East and Africa: Market Size, By Function, 2014�2021 (USD Million)
Table 55 Middle East and Africa: Market Size, By Device Management, 2014�2021 (USD Million)
Table 56 Middle East and Africa: Market Size, By Application Management, 2014�2021 (USD Million)
Table 57 Middle East and Africa: Market Size, By Security Management, 2014�2021 (USD Million)
Table 58 Middle East and Africa: Market Size, By Organization Size, 2014�2021 (USD Million)
Table 59 Middle East and Africa: Market Size, By Industry Vertical, 2014�2021 (USD Million)
Table 60 Latin America: Market Size, By Function, 2014�2021 (USD Million)
Table 61 Latin America: Market Size, By Device Management, 2014�2021 (USD Million)
Table 62 Latin America: Market Size, By Application Management, 2014�2021 (USD Million)
Table 63 Latin America: Market Size, By Security Management, 2014�2021 (USD Million)
Table 64 Latin America: Market Size, By Organization Size, 2014�2021 (USD Million)
Table 65 Latin America: Managed Mobility Services Market Size, By Industry Vertical, 2014�2021 (USD Million)
Table 66 Partnerships, Collaborations, and Agreements, 2014 � 2016
Table 67 Mergers and Acquisitions, 2014�2016
Table 68 New Product Launches/Enhancements, 2014�2016
List of Figures (50 Figures)
Figure 1 Managed Mobility Services Market Segmentation
Figure 2 Market: Research Design
Figure 3 Market Size Estimation Methodology: Bottom-Up Approach
Figure 4 Market Size Estimation Methodology: Top-Down Approach
Figure 5 Breakdown of Primary Interview: By Company Type, Designation, and Region
Figure 6 Data Triangulation
Figure 7 Managed Mobility Services (By Function) Snapshot, 2016 vs 2021
Figure 8 Managed Mbility Services (By Organization Size) Snapshot, 2016 vs 2021
Figure 9 Managed Mobility Services (By Vertical) Snapshot, 2016 vs 2021
Figure 10 North America has the Largest Share in the Global Market, 2016
Figure 11 Partnerships, Agreements and Collaborations are Expected to Be the Differentiating Trend for the Top Companies
Figure 12 Increasing Adoption of Mobile Technology and Accelerating Byod Policiy is Pushing the Market
Figure 13 Device Management Contributes the Largest Market Share in the Managed Mobility Services Market
Figure 14 Healthcare By Vertical and North America By Region Accounted for the Largest Shares in the Market
Figure 15 North America is the Leading Market in the Market
Figure 16 Enterprise-Focused Applications and Identity and Access Management to Play A Crucial Role in the Global Managed Mobility Services Market
Figure 17 Global Market Segmentation: By Function
Figure 18 Global Market Segmentation: By Industry Vertical
Figure 19 Global Market Segmentation: By Region
Figure 20 IT Dependency in New Technologies is Expected to Drive the Market
Figure 21 Value Chain Analysis: Major Role Played By Telecom Network Operators
Figure 22 Strategic Benchmarking: Managed Mobility Services Market
Figure 23 Partnerships, Agreements, and Collaborations Was as the Key Growth Strategy of the Last Three Years
Figure 24 Security Management Services is Expected to Gain the Highest Traction in Global Market (2016�2021)
Figure 25 SMES is Expected to Grow at A Higher Rate During the Forecast Period (2016�2021)
Figure 26 Financial Services is Expected to Witness the Highest Market Share in the Managed Mobility Services Market (2016�2021)
Figure 27 Geographic Snapshot (2016 vs 2021)
Figure 28 The Market in Asia-Pacific is Expected to Grow at the Highest Rate From 2016 to 2021
Figure 29 Regional Snapshot: Asia-Pacific as the Hotspot During 2016�2021
Figure 30 North America: Market Snapshot
Figure 31 Asia-Pacific: Market Snapshot
Figure 32 Partnerships, Agreements, and Collaborations Were the Key Growth Strategy Over the Last Three Years
Figure 33 Market Evaluation Framework
Figure 34 Battle for Market Share: Market Players Adopted Partnerships, Agreements, and Collaborations as the Key Strategy
Figure 35 Geographic Revenue Mix of Top 5 Market Players
Figure 36 AT&T, Inc.: Company Snapshot
Figure 37 AT&T, Inc.: SWOT Analysis
Figure 38 Fujitsu Ltd.: Company Snapshot
Figure 39 Fujitsu Ltd.: SWOT Analysis
Figure 40 IBM Corporation: Company Snapshot
Figure 41 IBM Corporation: SWOT Analysis
Figure 42 Wipro Ltd.: Company Snapshot
Figure 43 Wipro Ltd.: SWOT Analysis
Figure 44 Orange S.A.: Company Snapshot
Figure 45 Orange S.A.: SWOT Analysis
Figure 46 Telef�nica S.A.: Company Snapshot
Figure 47 Deutsche Telekom AG: Company Snapshot
Figure 48 Hewlett-Packard: Company Snapshot
Figure 49 Vodafone Group PLC.: Company Snapshot
Figure 50 Accenture PLC.: Company Snapshot


Growth opportunities and latent adjacency in Managed Mobility Services Market