Metal Coatings Market by Type (Polyester, Plastisol, Siliconized Polyster, Fluropolymer, Polyurethane), Process (Coil, Extrusion, Hot Dip Galvanizing), Technology (Liquid, Powder), End Use Industry, and Region - Global Forecast to 2026


The global metal coatings market is estimated to be valued at USD 10.52 Billion in 2016 and is projected to reach USD 14.34 Billion by 2026, at a CAGR of 6.1% from 2016 to 2026. In this study, 2015 has been considered the base year to estimate the market size. The report provides the short term forecast from 2016 to 2021, and the long term forecast from 2016 to 2026. This report aims to estimate the market size and future growth potential of the global metal coatings market across different segments such as type, technology, process application, and region. Factors influencing market growth such as drivers, restraints, opportunities, and industry-specific challenges have been studied in the report. The report analyzes the opportunities in the market for stakeholders and presents the competitive landscape for the market leaders.
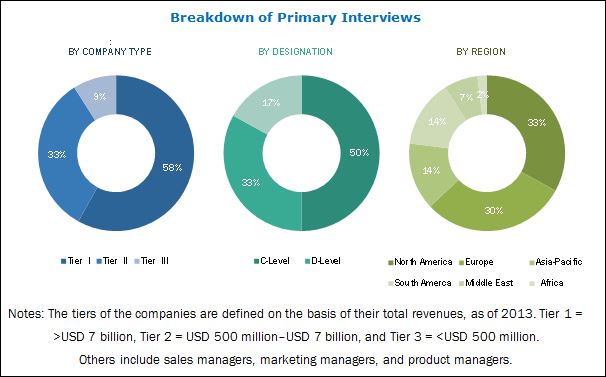
The top-down and bottom-up approaches have been used to estimate and validate the size of the global metal coatings market and estimate the sizes of various other dependent submarkets. The research study involved the use of extensive secondary sources, directories and databases such as Hoovers, Bloomberg, Chemical Weekly, Factiva, and other government associations. Private & company websites have also been used to identify and collect information useful for the technical, market-oriented, and commercial study of the global metal coatings market. After arriving at the total market size, the overall market has been split into several segments and subsegments. The figure given below provides a breakdown of the primaries conducted during the research study, on the basis of company type, designation, and region.
To know about the assumptions considered for the study, download the pdf brochure
The value chain for metal coatings begins with raw material manufacturers of environment-friendly as well as petroleum-based chemicals. These raw materials are procured by resin manufacturers and petrochemical companies. They manufacture different types of basic chemicals, additives, and pigments, which are then sold to metal coatings manufacturers. The resin is then procured by resin manufacturers, who sell their products to, coatings and composites manufacturers. The converted product manufacturers then market their products to molders and end-user companies after receiving the regulatory approvals. The maximum value is added at the manufacturing stage, as the basic chemicals are mixed and processed with other chemicals to achieve the desired coatings for specific applications.
Key metal coatings manufacturers are E.I. du Pont de Nemours and Company (U.S.), PPG Industries (U.S.), Axalta Coating Systems. (U.S.), AkzoNobel N.V. (Netherland), Nippon Paint Holdings Co., Ltd. (Japan), Henkel AG & Co., KGaA (Germany), The Sherwin-Williams Company (U.S.), The Valspar Corporation (U.S.), BASF SE (Germany), Kansai Paint Co., Ltd.(Japan), Wacker Chemie AG (Germany), and The Becker Group, Ltd. (US). The value chain includes the manufacture of metal coatings and the delivery of products to the end-users such as manufacturers of paints & coatings.
Key Target Audience:
- Metal coatings manufacturers
- Raw material suppliers
- Traders, distributors, and suppliers of metal coatings
- Government and regional agencies and research organizations
- Investment research firms
Scope of the report:
This research report categorizes the global metal coatings market on the basis of type, process, technology, end-use industry, and region.
On the basis of Resin Type:
- Polyester
- Plastisol
- Siliconized Polyster
- Fluoropolymer
- Polyurethane
- Others
On the basis of Process:
- Coil Coating
- Extrusion Coating
- Hot-Dip Galvanizing
On the basis of Technology:
- Liquid Coating
- Powder Coating
On the basis of End-Use Industry:
- Building & Construction
- Automotive & Transportation
- Consumer Goods & Appliances
- Marine and Protective Coatings
- Others
On the basis of Region:
- Asia-Pacific
- Europe
- North-America
- Middle East
- South America
- Africa
The market is further analyzed for the key countries in each of these regions.
Available Customizations:
With the given market data, MarketsandMarkets offers customizations according to the company�s specific needs. The following customization options are available for the report:
Regional Analysis:
- Country-level analysis of the global metal coatings market by application.
Company Information:
- Detailed analysis and profiles of additional market players.
The global metal coatings market is projected to reach USD 14.34 Billion by 2026, at a CAGR of 6.1% from 2016 to 2026. Metal coatings are used by various end-users such as building & construction, automotive & transportation, consumer goods & appliances, marine and protective coatings industries. Metal coatings are used in order to add specific surface properties, such as corrosion or oxidation resistance, color, attractive appearance, wear resistance, optical properties, electrical resistance, or thermal protection.
The market for the building & construction end-use industry was the largest in terms of volume in 2015. As metal coatings are widely used for protective coatings due to the superior properties, such as high adhesion, corrosion or oxidation resistance, color, wear resistance, optical properties. The coil coating process accounted for the largest market share in 2015. The global coil coating industry is witnessing high growth because of its increasing applications, and technological advancements. The liquid coating technology accounted for the largest market share in 2015 in terms of volume and value. Liquid coatings include a variety of custom formulations, ranging from solvent-based to high-solid/low-bake, waterborne finishes, and UV-curable technology, all designed to increase applied cost efficiency and help manufacturers to achieve better quality. Polyester resin type accounted for the largest market share in 2015 in terms of volume. Polyester resin based metal coatings have uniform properties, such as good bendability, hardness, gloss, and resistance to UV, chemicals, scratching, and light.
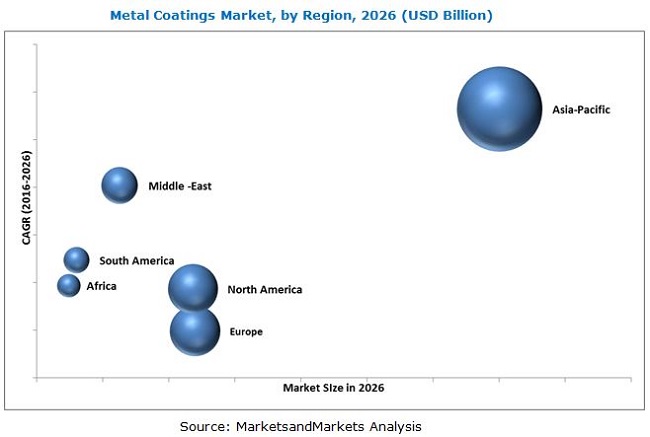
The Asia-Pacific region is expected to grow at the highest rate in the global metal coatings market, in terms of value and volume, from 2016 to 2021. The increasing demand from emerging economies, such as China and India, and the increased mega construction projects and the sales of high-end vehicles and consumer goods & appliances are expected to drive the growth of the Asia-Pacific metal coatings market.
Currently, China is the world�s largest consumer of metal coatings in terms of volume. Growth of the metal coatings market in China is driven by foreign investments, cost-effective labor, and the availability of inexpensive raw materials. The consumer goods & appliances industry is the largest industry in the country with double-digit growth, annually.
Though the metal coatings market is gaining importance, a few factors act as restraints to its growth in the global market. The volatility in raw material prices and restrictions on the use of hazardous chemicals, composite materials replacing painted aluminum and steel sheets in the building & construction industry, restricts the metal coatings market for the building & construction industry.
Companies such E.I. du Pont de Nemours and Company (U.S.), PPG Industries (U.S.), Axalta Coating Systems. (U.S.), AkzoNobel N.V. (Netherland), Nippon Paint Holdings Co., Ltd. (Japan), Henkel AG & Co., KGaA (Germany), The Sherwin-Williams Company (U.S.), The Valspar Corporation (U.S.), BASF SE (Germany), Kansai Paint Co., Ltd.(Japan), Wacker Chemie AG (Germany), The Becker Group, Ltd. (US), are the key players in the global metal coatings market.
To speak to our analyst for a discussion on the above findings, click Speak to Analyst
 Exclusive indicates content/data unique to MarketsandMarkets and not available with any competitors.
Table of Contents
1 Introduction
1.1 Objectives of the Study
1.2 Market Definition
1.3 Scope of the Study
1.3.1 Markets Covered
1.3.2 Years Considered in the Report
1.4 Currency & Pricing
1.5 Package Size
1.6 Limitations
1.7 Stake Holders
2 Research Methodology
2.1 Research Data
2.1.1 Metal Coatings Market: Research Data
2.1.2 Breakdown of Primary Interviews
2.1.3 Key Industry Insights
2.1.4 Market Size Estimation: Top-Down Approach
2.1.5 Market Size Estimation: Bottom-Up Approach
2.1.6 Key Data From Primary Sources
2.1.7 Data Triangulation
2.1.8 Assumption
3 Executive Summary
3.1 Key Findings
4 Premium Insights
4.1 Opportunities in the Metal Coatings Market
4.2 Coil Coating Process Estimated to Register Highest CAGR (2016-2021)
4.3 Surge in Demand for Metal Coating Products in Developing Countries Presents Opportunities
4.4 Metal Coatings Market, Developing vs Developed Countries
5 Market Overview
5.1 Introduction
5.2 Market Segmentation
5.3 Market Dynamics
5.3.1 Drivers
5.3.1.1 Growing Building & Construction, Automotive, and Appliances Industries
5.3.1.2 High Demand for Metal Coatings From the Asia-Pacific Region
5.3.1.3 Demand for Fluoropolymer Resin Type Continues to Grow in the Building & Construction Market
5.3.2 Restraints
5.3.2.1 Volatility in Raw Material Prices
5.3.2.2 Composite Material Replacing Painted Aluminum, Steel Sheets in the Building & Construction Industry
5.3.3 Opportunities
5.3.3.1 Opportunities for Steel and Aluminum Protected Skyscrapers in the Middle-East Countries
5.3.3.2 Major European Players are Shifting in Emerging Countries Such as India & Saudi Arabia
5.3.3.3 Growing Automotive Market in Asia-Pacific and in the Middle-East
5.3.4 Challenges
5.3.4.1 Stringent and Time-Consuming Regulatory Policies
5.3.4.2 Major Hurdle for New Entrants in the Coil Coatings Market
6 Industry Trends
6.1 Value Chain Analysis
6.2 Porter�s Five Forces Analysis
7 Patent Details
7.1 Introduction
7.2 Patent Details
8 Metal Coatings Market, By Technology
8.1 Introduction
8.2 Market Size & Projection
8.2.1 Liquid Coating
8.2.1.1 Water-Based
8.2.1.2 Solvent-Based
8.2.2 Powder Coating
9 Metal Coatings Market, By Process
9.1 Introduction
9.2 Market Size & Projection
9.2.1 Coil Coatings
9.2.2 Extrusion Coatings
9.2.3 Hot Dip Galvanized
10 Metal Coatings Market, By Resin Type
10.1 Introduction
10.2 Market Size & Projection
10.2.1 Polyester
10.2.2 Plastisol
10.2.3 Siliconized Polyester
10.2.4 Fluropolymer
10.2.5 Polyurethane
10.2.6 Others (Acrylic & Epoxy)
11 Metal Coatings Market, By End-Use Industry
11.1 Introduction
11.1.1 Building & Construction
11.1.1.1 Interior
11.1.1.1.1 HVAC
11.1.1.1.2 Trim
11.1.1.1.3 Ceiling Grids
11.1.1.1.4 Blinds
11.1.1.1.5 Purlins
11.1.1.1.6 Railing
11.1.1.2 Exterior
11.1.1.2.1 Roof & Wall Panels
11.1.1.2.2 Doors
11.1.1.2.3 Panels
11.1.1.2.4 Windows
11.1.1.2.5 Soffit
11.1.1.2.6 Curtain Walls
11.1.2 Automotive & Transportation
11.1.2.1 Interior
11.1.2.1.1 Trim
11.1.2.1.2 Hitches
11.1.2.1.3 Blinds
11.1.2.1.4 Panels
11.1.2.1.5 Oil Filters
11.1.2.2 Exterior
11.1.2.2.1 Wheel Trim
11.1.2.2.2 Door Handle
11.1.2.2.3 Windshield Wipers
11.1.2.2.4 Roof Racks
11.1.2.2.5 Bumper
11.1.3 Consumer Goods & Appliances
11.1.3.1 Washing Machines
11.1.3.2 Refrigerators
11.1.3.3 Microwave Ovens
11.1.3.4 Air Conditioners
11.1.3.5 Fans
11.1.3.6 Cookers
11.1.4 Marine and Protective Coatings
11.1.4.1 Marine
11.1.4.1.1 Tanks
11.1.4.1.2 Barges
11.1.4.1.3 Hulls
11.1.4.1.4 Engine Rooms
11.1.4.1.5 Sbm
11.1.4.2 Oil & Gas
11.1.4.2.1 Pipeline
11.1.4.2.2 Tubing
11.1.4.2.3 Turbine
11.1.4.2.4 Chimneys
11.1.5 Others
11.1.5.1 Wind Industry
11.1.5.1.1 Turbine
11.1.5.1.2 Blades
11.1.5.2 Solar Industry
11.1.5.2.1 Panels
11.1.5.2.2 Mirror
11.1.5.3 Packaging
11.1.5.3.1 Food
11.1.5.3.2 Beverages
11.1.5.3.3 Line Cans
12 Metal Coatings Market, By Region
12.1 Introduction
12.2 Asia-Pacific
12.2.1 China
12.2.2 India
12.2.3 Japan
12.2.4 South Korea
12.2.5 Thailand
12.2.6 Indonesia
12.2.7 Vietnam
12.2.8 Rest of Asia-Pacific Countries
12.3 North America
12.3.1 U.S.
11.3.2 Canada
11.3.3 Mexico
12.4 Europe
12.4.1 Germany
12.4.2 U.K.
12.4.3 France
12.4.4 Russia
12.4.5 Italy
12.4.6 Turkey
12.4.7 Spain
12.4.8 Rest of European Countries
12.5 Middle East
12.5.1 Saudi Arabia
12.5.2 UAE
12.5.3 Rest of Middle East Countries
12.6 South America
12.6.1 Brazil
12.6.2 Rest of South American Countries
12.7 Africa
12.7.1 South Africa
12.7.2 Rest of South African Countries
13 Competitive Landscape
13.1 Overview
13.2 Market Share Analysis
13.3 Most Adopted Growth Strategy
13.4 Competitive Situation & Trends
13.5 Competitive Benchmarking
14 Company Profiles
14.1 PPG Industries Inc.
14.2 E. I. Du Pont De Nemours and Company
14.3 Akzonobel N.V.
14.4 The Valspar Corporation
14.5 The Sherwin-Williams Company
14.6 BASF SE
14.7 Axalta Coating Systems
14.8 Kansai Coating System
14.9 The Beckers Group
14.10 Henkel AG & Co. KGaA
14.11 Nippon Paint Holdings Co., Ltd.
14.12 Other Key Players/Companies Considered in the Report
14.12.1 Nof Metal Coatings
14.12.2 United Metal Coating LLC
14.12.3 AFP Metal Products
14.12.4 ICI Paints
14.12.5 Alucoil LLC
14.12.6 Jinhu Color Powder Coating Co., Ltd.
14.12.7 Magni Industries, Inc.
14.12.8 Guangzhou Cm Paint & Coating Co., Ltd.
14.12.9 3A Composites
14.12.10 Fameline Products Co., Ltd.
15 Appendix
15.1 Experts From Industry
15.2 Discussion Guide
15.3 Introducing RT: Real Time Market Intelligence
15.4 Available Customizations
15.5 Related Reports
List of Tables (187 Tables)
Table 1 Global Metal Coatings Market Overview (2016-2021)
Table 2 Metal Coatings Market, By Resin Type
Table 3 Metal Coatings Market, By Process
Table 4 Metal Coatings Market, By Technology
Table 5 Metal Coatings Market, By Application
Table 6 Patent Analysis, 2014 � 2015
Table 7 Metal Coatings Market Size, By Technology, 2014�2026 (Million Gallon)
Table 8 Metal Coatings Markets Size, By Technology, 2014�2026 (USD Million)
Table 9 Liquid Metal Coatings Market Size, By Technology, 2014�2026 (Million Gallon)
Table 10 Liquid Metal Coatings Market Size, By Technology, 2014�2026 (USD Million)
Table 11 Solvent-Based Liquid Metal Coatings Market Size, By Technology, 2014�2026 (Million Gallon)
Table 12 Solvent-Based Liquid Metal Coatings Market Size, By Technology, 2014�2026 (USD Million)
Table 13 Water-Based Liquid Metal Coatings Market Size, By Technology, 2014�2026 (Million Gallon)
Table 14 Water-Based Liquid Metal Coatings Market Size, By Technology, 2014�2026 (USD Million)
Table 15 Powder Metal Coatings Market Size, By Technology, 2014�2026 (Million Gallon)
Table 16 Powder Metal Coatings Market Size, By Technology, 2014�2026 (USD Million)
Table 17 Metal Coatings Market Size, By Process, 2014�2026 (Million Gallon)
Table 18 Metal Coatings Market Size, By Process, 2014�2026 (USD Million)
Table 19 Coil Coating Process Market Size, By Region, 2014�2026 (Million Gallon)
Table 20 Coil Coating Process Market Size, By Region, 2014�2026 (USD Million)
Table 21 Extrusion Coating Process Market Size, By Region, 2014�2026 (Million Gallon)
Table 22 Extrusion Coating Process Market Size, By Region, 2014�2026 (USD Million)
Table 23 Hot-Dip Galvanizing Process Market Size, By Region, 2014�2026 (Million Gallon)
Table 24 Hot-Dip Galvanizing Process Market Size, By Region, 2014�2026 (USD Million)
Table 25 Metal Coatings Market Size, By Resin Type, 2014-2026 (Million Gallon)
Table 26 Metal Coatings Market Size, By Resin Type, 2014-2026 (USD Million)
Table 27 Polyester Resin Metal Coatings Market Size, By Region, 2014-2026 (Million Gallon)
Table 28 Polyester Resin Metal Coatings Market Size, By Region, 2014-2026 (USD Million)
Table 29 Plastisol Resin Metal Coatings Market Size, By Region, 2014-2026 (Million Gallon)
Table 30 Plastisol Resin Metal Coatings Market Size, By Region, 2014-2026 (USD Million)
Table 31 Siliconized Polyester Resin Metal Coatings Market Size, By Region 2014-2026 (Million Gallon)
Table 32 Siliconized Polyester Resin Metal Coatings Market Size, By Region, 2014-2026 (USD Million)
Table 33 Fluoropolymer Resin Metal Coatings Market Size, By Region , 2014-2026 (Million Gallon)
Table 34 Fluoropolymer Resin Metal Coatings Market Size, By Region, 2014-2026 (USD Million)
Table 35 Polyurethane Resin Metal Coatings Market Size, By Region , 2014-2026 (Million Gallon)
Table 36 Polyurethane Resin Metal Coatings Market Size, By Region, 2014-2026 (USD Million)
Table 37 Other Resin Metal Coatings Market Size, By Region, 2014-2026 (Million Gallon)
Table 38 Other Resin Metal Coatings Market Size, By Region, 2014-2026 (USD Million)
Table 39 Metal Coatings Market Size, By End-Use Industry, 2014�2026 (Million Gallon)
Table 40 Metal Coatings Market Size, By End-Use Industry, 2014�2026 (USD Million)
Table 41 Metal Coatings Market Size in Building & Construction Ndustry, By Region, 2014�2026 (Million Gallon)
Table 42 Metal Coatings Market Size in Building & Construction Industry, By Region, 2014�2026 (USD Million)
Table 43 Metal Coatings Market Size in Automotive & Transporation Industry By Region 2014�2026 (Million Gallon)
Table 44 Metal Coatings Market Size in Automotive & Transporation Industry By Region 2014�2026 (USD Million )
Table 45 Metal Coatings Market Size in Consumer Goods & Appliances Industry By Region 2014�2026 (Million Gallon)
Table 46 Metal Coatings Market Size in Consumer Goods & Appliances Industry By Region 2014�2026 (USD Million )
Table 47 Metal Coatings Market Size in Marine & Protective Coatings Industry, By Region 2014�2026 (Million Gallon)
Table 48 Metal Coatings Market Size in Marine &Protective Coatings Industry, By Region 2014�2026 (USD Million)
Table 49 Metal Coatings Market Size in Other End Use Industry, By Region 2014�2026 (Million Gallon)
Table 50 Metal Coatings Market Size in Other End Use Industry, By Region 2014�2026 (USD Million )
Table 51 Top Economies By GDP in Ppp Terms, 2010 & 2020 (USD Trillion)
Table 52 Asia-Pacific: Metal Coatings Market Size, By Country, 2014�2026 (Million Gallon)
Table 53 Asia-Pacific: Metal Coatings Market Size, By Country, 2014�2021 (USD Million)
Table 54 Asia-Pacific: Metal Coatings Market Size, By Process, 2014�2026 (Million Gallon)
Table 55 Asia-Pacific: Metal Coatings Market Size, By Process, 2014�2026 (USD Million)
Table 56 Asia-Pacific: Metal Coatings Market Size, By Resin Type, 2014�2026 (Million Gallon)
Table 57 Asia-Pacific: Metal Coatings Market Size, By Resin Type, 2014�2026 (USD Million)
Table 58 Asia-Pacific: Metal Coatings Market Size, By Technology, 2014�2026 (Million Gallon)
Table 59 Asia-Pacific: Metal Coatings Market Size, By Technology, 2014�2026 (USD Million)
Table 60 Asia-Pacific: Metal Coatings Market Size, By End-Use Industry, 2014�2026 (Million Gallon)
Table 61 Asia-Pacific: Metal Coatings Market Size, By End-Use Industry, 2014�2026 (USD Million)
Table 62 China: Macro Economic Indicators
Table 63 China: Metal Coatings Market Size, By End-Use Industry, 2014�2026 (Million Gallon)
Table 64 China: Metal Coatings Market Size, By End-Use Industry, 2014-2026 (USD Million)
Table 65 India: Macro Economic Indicators
Table 66 India: Metal Coatings Market Size, By End-Use Industry, 2014�2026 (Million Gallon)
Table 67 India: Metal Coatings Market Size, By End-Use Industry, 2014�2026 (USD Million)
Table 68 Japan: Macro Economic Indicators
Table 69 Japan: Metal Coatings Market Size, By End-Use Industry, 2014�2026 (Million Gallon)
Table 70 Japan: Metal Coatings Market Size, By End-Use Industry, 2014�2026 (USD Million)
Table 71 South Korea: Macro Economic Indicators
Table 72 South Korea: Metal Coatings Market Size, By End-Use Industry, 2014�2026 (Million Gallon)
Table 73 South Korea: Metal Coatings Market Size, By End-Use Industry, 2014�2026 (USD Million)
Table 74 Thailand: Macro Economic Indicators
Table 75 Thailand: Metal Coatings Market Size, By End-Use Industry, 2014�2026 (Million Gallon)
Table 76 Thailand: Metal Coatings Market, By End-Use Industry , 2014-2021 (USD Million)
Table 77 Indonesia: Metal Coatings Market Share (Volume), By End-Use Industry, 2015
Table 78 Indonesia: Macro Economic Indicators
Table 79 Indonesia: Metal Coatings Market Size, By End-Use Industry, 2014�2026 (Million Gallon)
Table 80 Indonesia: Metal Coatings Market Size, By End-Use Industry, 2014�2026 (USD Million)
Table 81 Vietnam: Metal Coatings Market Size, By End-Use Industry, 2014�2026 (Million Gallon)
Table 82 Vietnam: Metal Coatings Market Size, By End-Use Industry, 2014�2026 (USD Million)
Table 83 Rest of Asia-Pacific: Metal Coatings Market Size, By End-Use Industry, 2014�2026 (Million Gallons)
Table 84 Rest of Asia-Pacific: Metal Coatings Market Size, By End-Use Industry, 2014�2026 (USD Million)
Table 85 Europe: Metal Coatings Market Size, By Country, 2014�2026 (Million Gallon)
Table 86 Europe: Metal Coatings Market Size, By Country, 2014�2026 (USD Million)
Table 87 Europe: Metal Coatings Market Size, By Process, 2014�2026 (Million Gallon)
Table 88 Europe: Metal Coatings Market Size, By Process, 2014�2026 (USD Million)
Table 89 Europe: Metal Coatings Market Size, By Resin Type, 2014�2026 (Million Gallon)
Table 90 Europe: Metal Coatings Market Size, By Resin Type, 2014�2026 (USD Million)
Table 91 Europe: Metal Coatings Market Size, By Technology, 2014�2026 (Million Gallon)
Table 92 Europe: Metal Coatings Market Size, By Technology, 2014�2026 (USD Million)
Table 93 Europe: Metal Coatings Market Size, By End-Use Industry, 2014�2026 (Million Gallon)
Table 94 Europe: Metal Coatings Market Size, By End-Use Industry, 2014�2026 (USD Million)
Table 95 Russia: Metal Coatings Market Size, By End-Use Industry, 2014�2026 (Million Gallon)
Table 96 Russia: Metal Coatings Market Size, By End-Use Industry, 2014�2026 (USD Million)
Table 97 France: Macroeconomic Indicators
Table 98 France: Metal Coatings Market Size, By End-Use Industry, 2014�2026 (Million Gallon)
Table 99 France: Metal Coatings Market Size, By End-Use Industry, 2014�2026 (USD Million)
Table 100 Germany: Macroeconomic Indicators
Table 101 Germany: Metal Coatings Market Size, By End-Use Industry, 2014�2026 (Million Gallon)
Table 102 Germany: Metal Coatings Market Size, By End-Use Industry, 2014�2026 (USD Million)
Table 103 U.K.: Macroeconomic Indicators
Table 104 U.K.: Metal Coatings Market Size, By End-Use Industry, 2014�2026 (Million Gallon)
Table 105 U.K.: Metal Coatings Market Size, By End-Use Industry, 2014�2026 (USD Million)
Table 106 Spain: Macroeconomic Indicators
Table 107 Spain: Metal Coatings Market Size, By End-Use Industry, 2014�2026 (Million Gallon)
Table 108 Spain: Metal Coatings Market Size, By End-Use Industry, 2014�2026 (USD Million)
Table 109 Italy: Metal Coatings Market Size, By End-Use Industry, 2014�2026 (Million Gallon)
Table 110 Italy: Metal Coatings Market Size, By End-Use Industry, 2014�2026 (USD Million)
Table 111 Turkey: Macroeconomic Indicators
Table 112 Turkey: Metal Coatings Market Size, By End-Use Industry, 2014�2026 (Million Gallon)
Table 113 Turkey: Metal Coatings Market Size, By End-Use Industry, 2014�2026 (USD Million)
Table 114 Rest of Europe: Metal Coatings Market Size, By End-Use Industry, 2014�2026 (Million Gallon)
Table 115 Rest of Europe: Metal Coatings Market Size, By End-Use Industry, 2014�2026 (USD Million)
Table 116 North America: Metal Coatings Market Size, By Country, 2014-2026 (Million Gallon)
Table 117 North America: Metal Coatings Market Size, By Country, 2014-2026 (USD Million)
Table 118 North America: Metal Coatings Market Size, By Process, 2014-2026 (Million Gallon)
Table 119 North America: Metal Coatings Market Size, By Process, 2014-2026 (USD Million)
Table 120 North America: Metal Coatings Market Size, By Resin Type, 2014-2026 (Million Gallon)
Table 121 North America: Metal Coatings Market Size, By Resin Type, 2014-2026 (USD Million)
Table 122 North America: Metal Coatings Market Size, By Technology, 2014-2026 (Million Gallon)
Table 123 North America: Metal Coatings Market Size, By Technology, 2014-2026 (USD Million)
Table 124 North America: Metal Coatings Market Size, By End-Use Industry, 2014-2026 (Million Gallon)
Table 125 North America: Metal Coatings Market Size, By End-Use Industry, 2014-2026 (USD Million)
Table 126 U.S.Macro Economic Indicators
Table 127 U.S.: Metal Coatings Market Size, By End-Use Industry, 2014-2026 (Million Gallon)
Table 128 U.S.: Metal Coatings Market Size, By End-Use Industry, 2014-2026 (USD Million)
Table 129 Canada.Macro Economic Indicators
Table 130 Canada: Metal Coatings Market Size, By End-Use Industry, 2014-2026 (Million Gallon)
Table 131 Canada: Metal Coatings Market Size, By End-Use Industry, 2014-2026 (USD Million)
Table 132 Mexico Economic Indicators
Table 133 Mexico: Metal Coatings Market Size, By End-Use Industry, 2014-2026 (Million Gallon)
Table 134 Mexico: Metal Coatings Market Size, By End-Use Industry, 2014-2026 (USD Million)
Table 135 Middle East: Metal Coatings Market Size, By Country, 2014-2026 (Million Gallon)
Table 136 Middle East: Metal Coatings Market Size, By Country, 2014-2026 (USD Million)
Table 137 Middle East: Metal Coatings Market Size, By Process, 2014-2026 (Million Gallon)
Table 138 Middle East: Metal Coatings Market Size, By Process, 2014-2026 (USD Million)
Table 139 Middle East: Metal Coatings Market Size, By Resin Type, 2014-2026 (Million Gallon)
Table 140 Middle East: Metal Coatings Market Size, By Resin Type, 2014-2026 (USD Million)
Table 141 Middle East: Metal Coatings Market Size, By Technology, 2014-2026 (Million Gallons)
Table 142 Middle East: Metal Coatings Market Size, By Technology, 2014-2026 (USD Million)
Table 143 Middle East: Metal Coatings Market Size, By End-Use Industry, 2014-2026 (Million Gallon)
Table 144 Middle East: Metal Coatings Market Size, By End-Use Industry, 2014-2026 (USD Million)
Table 145 Saudi Arabia: Metal Coatings Market Size, By End-Use Industry, 2014-2026 (Million Gallon)
Table 146 Saudi Arabia: Metal Coatings Market Size, By End-Use Industry, 2014-2026 (USD Million)
Table 147 UAE: Metal Coatings Market Size, By End-Use Industry, 2014-2026 (Million Gallon)
Table 148 UAE: Metal Coatings Market Size, By End-Use Industry, 2014-2026 (USD Million)
Table 149 Qatar: Metal Coatings Market Size, By End-Use Industry, 2014-2026 (Million Gallon)
Table 150 Qatar: Metal Coatings Market Size, By End-Use Industry, 2014-2026 (USD Million)
Table 151 Yemen: Metal Coatings Market Size, By End-Use Industry, 2014-2026 (Million Gallon)
Table 152 Yemen: Metal Coatings Market Size, By End-Use Industry, 2014-2026 (USD Million)
Table 153 Rest of the Middle East: Metal Coatings Market Size, By End-Use Industry, 2014-2026 (Million Gallon)
Table 154 Rest of the Middle East: Metal Coatings Market Size, By End-Use Industry, 2014-2026 (USD Million)
Table 155 South America- Macro Economic Indicators
Table 156 South America: Metal Coatings Market, By Country, 2014-2026 (Million Gallon)
Table 157 South America: Metal Coatings Market, By Country, 2014-2026 (USD Million)
Table 158 South America: Metal Coatings Market, By Process, 2014-2026 (Million Gallon)
Table 159 South America: Metal Coatings Market, By Process, 2014-2026 (USD Million)
Table 160 South America: Metal Coatings Market, By Resin Type, 2014-2026 (Million Gallon)
Table 161 South America: Metal Coatings Market, By Resin Type, 2014-2026 (USD Million)
Table 162 South America: Metal Coatings Market, By Technology, 2014-2026 (Million Gallon)
Table 163 South America: Metal Coatings Market, By Technology, 2014-2026 (USD Million)
Table 164 South America: Metal Coatings Market, By End-Use Industry, 2014-2026 (Million Gallon)
Table 165 South America: Metal Coatings Market, By End-Use Industry, 2014-2026 (USD Million)
Table 166 Brazil: Metal Coatings Market, By End-Use Industry, 2014-2026 (Million Gallon)
Table 167 Brazil: Metal Coatings Market, By End-Use Industry, 2014-2026 (USD Million)
Table 168 Rest of South America: Metal Coatings Market, By End-Use Industry, 2014-2026 (Million Gallon)
Table 169 Rest of South America : Metal Coatings Market, By End-Use Industry, 2014-2026 (USD Million)
Table 170 Africa: Metal Coatings Market, By Country, 2014-2026 (Million Gallon)
Table 171 Africa : Metal Coatings Market, By Country, 2014-2026 (USD Million)
Table 172 Africa: Metal Coatings Market, By Process, 2014-2026 (Million Gallon)
Table 173 Africa: Metal Coatings Market, By Process, 2014-2026 (USD Million)
Table 174 Africa: Metal Coatings Market, By Resin Type, 2014-2026 (Million Gallon)
Table 175 Africa: Metal Coatings Market, By Resin Type, 2014-2026 (USD Million)
Table 176 Africa: Metal Coatings Market, By Technology, 2014-2026 (Million Gallon)
Table 177 Africa: Metal Coatings Market, By Technology, 2014-2026 (USD Million)
Table 178 Africa: Metal Coatings Market, By End-Use Industry, 2014-2026 (Million Gallon)
Table 179 Africa: Metal Coatings Market, By End-Use Industry, 2014-2026 (USD Million)
Table 180 South Africa: Metal Coatings Market, By End-Use Industry, 2014-2026 (Million Gallon)
Table 181 South Africa: Metal Coatings Market, By End-Use Industry, 2014-2026 (USD Million)
Table 182 Rest of South Africa : Metal Coatings Market, By End-Use Industry, 2014-2026 (Million Gallon)
Table 183 Rest of South Africa: Metal Coatings Market, By End-Use Industry, 2014-2026 (USD Million)
Table 184 New Product Launches Growth Strategies : Metal Coatings Market
Table 185 Investment & Expansion Growth Strategies : Metal Coatings Market
Table 186 Merger & Acqusition Growth Strategies : Metal Coatings Market
Table 187 Joint Venture, Partnership and Agreement: Metal Coatings Market
List of Tables (92 Figures)
Figure 1 Breakdown of Primary Interviews
Figure 2 Asia-Pacific to Register Highest CAGR During 2016-2021
Figure 3 Fluoropolymer Resin to Register Highest During 2016-2021
Figure 4 Coil Coating Process to Register Highest CAGR During 2016-2021
Figure 5 Powder Coating to Register Higher CAGR During 2016- 2021
Figure 6 Building & Construction is Projected to Have the Highest CAGR2021
Figure 7 Surge in Demand for Metal Coating Products in Developing Countries Presents Opportunities
Figure 8 Coil Coating Process to Register the Highest CAGR Till 2021
Figure 9 Metal Coatings Market to Register High Growth in Developing Countries Between 2016 and 2021
Figure 10 India is Projected to Grow at the Fastest Rate Between 2016 and 2021
Figure 11 Metal Coatings Market, By Region
Figure 12 High Demand From Building & Construction End-Use Industry Will Drive the Metal Coatings Market in Asia-Pacific
Figure 13 Porter�s Five Forces Analysis
Figure 14 Patent Details
Figure 15 Japan Accounted for the Highest Number of Patents Filed Between 2014 and 2015
Figure 16 Kansai Paints Co Ltd Had the Highest Numbers of Patents Between 2014 and 2015
Figure 17 Metal Coatings Market Share, By Technology, 2015
Figure 18 Liquid Metal Coatings Market Share, By Region, 2015
Figure 19 Solvent-Based Metal Coatings Market Share , By Region, 2015
Figure 20 Water-Based Metal Coatings Market Share, By Region, 2015
Figure 21 Powder Metal Coatings Market Share, By Region, 2015
Figure 22 Metal Coatings Market Share, By Process, 2015
Figure 23 Coil Coating Market Share, By Region, 2015
Figure 24 Extrusion Coating Market Share, By Region, 2015
Figure 25 Hot-Dip Galvanizing Market Share, By Region, 2015
Figure 26 Metal Coatings Market Share, By Resin Type , 2015
Figure 27 Polyester Resin Metal Coatings Market Share, By Region, 2015
Figure 28 Plastisol Resin Metal Coatings Market Share, By Region, 2015
Figure 29 Siliconized Polyester Resin Metal Coatings Market Share, 2015
Figure 30 Fluoropolymer Resin Metal Coatings Market Share,, 2015
Figure 31 Polyurethane Resin Metal Coatings Market Share,, 2015
Figure 32 Other Resin Metal Coatings Market Share,, 2015
Figure 33 End-Use Industries Share, 2015
Figure 34 Metal Coatings Market Share in Building & Construction End-Use Industry By Region 2015
Figure 35 Metal Coatings Market Share in Automotive & Transportation End- Use Industry, By Volume, By Region 2015
Figure 36 Metal Coatings Market Share in Consumer Goods & Appliances Industry, By Region 2015
Figure 37 Metal Coatings Market Share in Marine & Protective Coatings Industry, By Region 2015
Figure 38 Metal Coatings Market Share in Other End-Use Industry, By Region 2015
Figure 39 Metal Coatings Market Share, By Region, 2015
Figure 40 Metal Coatings Market Growth Rate, By Technology & Region (2016�2021)
Figure 41 Metal Coatings Market Growth Rate, By Process & Region (2016�2021)
Figure 42 Metal Coatings Growth Rate, By Resin Type & Region (2016�2021)
Figure 43 Metal Coatings Market Growth Rate, By End-Use Industry & Region (2016�2021)
Figure 44 Asia-Pacific: Metal Coatings Market Snapshot
Figure 45 China is Projected to Dominate the Metal Coatings Market Through 2021
Figure 46 China: Metal Coatings Market Share, By End-Use Industry, 2015
Figure 47 India: Metal Coatings Market Share By End-Use Industry, 2015
Figure 48 Japan: Metal Coatings Market Share, By End-Use Industry, 2015
Figure 49 South Korea: Metal Coatings Market Share, By End-Use Industry, 2015
Figure 50 Thailand: Metal Coatings Market Share, By End-Use Industry, 2015
Figure 51 Vietnam: Metal Coatings Market Share, By End-Use Industry, 2015
Figure 52 Rest of Asia-Pacific: Metal Coatings Market Share, By End-Use Industry, 2015
Figure 53 Europe: Metal Coatings Market Share, By Application, By 2015
Figure 54 Russia to Dominate the Metal Coatings Market in Europe
Figure 55 Russia: Metal Coatings Market Share, By End-Use Industry, 2015
Figure 56 France: Metal Coatings Market Share, By End-Use Industry, 2015
Figure 57 Germany: Metal Coatings Market Share By End-Use Industry, 2015
Figure 58 U.K.: Metal Coatings Market Share, By End-Use Industry, 2015
Figure 59 Spain: Metal Coatings Market Share, By End-Use Industry, 2015
Figure 60 Italy: Metal Coatings Market Share, By End-Use Industry, 2015
Figure 61 Turkey: Metal Coatings Market Share, By End-Use Industry, 2015
Figure 62 Rest of Europe: Metal Coatings Market Share, By End-Use Industry, 2015
Figure 63 North America: Metal Coatings Market Share,, 2015
Figure 64 U.S. to Dominate the Metal Coatings Market in North America Till 2021
Figure 65 U.S. Metal Coatings Market Share, By End-Use Industry, 2015
Figure 66 U.S. Metal Coatings Market Share, By End-Use Industry, 2015
Figure 67 Canada: Metal Coatings Market Share, By End-Use Industry, 2015
Figure 68 Mexico: Metal Coatings Market Share By End-Use Industry, 2015
Figure 69 Middle East: Metal Coatings Market Size By Application,, 2015
Figure 70 Saudi Arabia to Dominate the Middle East Metal Coatings Market
Figure 71 Saudi Arabia: Metal Coatings Market Share, By End-Use Industry, 2015
Figure 72 UAE: Metal Coatings Market Share, By End-Use Industry, 2015
Figure 73 Qatar: Metal Coatings Market Share, By End-Use Industry, 2015
Figure 74 Yemen: Metal Coatings Market Share, By End-Use Industry, 2015
Figure 75 Rest of the Middle East: Metal Coatings Market Share (Volume), By End-Use Industry, 2015
Figure 76 South America: Metal Coatings Market Size, By Application, 2015
Figure 77 Brazil to Dominate Metal Coatings Market in South America Till 2021
Figure 78 Brazil: Metal Coatings Market Share, By End-Use Industry, 2015
Figure 79 Rest of South America. Metal Coatings Market Share, By End-Use Industry, 2015
Figure 80 Africa: Metal Coatings Market Size, By Application,, 2015
Figure 81 South Africa to Dominate Metal Coatings Market in Africa,
Figure 82 South Africa: Metal Coatings Market Share,, By End-Use Industry, 2015
Figure 83 Rest of Africa: Metal Coatings Market Share, By End-Use Industry, 2015
Figure 84 Companies Organic and Inorganic Growth Strategies : Metal Coatings Market
Figure 85 Companies Adopted New Product Launch and Investment & Expansion Growth Strategies
Figure 86 Companies Organic and Inorganic Growth Strategies : Metal Coatings Market
Figure 87 New Product Launch and Investment & Expansion Strategy Were Adopted By the Players
Figure 88 Market Share Analysis: Metal Coatings Market
Figure 89 Akzonobel N.V., the Valspar Corporation, and PPG Industries Inc. Accounted Fort the Largest Market Share
Figure 90 Investment & Expansion Growth Strategies : Metal Coatings Market
Figure 91 Merger & Acqusition Growth Strategies : Metal Coatings Market
Figure 92 Joint Venture, Partnership and Agreement: Metal Coatings Market


Growth opportunities and latent adjacency in Metal Coatings Market