Natural Gas Storage Market by Type (Underground, Above Ground, and Floating), and by Geography - Global Trends & Forecasts till 2019


Natural gas storage plays a significant role in managing the reliability of supply needed to meet the demands of consumers. A decade ago, natural gas was a regulated commodity; storage was a part of the bundled product sold by the pipelines to the distribution utilities. Later, this was deregulated and made available to everyone seeking storage for commercial purposes or operational requirements. Gas storage is primarily used to meet the seasonal demand; it is stored during periods of low demand and withdrawn from storage during the periods of peak/high demand. Natural gas storage Market is of two types namely; underground natural gas storage and above ground natural gas storage.
Underground storage facilities are mainly used to store gaseous forms of natural gas. There are generally three types of underground storage facilities namely, salt caverns formation, aquifers, and depleted reservoirs in oil or gas fields. The different storage types have their own physical characteristics such as porosity, permeability, maintenance cost, and other suitable capabilities of the site. The growing demand for natural gas led to increase in exploration of oil and gas fields which in turn led to increase in underground and above ground storage facilities. The Natural Gas Storage Market is therefore, expected to show sound growth in coming years.
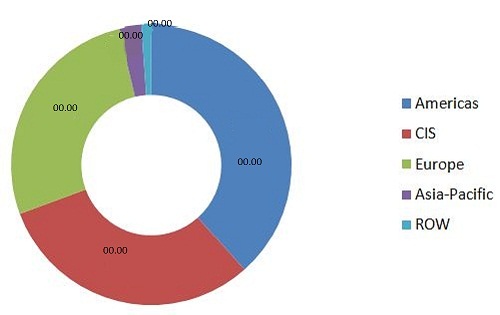
Americas is the largest Natural Gas Storage Market for underground storage facilities, followed by the CIS region. In 2013, Americas had the highest working gas capacity of 152.0 BCM (billion cubic meters) and is projected to grow by 158.6 BCM in 2019. On the other hand, the working gas capacity of CIS region was 122.4 BCM in 2013 and is expected to grow by 135.4 BCM by 2019. In terms of working gas capacity, Americas is expected to continue to lead in the next five years.
Global Working Gas Capacity (BCM) Market Share, by Geography, 2013
The report analyzes the global natural gas storage market. The market is segmented on the basis of its types such as underground natural gas storage and above ground natural gas storage. Natural Gas Storage Market report also describes various marketing trends and elucidates the most effective growth strategy in the market. It highlights various key industrial issues and market impulse factors. It also describes a number of important dynamics such as drivers, restraints, and opportunities.
In order to provide a deeper understanding of the competitive landscape, the natural gas storage market report includes profiles of some major companies who are involved in the value chain of natural gas storage Market such as Foster wheeler (U.K.), Worley Parsons (Australia), Centrica (U.K.), Niska gas storage (U.S.), Samsung Heavy Industries (Korea), E-on (Germany), spectra Energy (U.S.), Chiyoda Corporation (Japan), Technip (France), and GDF SUEZ (France), among others.
Market share analysis, by revenue, of top companies is also included in the report. The scope accordingly, aids market participants in identifying high growth markets and managing key investment decisions. For this study, major market players have been identified through secondary and primary research activities. The Natural Gas Storage Market share analysis of these key players is arrived at, based on key facts, annual financial information, and interviews with key opinion leaders such as CEOs, Directors, and marketing executives.
Global Natural Gas Storage Market is projected to reach $763.60 Billion by 2019. The liquefaction and regasification market would reach $299.45 Billion and $18.88 Billion respectively while the underground storage market is expected to be $445.27 Billion by 2019.
The Americas dominated both underground and above-ground liquified natural gas storage market in 2013. In terms of underground storage capacity, Americas have the highest working gas capacity of 152.0 BCM (billion cubic meters) in 2013. Between 2014 � 2019, the region is expected to expand its capacity by 5.3 BCM to reach a total of 158.6 BCM by 2019.
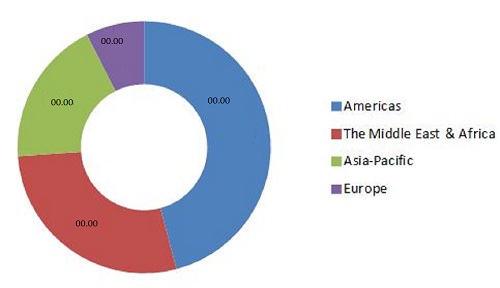
Whereas, in terms of above ground storage facility that includes liquefied natural gas storage , Americas have the highest liquefaction capacity in comparison to Asia-Pacific, which dominates the natural gas storage market in regasification capacity. Over the next five years, the global LNG requirement is expected to increase by an additional 279.7 MTPA. By 2019, the global liquefaction capacity is expected to be 704.9 MTPA.
The figure below shows the global liquefaction capacity market share, by geography, in 2013.
Global Liquefaction Capacity (MTPA) Market Share, by Geography, 2013
Source: Related Publications and MarketsandMarkets Analysis
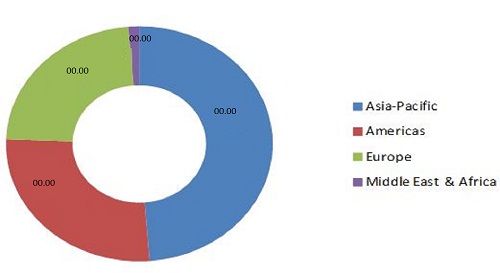
In terms of regasification capacity, Asia-Pacific hold the largest share of global capacity with 306.8 MTPA. This is expected to reach 764.7 MTPA by 2019 from an estimated capacity of 675.6 MTPA in 2014.
Global Regasification Capacity (MTPA) Market Share, by Geography, 2013
Source: Related Publications and MarketsandMarkets Analysis
The Natural Gas Storage Market can be classified broadly into two categories namely, underground natural gas storage market and above-ground natural gas storage market. In 2013, the total underground working gas capacity was 395.6 BCM and is expected to reach 458.2 BCM by 2019, because of heavy increament in storage facilities from 2014�2019.
In terms of above ground storage in 2013, the total liquefaction and regasification capacity was 403.2 MTPA and 464.9 MTPA, which is later expected to reach 704.9 MTPA and 575.5 MTPA by 2019, because of expansion in storage facilities from 2014 � 2019.
We have also profiled leading players of natural gas storage industry, along with their recent developments and other strategic industry activities. Some of the key companies profiled include Foster Wheeler (U.K.), Worley Parsons (Australia), Centrica (U.K.), Niska Gas Storage (U.S.), Samsung Heavy Industries (Korea), E-on (Germany), Spectra Energy (U.S.), Chiyoda Corporation (Japan), Technip (France) and GDF SUEZ (France) among others.
 Exclusive indicates content/data unique to MarketsandMarkets and not available with any competitors.
Table of Contents
1 Introduction
1.1 Objectives of the Study
1.2 Report Description
1.3 Natural gas storage Markets Covered
1.4 Stakeholders
2 Research MEthodology
2.1 Market Size Estimation
2.2 Market Share Estimation
2.2.1 Key Data Points Taken From Secondary Sources
2.2.2 Key Data Points From Primary Sources
2.2.2.1 Key Industry Insights
2.2.3 Assumptions
3 Executive Summary
4 Premium Insights
5 Natural Gas Storage Market Overview
6 Industry Trends
6.1 Value Chain Analysis
6.2 Poeter�s Five Force Model
7 Underground Natural Gas Storage Market : By Capacity, By Geography
7.1 Underground Storage
7.2 Underground Storage, By Geography
7.2.1 Americas
7.2.2 Europe
7.2.3 Commonwealth of Independent States (CIS)
7.2.4 Asia-Pacific
7.2.5 Rest of the World (ROW)
7.3 Underground Storage, By Type
7.3.1 Depleted Reservoirs
7.3.2 Aquifers
7.3.3 Salt Caverns
8 Above-Ground Natural Gas Storage Market: By Capacity(LNG), By Geography
8.1 Liquefaction Capacity
8.1.1 Lng Liquefaction Capacity, By Geography
8.1.1.1 Asia-Pacific
8.1.1.1.1 Australia
8.1.1.1.2 Brunei
8.1.1.1.3 Indonesia
8.1.1.1.4 Malaysia
8.1.2 Americas
8.1.2.1 United States (U.S.)
8.1.2.2 MExico
8.1.2.3 Argentina
8.1.2.4 Canada
8.1.3 Europe
8.1.3.1 Norway
8.1.3.2 Russia
8.1.3.3 the Netherlands
8.1.3.4 United Kingdom (U.K.)
8.1.4 The Middle East & Africa
8.1.4.1 Oman
8.1.4.2 Qatar
8.1.4.3 U.A.E
8.1.4.4 Yemen
8.1.4.5 Egypt
8.1.4.6 Nigeria
8.1.4.7 Equatorial Guinea
8.2 Regasification Capacity
8.2.1 Lng Regasification Capacity, By Geography
8.2.2 Asia-Pacific
8.2.2.1 China
8.2.2.2 India
8.2.2.3 Japan
8.2.2.4 South Korea
8.2.2.5 Others (Malaysia, Indonesia, Thailand, Singapore)
8.2.3 Americas
8.2.3.1 United States (U.S.)
8.2.3.2 Canada
8.2.3.3 MExico
8.2.3.4 Uruguay
8.2.3.5 Others (Argentina, Brazil, Chile)
8.2.4 Europe
8.2.4.1 Spain
8.2.4.2 France
8.2.4.3 United Kingdom (U.K.)
8.2.4.4 Italy
8.2.4.5 Others (the Netherlands, Belgium, Greece, Portugal, Sweden, Turkey)
8.2.5 The ME & Africa
8.3 Floating Lng (Flng)
8.3.1 Introduction
8.3.2 Asia-Pacific
8.3.3 Americas
8.3.4 Europe59
8.3.5 The ME & Africa
9 Geographic Analysis
9.1 Introduction
9.2 Asia-Pacific
9.3 Europe
9.4 Americas
10 Competitive Landscape
10.1 Overview61
10.2 Contract Award
10.3 MErger & Acquisitions
10.4 New Product Development
10.5 Expansion
10.6 Joint Venture
11 Company Profiles
11.1 Introduction
11.2 Worley Parsons
11.2.1 Business Overview
11.2.2 Products & Services
11.2.3 Key Strategy
11.2.4 Recent Developments
11.2.5 SWOT Analysis
11.2.6 MNM Veiw
11.3 Technip
11.3.1 Business Overview76
11.3.2 Products & Services77
11.3.3 Key Strategy
11.3.4 Recent Developments
11.3.5 SWOT Analysis
11.3.6 MNM View
11.4 Samsung Heavy Industries
11.4.1 Business Overview
11.4.2 Products & Services
11.4.3 Key Strategy
11.4.4 Recent Developments
11.4.5 SWOT Analysis
11.4.6 MNM View
11.5 Foster Wheeler
11.5.1 Business Overview
11.5.2 Products & Services
11.5.3 Key Strategy
11.5.4 Recent Developments
11.5.5 SWOT Analysis
11.5.6 MNM View
11.6 GDF Suez
11.6.1 Business Overview
11.6.2 Products & Services
11.6.3 Key Strategy
11.6.4 Recent Developments
11.6.5 SWOT Analysis
11.6.6 MNM View
11.7 Centrica
11.7.1 Business Overview
11.7.2 Products & Services
11.7.3 Key Strategy
11.7.4 Recent Development
11.8 Chiyoda Corporation
11.8.1 Business Overview
11.8.2 Products & Services
11.8.3 Key Strategy
11.8.4 Recent Developments
11.9 Niska Gas Storage
11.9.1 Business Overview
11.9.2 Products and Services
11.9.3 Key Strategy
11.9.4 Recent Developments
11.10 E-On
11.10.1 Business Overview
11.10.2 Products & Services
11.10.3 Key Strategy
11.10.4 Recent Developments
11.11 Spectra Energy
11.11.1 Business Overview
11.11.2 Products & Services
11.11.3 Key Strategy
11.11.4 Recent Developments
List of Tables (71 Tables)
Table 1 Global Underground Natural Gas Storage Market: Working Gas Capacity (BCM), By Geography, 2014-2019
Table 2 Americas: Working Gas Capacity Expansion (BCM), By Country, 2014-2019
Table 3 Europe: Working Gas Capacity Expansion (BCM), By Country, 2014-2019
Table 4 CIS: Working Gas Capacity Expansion (BCM), By Country, 2014-2019
Table 5 Asia-Pacific: Working Gas Capacity Expansion (BCM), By Country, 2014-2019
Table 6 ROW: Working Gas Capacity Expansion (BCM), By Country, 2014-2019
Table 7 Global Underground Storage Capacity (BCM), By Type, 2014-2019
Table 8 Depleted Reservoirs: Working Gas Capacity (BCM), By Geography (2014-2019)
Table 9 Aquifers: Working Gas Capacity, By Geography (2014-2019)
Table 10 Salt Caverns: Working Gas Capacity (BCM), By Geography (2014-2019)
Table 11 Global Liquefaction Capacity (Mtpa), By Geopgraphy, (2014-2019)
Table 12 Global Liquefaction Terminals Capex ($Billion), By Geography, (2014-2019)
Table 13 Asia-Pacific Liquefaction Capacity (Mtpa), By Country, (2014-2019)
Table 14 Asia-Pacific Liquefaction Terminals Capex ($Million), (2014-2019)
Table 15 Australia: Operational Lng Terminals Capacity (Mtpa), 2013
Table 16 Australia: Under-Construction Lng Terminals Capacity (Mtpa), (2014-2019)
Table 17 Australia: Planned Lng Terminals Capacity (Mmtpa), (2014-2019)
Table 18 Malaysia: Operational Lng Terminals Capacity (Mtpa), 2013
Table 19 Americas Liquefaction Capacity (Mtpa), By Country, (2014-2019)
Table 20 Americas Lng Liquefaction Terminals Capex ($Million), By Country, (2014-2019)
Table 21 U.S.: Operational Lng Liquefaction Terminals With Capacity (Mtpa), 2013
Table 22 U.S. Planned Lng Liquefaction Terminals With Capacity (Mtpa), (2014-2019)
Table 23 Mexico: Operational Lng Liquifaction Terminals With Capacity (Mtpa), 2013
Table 24 Argentina: Operational Lng Liquefaction Terminals With Capacity(Mtpa), 2013
Table 25 Canada: Planned Lng Liquefaction Terminals With Capacity (Mtpa), (2014-2019)
Table 26 Europe Liquefaction Capacity (Mmtpa), By Country, (2014-2019)
Table 27 Europe Lng Liquifaction Terminals Capex ($Million), By Country, (2014-2019)
Table 28 Russia: Planned Lng Liquefaction Terminals With Capacity (Mtpa), (2014-2019)
Table 29 The ME & Africa Lng Liquefaction Capacity (Mtpa), By Country, (2014-2019)
Table 30 The ME & Africa Lng Liquefaction Terminals Capex ($Million), By Country, (2014-2019)
Table 31 Oman: Operational Lng Liquefaction Terminals With Capacity (Mtpa), 2013
Table 32 Qatar : Operational Lng Liquefaction Terminals With Capacity(Mtpa), 2013
Table 33 Egypt: Operational Lng Liquefaction Terminals With Capacity (Mtpa), 2013
Table 34 Global Lng Regasification Capacity(Mtpa), By Geography, (2014-2019)
Table 35 Global Lng Regasification Terminals Capex ($Billion), By Geography, (2014-2019)
Table 36 Asia-Pacific: Lng Regasification Capacity (Mmtpa), By Geography,( 2014-2019)
Table 37 Asia-Pacific: Lng Regasification Terminals Capex ($Million), By Country, (2014-2019)
Table 38 China: Operational Lng Regaification Terminals With Capacity(Mtpa), 2013
Table 39 China: Under Construction Lng Regasification Terminals With Capacity(Mtpa), (2014-2019)
Table 40 India: Operational Lng Regasification Terminals With Capacity(Mtpa), 2013
Table 41 India: Planned Lng Regasification Terminals With Capacity(Mtpa), (2014-2019)
Table 42 Japan: Operational Lng Regasification Terminals With Capacity(Mtpa), 2013
Table 43 Japan: Under Construction Lng Regasification Terminals With Capacity(Mtpa), (2014-2019)
Table 44 South Korea: Operational Lng Regasification Terminals With Capacity(Mtpa), 2013
Table 45 South Korea: Under Construction Lng Regasification Terminals With Capacity(Mmtpa), (2014-2019)
Table 46 Other Countries: Operational Lng Regasification Terminals With Capacity(Mmtpa), 2013
Table 47 Other Countries: Under Construction Lng Regasification Terminals With Capacity (Mtpa), (2014-2019)
Table 48 Other Countries: Planned Lng Regasification Terminals With Capacity (Mtpa), (2014-2019)
Table 49 Americas: Lng Regasification Capacity (Mmtpa), By Country,( 2014-2019)
Table 50 Americas: Lng Regasification Terminals Capex, By Country, (2014-2019)
Table 51 U.S.: Operational Lng Regasification Terminals With Capacity(Mtpa), 2013
Table 52 Mexico: Operational Lng Regasification Terminals With Capacity(Mtpa), 2013
Table 53 Other Countries: Operational Lng Regasification Terminals With Capacity(Mtpa), 2013
Table 54 Europe: Lng Regasification Terminals Capacity(Mmtpa), (2014-2019)
Table 55 Europe: Lng Regasification Terminals Capex($Million), (2014-2019)
Table 56 Spain: Operational Lng Regasification Terminals With Capacity(Mtpa), 2013
Table 57 France: Operational Lng Regasifications Terminals With Capacity(Mtpa), 2013
Table 58 U.K.: Operational Lng Regasification Terminals With Capacity(Mtpa), 2013
Table 59 Italy: Operational Lng Regasifications Terminals With Capacity (Mtpa), 2013
Table 60 Other Countries: Operational Lng Regasification Terminals With Capacity(Mmtpa), 2013
Table 61 The ME & Africa: Lng Regasification Terminals Capacity(Mmtpa), By Country, (2014-2019)
Table 62 The ME & Africa: Lng Regasification Terminals Capex ($Million), (2014-2019)
Table 63 Asia-Pacific: Flng Terminals With Capacity(Mtpa), (2014-2019)
Table 64 Americas: Flng Terminals With Capacity(Mtpa), (2014-2019)
Table 65 Europe: Flng Terminals With Capacity(Mtpa), (2014-2019)
Table 66 The Middle East & Africa: Flng Terminals With Capacity
Table 67 Contract Award, 2011-2014
Table 68 Merger & Acquisitions , 2011-2014
Table 69 New Product Launch, 2011-2014
Table 70 Expansion, 2011-2014
Table 71 Joint Venture Agreement: 2011-2014
List of Figures (23 Figures)
Figure 1 Global Underground Natural Gas Storage Market: Working Gas Capacity Market Share, By Geography, 2013
Figure 2 Global Underground Natural Gas Storage Market Share, By Type,2013
Figure 3 Global Liquefaction Capacity (Mtpa) Market Share, By Geography, 2013
Figure 4 Global Liquefaction Terminals Capex Expansion, (2014-2019)
Figure 5 Global Regasification Capacity (Mtpa) Market Share, 2013
Figure 6 Companies Adopted the Contract Award As the Key Growth Strategy Over the Last Three Years
Figure 7 Battel for Natural Gas Storage Market Share:Contract Award Is the Key Strategy
Figure 8 Geographic Revenue Mix of Top Five Epc Companies of Natural Gas Storage Market
Figure 9 Worley Parsons: Business Overview
Figure 10 Worley Parsons : SWOT Analysis
Figure 11 Technip: Business Overview
Figure 12 Technip: SWOT Analysis
Figure 13 Samsung Heavy Industries: Business Overview
Figure 14 Samsung Heavy Industries: SWOT Analysis
Figure 15 Foster Wheeler: Business Overview
Figure 16 Foster Wheeler: SWOT Analysis
Figure 17 GDF Suez: Business Overview
Figure 18 GDF Suez: SWOT Analysis
Figure 19 Centrica: Business Overview
Figure 20 Chiyoda Corporation: Business Overview
Figure 21 Niska Gas Storage: Business Overview
Figure 22 E-On: Business Overview
Figure 23 Spectra Energy: Business Overview


Growth opportunities and latent adjacency in Natural Gas Storage Market