Network Telemetry Market by Component (Solution and Services), Organization Size, End User (Service Providers (Telecom Service Providers, Cloud Service Providers, and Managed Service Providers), Verticals), and Region - Global Forecast to 2024


[141 Pages Report] The global network telemetry market size is expected to grow from USD 140 million in 2019 to USD 704 million by 2024, at a Compound Annual Growth Rate (CAGR) of 38.1% during the forecast period. An increase in network attacks and security breaches and the growing need to quickly resolve downtime issues are major factors expected to drive the growth of the network telemetry market. Need to handle massive network performance data and emerging technologies, such as Internet of Things (IoT), Artificial Intelligence (AI), and Software-defined Networking (SDN) are expected to offer vast market opportunities for network telemetry vendors in the next 5 years.
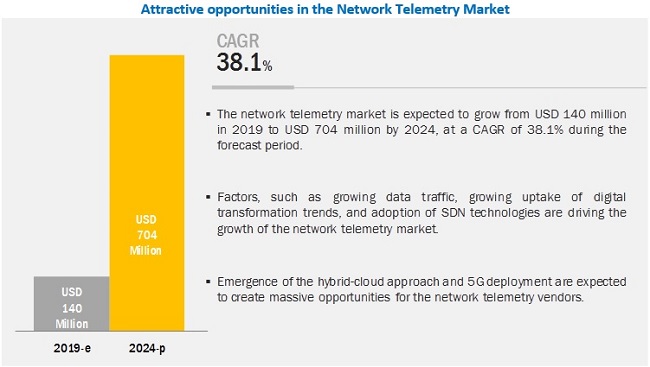
By component, the services segment is expected to account for a higher growth rate during the forecast period
By component, the services segment is expected to grow at a higher CAGR during the forecast period. This growth can be attributed to the wide adoption of network telemetry solutions across enterprises and service providers, thereby generating demand for consulting services; integration and deployment services; and training, support, and maintenance services across the globe. Services refer to the support offered by network telemetry companies to assist customers in efficiently using network telemetry solutions and maintaining them. Services aim at training and developing expertise, providing timely upgradations for the software or platform, and helping customers integrate their software or platform with other Information Technology (IT) solutions.
By end user, the service providers segment to dominate the network telemetry market during the forecast period
In the network telemetry market by end user, service providers are expected to hold a larger market size during the forecast period. There is an increasing trend of the adoption of network telemetry solutions by telecom and Cloud Service Providers (CSPs) to manage, analyze, and optimize the entire network infrastructure. Advanced network telemetry solutions can support better network capacity planning and network management features, as well as provide security against malware and Distributed Denial of Service (DDoS) attacks. Such critical factors are expected to drive the demand for network telemetry solutions among service providers.
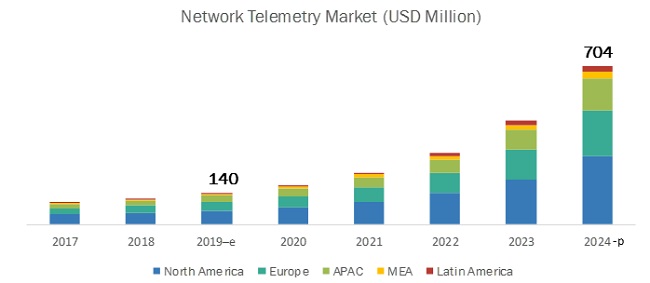
North America to account for the largest market size during the forecast period.
The global network telemetry market by region covers four major geographic regions, namely North America, Asia Pacific (APAC), Europe, MEA, and Latin America. North America is expected to grow at the largest CAGR of during the forecast period, due to the rapid adoption of advanced technologies and infrastructure helping them virtualize their IT infrastructure and facilitate advanced network management. The rapid changes in IT infrastructure, such as cloud and virtualization, have significantly increased the pressure on network administrators to manage the network infrastructure. This is expected to increase the demand for network telemetry solutions across verticals and service providers.
Key Network Telemetry Market Players
Cisco Systems (US), Juniper Networks (US), Arista Networks (US), Mellanox Technologies (US), Pluribus Networks (US), Barefoot Networks (US), Solarflare Communications (US), and VOLANSYS Technologies (US). Cisco is one the leading players in the network telemetry market. In the field of network telemetry, Cisco�s Model-Driven Telemetry enables data to stream continuously using a push model, providing real-time access to operational statistics. By modelling the data with YANG, Model-Driven Telemetry can ensure that vast quantities of data are truly usable.
Scope of the Network Telemetry Market Report
|
Report Metrics |
Details |
|
Market size available for years |
2017�2024 |
|
Base year considered |
2018 |
|
Forecast period |
2019�2024 |
|
Forecast units |
Million (USD) |
|
Segments covered |
Component ( Solutions and Services), Organization Size (Large Enterprises, Small And Medium-Sized Enterprises), End User (Service Providers and Verticals), and Region |
|
Geographies covered |
North America, Europe, APAC, MEA, and Latin America |
|
Companies covered |
Cisco Systems (US), Juniper Networks (US), Arista Networks (US), Mellanox Technologies (US), Pluribus Networks (US), Barefoot Networks (US), Solarflare Communications (US), and VOLANSYS Technologies (US). |
The research report categorizes the network telemetry market to forecast the revenues and analyze trends in each of the following subsegments:
By Component
- Solutions
- Services
- Consulting
- Integration And deployment
- Training, Support, And Maintenance
Network Telemetry Market By Organization Size
- Large Enterprises
- Small And Medium-Sized Enterprises
By End User
- Service Providers
- Telecom Service Providers (TSPs)
- Cloud Service Providers (CSPs)
- Managed Service Providers (MSPs)
- Others
- Verticals
Network Telemetry Market By Region
- North America
- Europe
- APAC
- MEA
- Latin America
Recent Developments
- In September 2019, Arista Networks announced the release of its management software, CloudVision 2019. It provides monitoring, automation, and management capabilities. Moreover, it helps businesses reduce operational costs, increase network agility, and minimize risks.
- In October 2019, Juniper Networks partnered with Telefonica, UK, to build a secured and automated cloud-enabled network infrastructure, which is known as the Fusion Network. As per the partnership, Juniper Networks is the network Internet Protocol (IP) strategic partner for Telefonica.
- In August 2019, Mellanox Technologies partnered with VMware to offer its Remote Direct Memory Access (RDMA) networking solutions to VMware for supporting its virtualized Machine Learning (ML) solutions to increase its Graphics Processing Unit (GPU) efficiency and utilization.
- In May 2019, Pluribus Networks partnered with Vapor IO to deploy its 5.0 of Netvisor ONE OS and Adaptive Cloud Fabric at multiple Vapor IO Kinetic Edge sites in Chicago, US. As per the partnership, Vapor IO would connect its multiple edge data center sites seamlessly with comprehensive telemetry, rich network services, and deep slicing across multiple data centers regardless of their geographic locations.
- In December 2018, Barefoot Networks introduced Tofino 2, the second generation of its P4-programmable Tofino Ethernet switch of the Application-Specific Integrated Circuit (ASIC) family. Tofino 2 supports Barefoot SPRINT and Barefoot Networks�, enhanced version of the industry-standard In-band Network Telemetry (INT), providing fine-grained and intelligent real-time visibility of network traffic per packet.
Critical Questions the Report Answers:
- Where will all these developments take the industry in the long term?
- What are the upcoming trends for the network telemetry market?
- Which segment provides the most opportunity for growth?
- Who are the leading vendors operating in this market?
- What are the opportunities for new market entrants?
Frequently Asked Questions (FAQ):
What is network telemetry market?
What is forecast of network telemetry market in the next five years?
Which region has the highest market share in network telemetry market?
What are the major factors that are anticipated to drive the network telemetry market?
To speak to our analyst for a discussion on the above findings, click Speak to Analyst
 Exclusive indicates content/data unique to MarketsandMarkets and not available with any competitors.
TABLE OF CONTENTS
1 INTRODUCTION (Page No. - 19)
1.1 OBJECTIVES OF THE STUDY
1.2 MARKET DEFINITION
1.2.1 INCLUSIONS AND EXCLUSIONS
1.3 MARKET SCOPE
1.3.1 MARKET SEGMENTATION
1.4 YEARS CONSIDERED FOR THE STUDY
1.5 CURRENCY CONSIDERED
1.6 STAKEHOLDERS
2 RESEARCH METHODOLOGY (Page No. - 22)
2.1 RESEARCH DATA
2.1.1 BREAKUP OF PRIMARY PROFILES
2.1.2 KEY INDUSTRY INSIGHTS
2.2 MARKET BREAKUP AND DATA TRIANGULATION
2.3 MARKET SIZE ESTIMATION
2.3.1 TOP-DOWN APPROACH
2.3.2 BOTTOM-UP APPROACH
2.4 MARKET FORECAST
2.5 COMPETITIVE LEADERSHIP MAPPING METHODOLOGY
2.6 ASSUMPTIONS FOR THE STUDY
2.7 LIMITATIONS OF THE STUDY
3 EXECUTIVE SUMMARY (Page No. - 32)
4 PREMIUM INSIGHTS (Page No. - 35)
4.1 ATTRACTIVE MARKET OPPORTUNITIES IN THE GLOBAL MARKET
4.2 NETWORK TELEMETRY MARKET, BY ORGANIZATION SIZE
4.3 MARKET IN NORTH AMERICA, BY END USER AND COUNTRY
4.4 MARKET IN EUROPE, BY END USER AND COUNTRY
4.5 MARKET IN ASIA PACIFIC, BY END USER AND COUNTRY
5 MARKET OVERVIEW AND INDUSTRY TRENDS (Page No. - 38)
5.1 INTRODUCTION
5.2 MARKET DYNAMICS
5.2.1 DRIVERS
5.2.1.1 Increase in network attacks and security breaches
5.2.1.2 Demand for optimization of network infrastructure
5.2.1.3 Need to resolve downtime issues quickly
5.2.2 RESTRAINTS
5.2.2.1 Regulatory issues
5.2.3 OPPORTUNITIES
5.2.3.1 Demand for network telemetry framework to construct a working system
5.2.3.2 Need to handle massive network performance data
5.2.3.3 Emerging technologies, such as IoT, AI, and SDN
5.2.3.4 Optimizing business operations through network telemetry solution
5.2.4 CHALLENGES
5.2.4.1 Widening skills gap
5.3 NETWORK TELEMETRY FRAMEWORK
5.4 COMPARISON WITH CONVENTIONAL NETWORK MONITORING MODES
5.5 NECESSITY OF NETWORK TELEMETRY FRAMEWORK
5.6 REGULATORY LANDSCAPE
5.6.1 HEALTH INSURANCE PORTABILITY AND ACCOUNTABILITY ACT
5.6.2 GENERAL DATA PROTECTION REGULATION
5.6.3 GRAMM�LEACH�BLILEY ACT
5.6.4 THE INTERNATIONAL ORGANIZATION FOR STANDARDIZATION STANDARD 27001
5.6.5 HEALTH LEVEL SEVEN INTERNATIONAL
5.6.6 DIGITAL IMAGING AND COMMUNICATIONS IN MEDICINE
5.7 IMPACT OF DISRUPTIVE TECHNOLOGIES
5.7.1 WI-FI 6 AND 5G
5.7.2 INTERNET OF THINGS
5.7.3 ARTIFICIAL INTELLIGENCE
6 NETWORK TELEMETRY MARKET, BY COMPONENT (Page No. - 48)
6.1 INTRODUCTION
6.2 SOLUTION
6.2.1 SOLUTION: MARKET DRIVERS
6.2.2 CORE NETWORK TELEMETRY VENDOR INITIATIVES AND DEVELOPMENTS
6.3 SERVICES
6.3.1 SERVICES: MARKET DRIVERS
6.3.2 CORE NETWORK TELEMETRY VENDOR INITIATIVES AND DEVELOPMENTS
6.3.3 CONSULTING
6.3.4 INTEGRATION AND DEPLOYMENT
6.3.5 TRAINING, SUPPORT, AND MAINTENANCE
7 NETWORK TELEMETRY MARKET, BY ORGANIZATION SIZE (Page No. - 56)
7.1 INTRODUCTION
7.2 LARGE ENTERPRISES
7.2.1 LARGE ENTERPRISES: MARKET DRIVERS
7.2.2 LARGE ENTERPRISES: CORE NETWORK TELEMETRY VENDOR INITIATIVES AND DEVELOPMENTS
7.3 SMALL AND MEDIUM-SIZED ENTERPRISES
7.3.1 SMALL AND MEDIUM-SIZED ENTERPRISES: MARKET DRIVERS
7.3.2 SMALL AND MEDIUM-SIZED ENTERPRISES: CORE NETWORK TELEMETRY VENDOR INITIATIVES AND DEVELOPMENTS
8 NETWORK TELEMETRY MARKET, BY END USER (Page No. - 61)
8.1 INTRODUCTION
8.2 SERVICE PROVIDERS
8.2.1 SERVICE PROVIDERS: MARKET DRIVERS
8.2.2 SERVICE PROVIDERS: CORE NETWORK TELEMETRY VENDOR INITIATIVES AND DEVELOPMENTS
8.2.3 TELECOM SERVICE PROVIDERS
8.2.4 CLOUD SERVICE PROVIDERS
8.2.5 MANAGED SERVICE PROVIDERS
8.2.6 OTHERS
8.3 VERTICALS
8.3.1 VERTICALS: MARKET DRIVERS
8.3.2 VERTICALS: CORE NETWORK TELEMETRY VENDOR INITIATIVES AND DEVELOPMENTS
9 NETWORK TELEMETRY MARKET, BY REGION (Page No. - 68)
9.1 INTRODUCTION
9.2 NORTH AMERICA
9.2.1 NORTH AMERICA: MARKET DRIVERS
9.2.2 NORTH AMERICA: CORE NETWORK TELEMETRY VENDOR INITIATIVES AND DEVELOPMENTS
9.2.3 UNITED STATES
9.2.4 CANADA
9.3 EUROPE
9.3.1 EUROPE: MARKET DRIVERS
9.3.2 EUROPE: CORE NETWORK TELEMETRY VENDOR INITIATIVES AND DEVELOPMENTS
9.3.3 UNITED KINGDOM
9.3.4 GERMANY
9.3.5 FRANCE
9.3.6 REST OF EUROPE
9.4 ASIA PACIFIC
9.4.1 ASIA PACIFIC: MARKET DRIVERS
9.4.2 ASIA PACIFIC: CORE NETWORK TELEMETRY VENDOR INITIATIVES AND DEVELOPMENTS
9.4.3 CHINA
9.4.4 JAPAN
9.4.5 INDIA
9.4.6 AUSTRALIA AND NEW ZEALAND
9.4.7 REST OF ASIA PACIFIC
9.5 MIDDLE EAST AND AFRICA
9.5.1 MIDDLE EAST AND AFRICA: MARKET DRIVERS
9.5.2 MIDDLE EAST AND AFRICA: CORE NETWORK TELEMETRY VENDOR INITIATIVES AND DEVELOPMENTS
9.5.3 MIDDLE EAST AND NORTH AFRICA
9.5.4 SUB-SAHARAN AFRICA
9.6 LATIN AMERICA
9.6.1 LATIN AMERICA: MARKET DRIVERS
9.6.2 LATIN AMERICA: CORE NETWORK TELEMETRY VENDOR INITIATIVES AND DEVELOPMENTS
9.6.3 BRAZIL
9.6.4 MEXICO
9.6.5 REST OF LATIN AMERICA
10 COMPETITIVE LANDSCAPE (Page No. - 109)
10.1 INTRODUCTION
10.2 COMPETITIVE LEADERSHIP MAPPING
10.2.1 VISIONARY LEADERS
10.2.2 INNOVATORS
10.2.3 DYNAMIC DIFFERENTIATORS
10.2.4 EMERGING COMPANIES
10.3 STRENGTH OF PRODUCT PORTFOLIO
10.4 BUSINESS STRATEGY EXCELLENCE
10.5 VENDOR RANKING ANALYSIS
11 COMPANY PROFILES (Page No. - 114)
11.1 INTRODUCTION
(Business Overview, Solutions Offered, Recent Developments, Organic Strategies, and SWOT Analysis)*
11.2 ARISTA NETWORKS
11.3 CISCO
11.4 JUNIPER NETWORKS
11.5 MELLANOX TECHNOLOGIES
11.6 VOLANSYS
11.7 PLURIBUS NETWORKS
11.8 BAREFOOT NETWORKS
*Details on Business Overview, Solutions Offered, Recent Developments, Organic Strategies, and SWOT Analysis might not be captured in case of unlisted companies.
11.9 SOLARFLARE COMMUNICATIONS
11.10 RIGHT-TO-WIN
12 APPENDIX (Page No. - 130)
12.1 LIST OF NETWORK MONITORING AND ANALYTICS PROVIDERS LEVERAGING NETWORK TELEMETRY
12.2 DISCUSSION GUIDE
12.3 KNOWLEDGE STORE: MARKETSANDMARKETS� SUBSCRIPTION PORTAL
12.4 AVAILABLE CUSTOMIZATIONS
12.5 RELATED REPORTS
12.6 AUTHOR DETAILS
LIST OF TABLES (107 Tables)
TABLE 1 FACTOR ANALYSIS
TABLE 2 TELEMETRY VS. CONVENTIONAL NETWORK MONITORING MODES
TABLE 3 NETWORK TELEMETRY MARKET SIZE, BY COMPONENT, 2017�2024 (USD MILLION)
TABLE 4 SOLUTION: MARKET SIZE, BY REGION, 2017�2024 (USD MILLION)
TABLE 5 SERVICES: MARKET SIZE, BY TYPE, 2017�2024 (USD MILLION)
TABLE 6 SERVICES: MARKET SIZE, BY REGION, 2017�2024 (USD MILLION)
TABLE 7 CONSULTING MARKET SIZE, BY REGION, 2017�2024 (USD MILLION)
TABLE 8 INTEGRATION AND DEPLOYMENT MARKET SIZE, BY REGION, 2017�2024 (USD MILLION)
TABLE 9 TRAINING, SUPPORT, AND MAINTENANCE SERVICES MARKET SIZE, BY REGION, 2017�2024 (USD MILLION)
TABLE 10 NETWORK TELEMETRY MARKET SIZE, BY ORGANIZATION SIZE, 2017�2024 (USD MILLION)
TABLE 11 LARGE ENTERPRISES: MARKET SIZE, BY REGION, 2017�2024 (USD MILLION)
TABLE 12 SMALL AND MEDIUM-SIZED ENTERPRISES: MARKET SIZE, BY REGION, 2017�2024 (USD MILLION)
TABLE 13 NETWORK TELEMETRY MARKET SIZE, BY END USER, 2017�2024 (USD MILLION)
TABLE 14 SERVICE PROVIDERS: MARKET SIZE, BY REGION, 2017�2024 (USD MILLION)
TABLE 15 SERVICE PROVIDERS: MARKET SIZE, BY TYPE, 2017�2024 (USD MILLION)
TABLE 16 TELECOM SERVICE PROVIDERS MARKET SIZE, BY REGION, 2017�2024 (USD MILLION)
TABLE 17 CLOUD SERVICE PROVIDERS MARKET SIZE, BY REGION, 2017�2024 (USD MILLION)
TABLE 18 MANAGED SERVICE PROVIDERS MARKET SIZE, BY REGION, 2017�2024 (USD MILLION)
TABLE 19 OTHERS MARKET SIZE, BY REGION, 2017�2024 (USD MILLION)
TABLE 20 VERTICALS: MARKET SIZE, BY REGION, 2017�2024 (USD MILLION)
TABLE 21 NETWORK TELEMETRY MARKET SIZE, BY REGION, 2017�2024 (USD MILLION)
TABLE 22 NORTH AMERICA: MARKET SIZE, BY COMPONENT, 2017�2024 (USD MILLION)
TABLE 23 NORTH AMERICA: MARKET SIZE, BY SERVICE, 2017�2024 (USD MILLION)
TABLE 24 NORTH AMERICA: MARKET SIZE, BY ORGANIZATION SIZE, 2017�2024 (USD MILLION)
TABLE 25 NORTH AMERICA: MARKET SIZE, BY END USER, 2017�2024 (USD MILLION)
TABLE 26 NORTH AMERICA: MARKET SIZE, BY SERVICE PROVIDER, 2017�2024 (USD MILLION)
TABLE 27 NORTH AMERICA: MARKET SIZE, BY COUNTRY, 2017�2024 (USD MILLION)
TABLE 28 NORTH AMERICA: SOLUTION MARKET SIZE, BY COUNTRY, 2017�2024 (USD MILLION)
TABLE 29 NORTH AMERICA: SERVICES MARKET SIZE, BY COUNTRY, 2017�2024 (USD MILLION)
TABLE 30 NORTH AMERICA: LARGE ENTERPRISES MARKET SIZE, BY COUNTRY, 2017�2024 (USD MILLION)
TABLE 31 NORTH AMERICA: SMALL AND MEDIUM-SIZED ENTERPRISES MARKET SIZE, BY COUNTRY, 2017�2024 (USD MILLION)
TABLE 32 NORTH AMERICA: SERVICE PROVIDERS MARKET SIZE, BY COUNTRY, 2017�2024 (USD MILLION)
TABLE 33 NORTH AMERICA: VERTICALS MARKET SIZE, BY COUNTRY, 2017�2024 (USD MILLION)
TABLE 34 NORTH AMERICA: TELECOM SERVICE PROVIDERS MARKET SIZE, BY COUNTRY, 2017�2024 (USD MILLION)
TABLE 35 NORTH AMERICA: MANAGED SERVICE PROVIDERS MARKET SIZE, BY COUNTRY, 2017�2024 (USD MILLION)
TABLE 36 NORTH AMERICA: CLOUD SERVICE PROVIDERS MARKET SIZE, BY COUNTRY, 2017�2024 (USD MILLION)
TABLE 37 NORTH AMERICA: OTHER SERVICE PROVIDERS MARKET SIZE, BY COUNTRY, 2017�2024 (USD MILLION)
TABLE 38 UNITED STATES: NETWORK TELEMETRY MARKET SIZE, BY COMPONENT, 2017�2024 (USD MILLION)
TABLE 39 UNITED STATES: MARKET SIZE, BY SERVICE, 2017�2024 (USD MILLION)
TABLE 40 UNITED STATES: MARKET SIZE, BY ORGANIZATION SIZE, 2017�2024 (USD MILLION)
TABLE 41 UNITED STATES: MARKET SIZE, BY END USER, 2017�2024 (USD MILLION)
TABLE 42 UNITED STATES: MARKET SIZE, BY SERVICE PROVIDER, 2017�2024 (USD MILLION)
TABLE 43 CANADA: NETWORK TELEMETRY MARKET SIZE, BY COMPONENT, 2017�2024 (USD MILLION)
TABLE 44 CANADA: MARKET SIZE, BY SERVICE, 2017�2024 (USD MILLION)
TABLE 45 CANADA: MARKET SIZE, BY ORGANIZATION SIZE, 2017�2024 (USD MILLION)
TABLE 46 CANADA: MARKET SIZE, BY END USER, 2017�2024 (USD MILLION)
TABLE 47 CANADA: MARKET SIZE, BY SERVICE PROVIDER, 2017�2024 (USD MILLION)
TABLE 48 EUROPE: NETWORK TELEMETRY MARKET SIZE, BY COMPONENT, 2017�2024 (USD MILLION)
TABLE 49 EUROPE: MARKET SIZE, BY SERVICE, 2017�2024 (USD MILLION)
TABLE 50 EUROPE: MARKET SIZE, BY ORGANIZATION SIZE, 2017�2024 (USD MILLION)
TABLE 51 EUROPE: MARKET SIZE, BY END USER, 2017�2024 (USD MILLION)
TABLE 52 EUROPE: MARKET SIZE, BY SERVICE PROVIDER, 2017�2024 (USD MILLION)
TABLE 53 EUROPE: MARKET SIZE, BY COUNTRY, 2017�2024 (USD MILLION)
TABLE 54 UNITED KINGDOM: NETWORK TELEMETRY MARKET SIZE, BY COMPONENT, 2017�2024 (USD MILLION)
TABLE 55 UNITED KINGDOM: MARKET SIZE, BY SERVICE, 2017�2024 (USD MILLION)
TABLE 56 UNITED KINGDOM: MARKET SIZE, BY ORGANIZATION SIZE, 2017�2024 (USD MILLION)
TABLE 57 UNITED KINGDOM: MARKET SIZE, BY END USER, 2017�2024 (USD MILLION)
TABLE 58 UNITED KINGDOM: MARKET SIZE, BY SERVICE PROVIDER, 2017�2024 (USD MILLION)
TABLE 59 GERMANY: NETWORK TELEMETRY MARKET SIZE, BY COMPONENT, 2017�2024 (USD MILLION)
TABLE 60 GERMANY: MARKET SIZE, BY SERVICE, 2017�2024 (USD MILLION)
TABLE 61 GERMANY: MARKET SIZE, BY ORGANIZATION SIZE, 2017�2024 (USD MILLION)
TABLE 62 GERMANY: MARKET SIZE, BY END USER, 2017�2024 (USD MILLION)
TABLE 63 GERMANY: MARKET SIZE, BY SERVICE PROVIDER, 2017�2024 (USD MILLION)
TABLE 64 ASIA PACIFIC: NETWORK TELEMETRY MARKET SIZE, BY COMPONENT, 2017�2024 (USD MILLION)
TABLE 65 ASIA PACIFIC: MARKET SIZE, BY SERVICE, 2017�2024 (USD MILLION)
TABLE 66 ASIA PACIFIC: MARKET SIZE, BY ORGANIZATION SIZE, 2017�2024 (USD MILLION)
TABLE 67 ASIA PACIFIC: MARKET SIZE, BY END USER, 2017�2024 (USD MILLION)
TABLE 68 ASIA PACIFIC: MARKET SIZE, BY SERVICE PROVIDER, 2017�2024 (USD MILLION)
TABLE 69 ASIA PACIFIC: MARKET SIZE, BY COUNTRY, 2017�2024 (USD MILLION)
TABLE 70 CHINA: NETWORK TELEMETRY MARKET SIZE, BY COMPONENT, 2017�2024 (USD MILLION)
TABLE 71 CHINA: MARKET SIZE, BY SERVICE, 2017�2024 (USD MILLION)
TABLE 72 CHINA: MARKET SIZE, BY ORGANIZATION SIZE, 2017�2024 (USD MILLION)
TABLE 73 CHINA: MARKET SIZE, BY END USER, 2017�2024 (USD MILLION)
TABLE 74 CHINA: MARKET SIZE, BY SERVICE PROVIDER, 2017�2024 (USD MILLION)
TABLE 75 JAPAN: MARKET SIZE, BY COMPONENT, 2017�2024 (USD MILLION)
TABLE 76 JAPAN: MARKET SIZE, BY SERVICE, 2017�2024 (USD MILLION)
TABLE 77 JAPAN: MARKET SIZE, BY ORGANIZATION SIZE, 2017�2024 (USD MILLION)
TABLE 78 JAPAN: MARKET SIZE, BY END USER, 2017�2024 (USD MILLION)
TABLE 79 JAPAN: MARKET SIZE, BY SERVICE PROVIDER, 2017�2024 (USD MILLION)
TABLE 80 INDIA: MARKET SIZE, BY COMPONENT, 2017�2024 (USD MILLION)
TABLE 81 INDIA: MARKET SIZE, BY SERVICE, 2017�2024 (USD MILLION)
TABLE 82 INDIA: MARKET SIZE, BY ORGANIZATION SIZE, 2017�2024 (USD MILLION)
TABLE 83 INDIA: MARKET SIZE, BY END USER, 2017�2024 (USD MILLION)
TABLE 84 INDIA: MARKET SIZE, BY SERVICE PROVIDER, 2017�2024 (USD MILLION)
TABLE 85 MIDDLE EAST AND AFRICA: NETWORK TELEMETRY MARKET SIZE, BY COMPONENT, 2017�2024 (USD MILLION)
TABLE 86 MIDDLE EAST AND AFRICA: MARKET SIZE, BY SERVICE, 2017�2024 (USD MILLION)
TABLE 87 MIDDLE EAST AND AFRICA: MARKET SIZE, BY ORGANIZATION SIZE, 2017�2024 (USD MILLION)
TABLE 88 MIDDLE EAST AND AFRICA: MARKET SIZE, BY END USER, 2017�2024 (USD MILLION)
TABLE 89 MIDDLE EAST AND AFRICA: MARKET SIZE, BY SERVICE PROVIDER, 2017�2024 (USD MILLION)
TABLE 90 MIDDLE EAST AND AFRICA: MARKET SIZE, BY SUB-REGION, 2017�2024 (USD MILLION)
TABLE 91 MIDDLE EAST AND NORTH AFRICA: MARKET SIZE, BY COMPONENT, 2017�2024 (USD MILLION)
TABLE 92 MIDDLE EAST AND NORTH AFRICA: MARKET SIZE, BY SERVICE, 2017�2024 (USD MILLION)
TABLE 93 MIDDLE EAST AND NORTH AFRICA: MARKET SIZE, BY ORGANIZATION SIZE, 2017�2024 (USD MILLION)
TABLE 94 MIDDLE EAST AND NORTH AFRICA: MARKET SIZE, BY END USER, 2017�2024 (USD MILLION)
TABLE 95 MIDDLE EAST AND NORTH AFRICA: MARKET SIZE, BY SERVICE PROVIDER, 2017�2024 (USD MILLION)
TABLE 96 LATIN AMERICA: NETWORK TELEMETRY MARKET SIZE, BY COMPONENT, 2017�2024 (USD MILLION)
TABLE 97 LATIN AMERICA: MARKET SIZE, BY SERVICE, 2017�2024 (USD MILLION)
TABLE 98 LATIN AMERICA: MARKET SIZE, BY ORGANIZATION SIZE, 2017�2024 (USD MILLION)
TABLE 99 LATIN AMERICA: MARKET SIZE, BY END USER, 2017�2024 (USD MILLION)
TABLE 100 LATIN AMERICA: MARKET SIZE, BY SERVICE PROVIDER, 2017�2024 (USD MILLION)
TABLE 101 LATIN AMERICA: MARKET SIZE, BY COUNTRY, 2017�2024 (USD MILLION)
TABLE 102 BRAZIL: NETWORK TELEMETRY MARKET SIZE, BY COMPONENT, 2017�2024 (USD MILLION)
TABLE 103 BRAZIL: MARKET SIZE, BY SERVICE, 2017�2024 (USD MILLION)
TABLE 104 BRAZIL: MARKET SIZE, BY ORGANIZATION SIZE, 2017�2024 (USD MILLION)
TABLE 105 BRAZIL: METRY MARKET SIZE, BY END USER, 2017�2024 (USD MILLION)
TABLE 106 BRAZIL: MARKET SIZE, BY SERVICE PROVIDER, 2017�2024 (USD MILLION)
TABLE 107 EVALUATION CRITERIA
LIST OF FIGURES (39 Figures)
FIGURE 1 NETWORK TELEMETRY MARKET: RESEARCH DESIGN
FIGURE 2 RESEARCH METHODOLOGY
FIGURE 3 TOP-DOWN AND BOTTOM-UP APPROACHES
FIGURE 4 COMPETITIVE LEADERSHIP MAPPING: CRITERIA WEIGHTAGE
FIGURE 5 REGIONAL SNAPSHOT
FIGURE 6 GROWTH TREND
FIGURE 7 ASIA PACIFIC TO GROW AT THE HIGHEST CAGR DURING THE FORECAST PERIOD
FIGURE 8 GROWING ADOPTION OF DIGITAL TRANSFORMATION TRENDS TO DRIVE THE NETWORK TELEMETRY MARKET DURING THE FORECAST PERIOD
FIGURE 9 LARGE ENTERPRISES SEGMENT TO HOLD A HIGHER MARKET SHARE IN THE MARKET IN 2019
FIGURE 10 VERTICALS SEGMENT AND THE US TO ACCOUNT FOR HIGHER MARKET SHARES IN NORTH AMERICA IN 2019
FIGURE 11 VERTICALS SEGMENT AND GERMANY TO ACCOUNT FOR HIGH MARKET SHARES IN EUROPE IN 2019
FIGURE 12 VERTICALS SEGMENT AND CHINA TO ACCOUNT FOR HIGH MARKET SHARES IN ASIA PACIFIC IN 2019
FIGURE 13 DRIVERS, RESTRAINTS, OPPORTUNITIES, AND CHALLENGES: NETWORK TELEMETRY MARKET
FIGURE 14 RETARGETED INCIDENTS BY REGION, 2017�2018
FIGURE 15 TOP 10 RETARGETED INDUSTRIES IN 2018
FIGURE 16 TRAITS WITH THE LARGEST SKILLS GAP
FIGURE 17 HIRING DEMAND AS PER ORGANIZATIONAL LEVEL
FIGURE 18 NETWORK TELEMETRY FRAMEWORK
FIGURE 19 COMPONENTS IN THE NETWORK TELEMETRY FRAMEWORK
FIGURE 20 SERVICES SEGMENT TO GROW AT A HIGHER CAGR DURING THE FORECAST PERIOD
FIGURE 21 INTEGRATION AND DEPLOYMENT SERVICES SEGMENT TO GROW AT THE HIGHEST CAGR DURING THE FORECAST PERIOD
FIGURE 22 SMALL AND MEDIUM-SIZED ENTERPRISES SEGMENT TO GROW AT A HIGHER CAGR DURING THE FORECAST PERIOD
FIGURE 23 VERTICALS SEGMENT TO GROW AT A HIGHER CAGR DURING THE FORECAST PERIOD
FIGURE 24 CLOUD SERVICE PROVIDERS SEGMENT TO GROW AT THE HIGHEST CAGR DURING THE FORECAST PERIOD
FIGURE 25 ASIA PACIFIC TO GROW AT THE HIGHEST CAGR DURING THE FORECAST PERIOD
FIGURE 26 NORTH AMERICA: MARKET SNAPSHOT
FIGURE 27 ASIA PACIFIC: MARKET SNAPSHOT
FIGURE 28 NETWORK TELEMETRY MARKET (GLOBAL), COMPETITIVE LEADERSHIP MAPPING, 2019
FIGURE 29 PRODUCT PORTFOLIO ANALYSIS OF TOP PLAYERS IN THE GLOBAL MARKET
FIGURE 30 BUSINESS STRATEGY EXCELLENCE OF TOP PLAYERS IN THE GLOBAL NETWORK TELEMETRY MARKET
FIGURE 31 RANKING OF KEY PLAYERS, 2019
FIGURE 32 ARISTA NETWORKS: COMPANY SNAPSHOT
FIGURE 33 ARISTA NETWORKS: SWOT ANALYSIS
FIGURE 34 CISCO: COMPANY SNAPSHOT
FIGURE 35 CISCO: SWOT ANALYSIS
FIGURE 36 JUNIPER NETWORKS: COMPANY SNAPSHOT
FIGURE 37 JUNIPER NETWORKS: SWOT ANALYSIS
FIGURE 38 MELLANOX TECHNOLOGIES: COMPANY SNAPSHOT
FIGURE 39 MELLANOX TECHNOLOGIES: SWOT ANALYSIS
The study involved 4 major activities in estimating the current market size for the network telemetry market. An exhaustive secondary research was done to collect information on the market, the peer market, and the parent market. The next step was to validate these findings, assumptions, and sizing with the industry experts across the value chain through primary research. Both top-down and bottom-up approaches were employed to estimate the total market size. After that, the market breakup and data triangulation procedures were used to estimate the market size of the segments and subsegments of the market.
Secondary Research
In the secondary research process, various secondary sources, such as D&B Hoovers, Bloomberg BusinessWeek, and Factiva, have been referred to identify and collect information for this study. These secondary sources included annual reports; press releases and investor presentations of companies; whitepapers, and articles by recognized authors; gold standard and silver standard websites; technology Research and Development (R&D) organizations; regulatory bodies; and databases.
Primary Research
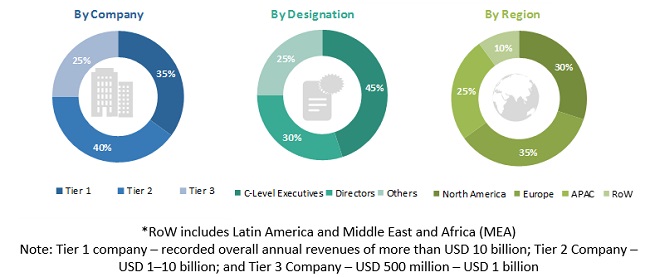
Various primary sources from both the supply and demand sides of the network telemetry market ecosystem were interviewed to obtain qualitative and quantitative information for the study. The primary sources from the supply side included industry experts, such as Chief Executive Officers (CEOs), Vice Presidents (VPs), marketing directors, technology and innovation directors, and related key executives from various vendors who provide network telemetry solutions and services operating in the targeted regions. All possible parameters that affect the market covered in this research study have been accounted for, viewed in extensive detail, verified through primary research, and analyzed to get the final quantitative and qualitative data. The following is the breakup of the primary respondents� profiles:
To know about the assumptions considered for the study, download the pdf brochure
Network Telemetry Market Size Estimation
For making market estimates and forecasting the network telemetry market and the other dependent submarkets, the top-down and bottom-up approaches were used. The bottom-up procedure was used to arrive at the overall market size of the global market using the revenues and offerings of the key companies in the market. The research methodology used to estimate the market size includes the following:
- Key players in the market were identified through extensive secondary research.
- The market size, in terms of value, was determined through primary and secondary research processes.
- All percentage shares split, and breakups were determined using secondary sources and verified through primary sources.
Data Triangulation
With data triangulation and validation through primary interviews, the exact value of the overall parent market size was determined and confirmed using this study. The global market size was then used in the top-down procedure to estimate the size of other individual markets via percentage splits of the market segmentation.
Report Objectives
- To define, describe, and forecast the global network telemetry market by component, organization size, end user, and region
- To provide detailed information related to the significant factors, such as drivers, restraints, opportunities, and challenges, influencing the growth of the market
- To analyze the market�s subsegments concerning individual growth trends, prospects, and contributions to the total market
- To analyze the opportunities in the market for stakeholders and provide the competitive landscape of the market
- To forecast the revenue of the market�s segments for four major regions, namely North America, Europe, Asia Pacific (APAC), MEA, and Latin America
- To profile the key players and comprehensively analyze their recent developments and positioning in the network telemetry market
- To analyze the competitive developments, such as mergers and acquisitions, new product developments, and R&D activities in the market
Available Customizations
With the given market data, MarketsandMarkets offers customizations as per the company�s specific requirements. The following customization options are available for the report:
Product Analysis
- Product matrix provides detailed product information and comparisons
Geographic Analysis
- Further breakup of the North American network telemetry market
- Further breakup of the European market
- Further breakup of the APAC market
- Further breakup of the MEA market
- Further breakup of the Latin American market
Company Information
- Detailed analysis and profiles of additional market players


Growth opportunities and latent adjacency in Network Telemetry Market