North America Weight Loss /Obesity Management Market � [Meal Replacements, Slimming Centers, Nutrition & Psychological Consultancy, Treadmill, Ellipticals, Strength Training, Gastric Bypass, Intragastric Balloon System, StomaphyX] � Forecasts to 2017


Obesity and weight gain have always been major concerns regarding the health and fitness of individuals; today, it has reached the level of an epidemic. Increasing obesity rate and increasing levels of awareness amongst calorie-conscious consumers in North America have opened new avenues for the weight management industry. The North American weight loss/obesity management market was worth $104 billion in 2012.
The North America weight loss management market witnesses a growing preference for low-calorie diet food and beverages and slimmer waters/natural mineral salt drinks. With the introduction of technologically advanced and highly sophisticated fitness equipment, the use of cardiovascular and strength training equipment is on a rise. However, factors like availability of low-cost alternatives, adoption of deceptive marketing strategies, and high cost of customized services are hindering growth.
Quick results of weight loss surgeries and insurance coverage have made bariatric surgeries popular among clinically obese people. However, the side-effects of weight loss surgeries have made people opt for non-invasive and non-medical methods of weight loss. As per the American Society for Metabolic & Bariatric Surgery, the total number of weight loss surgeries performed in the U.S. was 220,000 in 2012, likely to increase in the coming years due to the rising obesity rate. In Canadian hospitals, a total of 2,385 bariatric procedures were carried out in 2008�2009; it represented a 92% increase from 2004�2005.
The North America region is covered in this study and further segmented by major countries - U.S. and Canada. The geographic split for all the sub-segments is presented at a regional and country level. The U.S. is the largest market for weight loss/obesity management market, followed by Canada.
Atkins Nutritionals, Inc. (U.S.), Weight Watchers International, Inc. (U.S.), NutriSystem, Inc. (U.S.), Herbalife International, Inc. (U.S.), The Coca Cola Company (U.S.), and PepsiCo, Inc. (U.S.), Brunswick Corporation (U.S.), Precor, Inc. (U.S.), Ethicon Endo-surgery, Inc. (U.S.), Cynosure, Inc. (U.S.), Allergan, Inc. (U.S.), Equinox, Inc. (U.S.), Gold�s Gym International, Inc. (U.S.), eDiets.com (U.S.) are the leading players in the North American weight management market.
Scope of the Report
This research report categorizes the North America weight loss management market and obesity management market into weight loss diets, fitness and surgical equipment, and services. These markets are broken down into segments and sub-segments, providing exhaustive value analysis for 2010, 2011 and 2012, as well as forecast up to 2017. Each of the market is comprehensively analyzed at a granular level by geography (U.S. and Canada) to provide in-depth information on the North American scenario.
Customer Interested in this report also can view
-
Weight Loss/Obesity Management Market � [Meal Replacements, Slimming Centers, Nutrition & Psychological Consultancy, Treadmill, Ellipticals, Strength Training, Gastric Bypass, Intragastric Balloon System, Stomaphyx] - Global Forecasts To 2017
The North America weight loss Management market and obesity management market was worth $104 billion in the year 2012. The U.S. is the fastest-growing market due to the increasing obesity rate, rising awareness of health and fitness, aggressive marketing strategies to attract customers, and rise in number of diabetic patients. However, the economic slowdown, and high competition in North America will hinder the growth of the market.
In 2012, the Organization for Economic Co-operation and Development (OECD) reported that the U.S. was the most obese country among developed countries; 36% of its population was obese. The U.S. accounted for the largest share of the North America weight management market in 2012. This is attributed to technological developments, new product launches, and the presence of more industry players compared to other developing regions.
The weight management industry in North America is flooded with technological advancements and innovations, especially in the weight loss fitness and surgical equipment market. In August 2012, ProForm launched ProForm launched ProForm 505 CST Treadmill, installed with iFit technology that offers live online trainers and workouts powered by Google Maps. Technological developments have also taken place in weight loss surgical procedures. Minimally-invasive and non-invasive surgical procedures that use highly sophisticated equipment like endoscopes and laparoscopes have been developed. In addition, non-invasive weight loss techniques like cryolipolysis, transoral obesity revision surgery, cold laser shaping, and Stomaphyx are also gaining popularity.
North America Weight Loss Management Market and Obesity Management Market, By Segment, 2010 - 2017 ($Million
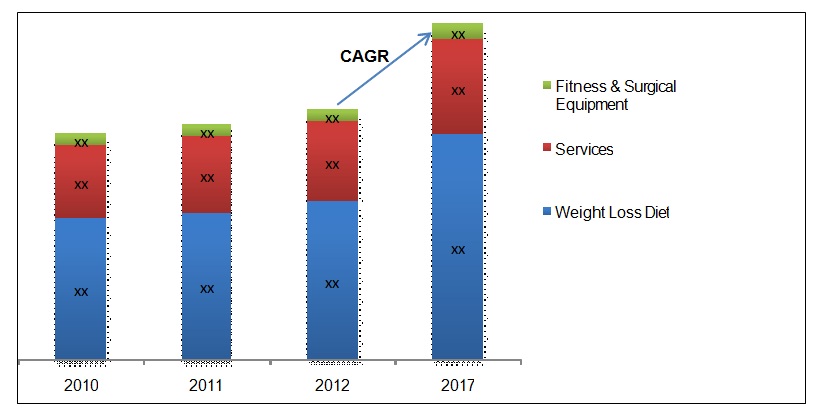
Source: Annual Reports, SEC Filings, Nutrition Business Journal, The International Health, Racquet &Sportsclub Association (IHRSA), Organic Trade Association, International Dairy Food Association, The Tea Association of USA, The American Beverage Association (ABA), National Confectioners Association, Expert Interviews, and MnM Analysis
 Exclusive indicates content/data unique to MarketsandMarkets and not available with any competitors.
Table of Contents
1 Introduction (Page No. - 22)
1.1 Key Take-Aways
1.2 Report Description
1.3 Markets Covered
1.4 Stake Holders
1.5 Research Methodology
1.5.1 Market Size
1.5.2 Key Data Points From Secondary Sources
1.5.3 Assumptions
2 Executive Summary (Page No. - 28)
3 Market Overview (Page No. - 32)
3.1 Introduction
3.2 Market Segmentation
3.3 Market Dynamics
3.3.1 Drivers
3.3.1.1 Growing Obese Population In North America Driving Market Growth
3.3.1.2 Lifestyle Changes Increasing Diabetes And Heart Diseases
3.3.1.3 Increasing Innovations & Technological Advancement Attracting More Number Of Customers
3.3.1.4 Government Initiatives To Increase Awareness About Health And Fitness
3.3.2 Restraints
3.3.2.1 Availability Of Low Cost Alternatives To Hinder The Market Growth
3.3.2.2 Unethical Marketing Strategies Are Limiting Market Growth
3.3.2.3 High Cost Of Customization
3.3.3 Opportunities
3.3.3.1 Increasing Rate Of Childhood Obesity
3.4 Winning Imperatives
3.4.1 Product Modification
3.4.2 Weight Watchers Strategy To Provide Online Programs
3.5 Market Share Analysis
4 North America Weight Loss Diet Market: Food, Beverages And Supplements (Page No. - 45)
4.1 Introduction
4.2 Market Dynamics
4.2.1 Drivers
4.2.1.1 Increasing Consumer Awareness For Diet Food To Fuel Growth
4.2.1.2 Aggressive Marketing Strategies To Attract Customers
4.2.1.3 Low-Calorie Diet Leads To Effortless Weight Loss
4.2.1.4 Rise In Number Of Diabetic Patients
4.2.2 Restraints
4.2.2.1 Taste Of Diet Food And Beverages Limits Growth
4.2.2.2 Fear Of Ingredients Blocking The Growth Of The Market
4.2.2.3 High Prices Of Diet Food And Beverages
4.3 Weight Loss Food
4.3.1 Meal Replacement
4.3.2 Low-Calorie Ready Meals
4.3.3 Sugar-Free Confectionaries
4.3.4 Low-Calorie Desserts
4.3.5 Organic Food
4.4 Weight Loss Beverages
4.4.1 Low-Calorie Beverages
4.4.2 Herbal/Green Tea
4.4.3 Slimming Water/Natural Mineral Salt Drinks
4.4.4 Other Low-Calorie Beverages
4.5 Weight Loss Supplements
4.5.1 Protein
4.5.2 Fiber
4.5.3 Green Tea Extract
4.5.4 Conjugated Linoleic Acid (CLA)
5 North America Weight Loss Fitness & Surgical Equipment Market (Page No. - 78)
5.1 Introduction
5.2 Market Dynamics
5.2.1 Drivers
5.2.1.1 Increase In The Number Of Bariatric Surgeries Is Stimulating Market Growth
5.2.1.2 Technological Advancements Increasing Compliance Rate
5.2.1.3 Increasing Number Of Health Clubs And Membership Across The North America To Boost The Growth
5.2.1.4 Aggressive Marketing Strategies Attracting Consumers
5.2.2 Restraints
5.2.2.1 Side-Effects Of Surgeries Inhibiting The Growth Of Surgical Equipment Market
5.2.2.2 Reimbursement Concerns
5.3 Fitness Equipment
5.3.1 Cardiovascular Training Equipment
5.3.1.1 Treadmill
5.3.1.2 Elliptical Trainer
5.3.1.3 Stationary Cycles
5.3.1.4 Rowing Machines
5.3.1.5 Stair Steppers
5.3.1.6 Others
5.3.2 Strength Training Equipment
5.3.3 Body Composition Analyzers
5.3.4 Fitness Monitoring Equipment
5.4 Surgical Equipment
5.4.1 Minimallyinvasive Surgical Equipment
5.4.1.1 Bariatric Surgery
5.4.1.1.1 Gastric Bypass Surgery
5.4.1.1.2 Laparoscopic Sleeve Gastrectomy
5.4.1.1.3 Laparoscopic Adjustable Gastric Banding Surgery
5.4.1.1.4 Biliopancreatic Diversion Surgery
5.4.1.2 Liposuction
5.4.1.2.1 External Ultrasound Assisted Liposuction
5.4.1.2.2 Power Assisted Liposuction
5.4.1.2.3 Water Assisted Liposuction
5.4.1.2.4 Suction Assisted Liposuction
5.4.1.2.5 Twin Cannula Assisted Liposuction
5.4.2 Non-Invasive Surgical Equipment
5.4.2.1 Intragastric Balloon System
5.4.2.2 StomaphyX
5.4.2.3 Cold Laser Shaping
5.4.2.4 Cryolipolysis
6 Weight Loss Services Market (Page No. - 126)
6.1 Introduction
6.2 Market Dynamics
6.2.1 Drivers
6.2.1.1 Government Initiatives To Increase Awareness About Health And Fitness
6.2.1.2 Media Hype Influences Consumers Towards Healthy Lifestyle
6.2.1.3 Personalized Approach To Weight Loss Attract Customers
6.2.2 Restraints
6.2.2.1 Deceptive Marketing Strategies To Hinder Growth Of The Market
6.3 Fitness Centres
6.4 Slimming Centers
6.5 Diet, Nutrition, & Psychological Consulting Services
7 Geographic Analysis (Page No. - 137)
7.1 Introduction
7.2 U.S.
7.3 Canada
8 Competitive Landscape (Page No. - 168)
8.1 Introduction
8.2 New Product Launch
8.3 Agreements, Partnerships, Collaborations & Joint Ventures
8.4 Mergers & Acquisitions
8.5 Other Developments
9 Company Profiles (Overview, Financials, Products & Services, Strategy, & Developments)* (Page No. - 189)
9.1 Ajinomoto Co., Inc.
9.2 Allergan, Inc.
9.3 Amer Sports Corporation
9.4 Atkins Nutritionals, Inc.
9.5 Brunswick Corporation
9.6 Cynosure, Inc.
9.7 Ediets.Com
9.8 Equinox
9.9 Fitness First Group, Ltd.
9.10 Gold's Gym International, Inc.
9.11 Herbalife, Ltd.
9.12 Icon Health & Fitness, Inc.
9.13 Johnson Health Tech. Co., Ltd.
9.14 Johnson & Johnson
9.15 Life Time Fitness, Inc.
9.16 Lifecore Fitness
9.17 Nestle Sa
9.18 Nutrisystem, Inc.
9.19 Olympus Corporation
9.20 Pepsico, Inc.
9.21 The Coca-Cola Co.
9.22 Weight Watchers International, Inc.
*Details On Financials, Product & Services, Strategy, & Developments Might Not Be Captured In Case Of Unlisted Companies.
List of Tables (123 Tables)
Table 1 North America Weight Loss Management Market and Obesity Management Market, By Segment, 2012 � 2017 ($Million) 29
Table 2 Bmi Classification
Table 3 North America Weight Loss Diet: Food, Beverages And Supplements Market, By Type, 2010 � 2017 ($Million)
Table 4 North America Weight Loss Diet: Food, Beverages, And Supplements Market, By Geography, 2010 � 2017 ($Million)
Table 5 North America Weight Loss Foods Market, By Type, 2010 � 2017 ($Million) 54
Table 6 North America Weight Loss Foods Market, By Geography, 2010 � 2017 ($Million)
Table 7 Meal Replacements Market, By Geography, 2010 � 2017 ($)
Table 8 Low-Calorie Ready Meals Market, By Geography, 2010 � 2017 ($Million) 58
Table 9 Sugar-Free Confectionaries Market, By Geogography, 2010 � 2017 ($Million) 59
Table 10 Low-Calorie Desserts Market, By Geography, 2010 � 2017 ($Million) 60
Table 11 Organic Food Market, By Geography, 2010 � 2017 ($Million)
Table 12 North America Weight Loss Beverages Market, By Type, 2010 � 2017 ($Million) 64
Table 13 North America Weight Loss Beverages Market, By Geography, 2010 � 2017 ($Million) 65
Table 14 Low-Calorie Beverages Market, By Geography, 2010 � 2017 ($Million) 66
Table 15 Herbal/Green Tea Market, By Geography, 2010 � 2017 ($Million) 67
Table 16 Slimming Water/Natural Mineral Salt Drinks Market, By Geography, 2010 � 2017 ($Million) 68
Table 17 Other Low Calorie Beverages Market, By Geography, 2010 � 2017 ($Million) 69
Table 18 North America Weight Loss Supplements Market, By Type, 2010 � 2017 ($Million)
Table 19 North America Weight Loss Supplements Market, By Geography, 2010 � 2017 ($Million) 72
Table 20 Protein Supplement Market, By Geography, 2010 � 2017 ($Million) 73
Table 21 Fiber Supplement Market, By Geography, 2010 � 2017 ($Million)
Table 22 Green Tea Extract Supplement Market, By Geography, 2010 � 2017 ($Million) 76
Table 23 Conjugated Linoleic Acid Supplement Market, By Geography, 2010 � 2017 ($Million)
Table 24 North America Weight Loss Fitness & Surgical Equipment Market, By Type, 2010 � 2017 ($Million)
Table 25 North America Weight Loss Fitness & Surgical Equipment Market, By Geography, 2010 � 2017 ($Million)
Table 26 North America Fitness Equipment Market, By Type, 2010 � 2017 ($Million) 87
Table 27 Fitness Equipment Market, By Geography, 2010 � 2017 ($Million) 88
Table 28 North American Cardiovascular Training Equipment Market, By Type, 2010 � 2017 ($Million)
Table 29 North American Cardiovascular Training Equipment Market, By Geography, 2010 � 2017 ($Million)
Table 30 North American Treadmill Market, By Geography, 2010 � 2017 ($Million) 92
Table 31 North American Elliptical Trainer Market, By Geography, 2010 � 2017 ($Million)
Table 32 North American Stationary Cycles Market, By Geography, 2010 � 2017 ($Million)
Table 33 North American Rowing Machines Market, By Geography, 2010 � 2017 ($Million) 96
Table 34 North American Stair Steppers Market, By Geography, 2010 � 2017 ($Million) 97
Table 35 North American Other Fitness Equipment Market, By Geography, 2010 � 2017 ($Million) 98
Table 36 North American Strength Training Equipment Market, By Geography, 2010 � 2017 ($Million) 99
Table 37 North American Body Composition Analyzer Market, By Geography, 2010 � 2017 ($Million) 100
Table 38 North American Fitness Training Equipment Market, By Geography, 2010 � 2017 ($Million) 102
Table 39 North American Weight Loss Surgical Equipment Market, By Type, 2010 � 2017 ($Million) 104
Table 40 North American Weight Loss Surgical Equipment Market, By Geography, 2010 � 2017 ($Million) 105
Table 41 North American Minimally Invasive Surgical Equipment Market, By Type Of Surgery, 2010 � 2017 ($Million)
Table 42 North American Minimally Invasive Surgical Equipment Market, By Geography, 2010 � 2017 ($Million)
Table 43 North American Bariatric Surgical Equipment Market, By Technique, 2010 � 2017 ($Million) 109
Table 44 Bariatric Surgical Equipment Market, By Geography, 2010 � 2017 ($Million) 110
Table 45 North American Gastric Bypass Surgical Equipment Market, By Geography, 2010 � 2017 ($Million)
Table 46 North American Laparoscopic Sleeve Gastrectomy Equipment Market, By Geography, 2012 � 2017 ($Million)
Table 47 North American Laparoscopic Adjustable Gastric Banding Surgical Equipment Market, By Geography, 2010 � 2017 ($Million) 113
Table 48 North American Biliopancreatic Diversion Surgical Equipment Market, By Geography, 2010 � 2017 ($Million)
Table 49 North American Liposuction Equipment Market, By Technique, 2010 � 2017 ($Million)
Table 50 North American Liposuction Equipment Market, By Geography, 2010 � 2017 ($Million)
Table 51 North American Non-Invasive Surgical Equipment Market, By Technique, 2010 � 2017 ($Million) 120
Table 52 North American Non-Invasive Surgical Equipment Market, By Geography, 2010 � 2017 ($Million) 121
Table 53 Intragastric Balloon Equipment Market, By Geography, 2010 � 2017 ($Million) 122
Table 54 North American Stomaphyx Equipment Market, By Geography, 2010 � 2017 ($Million)
Table 55 Cold Laser Shaping Equipment Market, By Geography, 2010 � 2017 ($Million) 124
Table 56 North American Cryolipolysis Equipment Market, By Geography, 2010 � 2017 ($Million) 125
Table 57 North American Weight Loss Services Market, By Type, 2010 � 2017 ($Million) 128
Table 58 North American Weight Loss Services Market, By Geography, 2010 � 2017 ($Million)
Table 59 Fitness Centers Market, By Geography, 2010 � 2017 ($Million)
Table 60 North American Slimming Centers Market, By Geography, 2010 � 2017 ($Million) 134
Table 61 Diet & Nutrition Consulting Services Market, By Geography, 2010-2017 ($Million)
Table 62 North America: Weight Loss Management Market and Obesity Management Market, By Product & Service, 2010 � 2017 ($Million) 139
Table 63 North America: Weight Loss Management and Obesity Management Diet Market, By Product, 2010 � 2017 ($Million)
Table 64 North America: Weight Loss Management and Obesity Management Services Market, By Service, 2010 � 2017 ($Million)
Table 65 North America: Weight Loss Management and Obesity Management Equipment Market, By Products, 2010 � 2017 ($Million)
Table 66 North America: Weight Loss Management Market and Obesity Management Market, By Geography, 2010 � 2017 ($Million) 142
Table 67 U.S.: Weight Loss/Obesity Management Market, By Products & Services, 2010 � 2017 ($Million)
Table 68 U.S.: Weight Loss/Obesity Management Diet Market, By Product, 2010 � 2017 ($Million) 146
Table 69 U.S.: Weight Loss/Obesity Management Diet Market, By Product, 2010 � 2017 ($Million) 147
Table 70 U.S.: Weight Loss/Obesity Management Food Market, By Segment, 2010 � 2017 ($Million) 148
Table 71 U.S.: Weight Loss/Obesity Management Beverage Market, By Segment, 2010 � 2017 ($Million) 149
Table 72 U.S.: Weight Loss/Obesity Management Supplement Market, By Segment, 2010 � 2017 ($Million) 150
Table 73 U.S.: Weight Loss/Obesity Management Services Market, By Services, 2010 � 2017 ($Million) 151
Table 74 U.S.: Weight Loss/Obesity Management Equipment Market, By Segment, 2010 � 2017 ($Million) 152
Table 75 U.S.: Weight Loss/Obesity Management Fitness Equipment Market, By Segments, 2010 � 2017 ($Million)
Table 76 U.S.: Weight Loss/Obesity Management Surgical Equipment Market, By Segment, 2010 � 2017 ($Million)
Table 77 U.S.: Weight Loss/Obesity Management Minimally Invasive Surgical Equipment Market, By Segments, 2010 � 2017 ($Million) 154
Table 78 U.S.: Weight Loss/Obesity Management Non Invasive Surgical Equipment Market, By Segment, 2010 � 2017 ($Million)
Table 79 Canada: Weight Loss/Obesity Management Market, By Products & Services, 2010 � 2017 ($Million) 158
Table 80 Canada: Weight Loss/Obesity Management Diet Market, By Product, 2010 � 2017 ($Million) 159
Table 81 Canada: Weight Loss/Obesity Management Food Market, By Segment, 2010 � 2017 ($Million) 160
Table 82 Canada: Weight Loss/Obesity Management Beverage Market, By Segment, 2010 � 2017 ($Million)
Table 83 Canada: Weight Loss/Obesity Management Supplement Market, By Segment, 2010 � 2017 ($Million)
Table 84 Canada: Weight Loss/Obesity Management Services Market, By Services, 2010 � 2017 ($Million)
Table 85 Canada: Weight Loss/Obesity Management Equipment Market, By Products, 2010 � 2017 ($Million)
Table 86 Canada: Weight Loss/Obesity Management Fitness Equipment Market, By Segments, 2010 � 2017 ($Million)
Table 87 Canada: Weight Loss/Obesity Management Surgical Equipment Market, By Segment, 2010 � 2017 ($Million)
Table 88 Canada: Weight Loss/Obesity Management Minimally Invasive Surgical Equipment Market, By Segment,2010 � 2017 ($Million) 166
Table 89 Canada: Weight Loss/Obesity Management Non Invasive Surgical Equipment Market, By Segment, 2010 � 2017 ($Million) 167
Table 90 New Product Launch, 2011 � 2013
Table 91 Agreements, Partnerships, Collaborations & Joint Ventures, 2011 � 2013
Table 92 Mergers & Acquisitions, 2011 � 2013
Table 93 Other Developments, 2011 � 2013
Table 94 Ajinomoto Co., Inc.: Total Revenue And R&D Expenditure, 2010 � 2012 ($Million) 190
Table 95 Allergan, Inc: Total Revenue And R&D Expenses, 2010 � 2012 ($Million) 194
Table 96 Allergan, Inc.: Total Revenue, By Segment, 2010 � 2012 ($Million) 194
Table 97 Amer Sports Corporation: Total Revenue And R&D Expenditure, 2010 � 2012 ($Million)
Table 98 Amer Sports Corporation: Total Revenue, By Segment, 2010 � 2012 ($Million) 197
Table 99 Amer Sports Corporation: Total Revenue, By Geography, 2010 � 2012 ($Million) 198
Table 100 Brunswick Corporation: Total Revenue And R&D Expenditure, 2010 � 2012 ($Million)
Table 101 Brunswick Corporation: Total Revenue, By Segment, 2010 � 2012 ($Million) 209
Table 102 Brunswick Corporation: Total Revenue, By Geography, 2010 � 2012 ($Million) 210
Table 103 Cynosure, Inc.: Total Revenue And R&D Expenses, 2010 � 2012 ($Million) 216
Table 104 Cynosure, Inc.: Total Revenue, By Segment, 2010 � 2012 ($Million) 216
Table 105 Cynosure, Inc.: Total Revenue, By Geography, 2010 � 2012 ($Million) 217
Table 106 Ediets.Com: Total Revenue And R&D Expenditure, 2009 � 2011 ($Million) 221
Table 107 Ediets.Com: Total Revenue, By Segment, 2009 � 2011 ($Million)
Table 108 Ediets.Com: Total Revenue, By Geography, 2009 � 2011 ($Million) 222
Table 109 Herbalife, Ltd.: Total Revenue, By Segment, 2010 � 2012 ($Million) 233
Table 110 Herbalife, Ltd.: Total Revenue, By Geography, 2010 � 2012 ($Million) 233
Table 111 Johnson & Johnson: Total Revenue And R&D Expenditure, 2010 � 2012 ($Million) 246
Table 112 Johnson & Johnson: Total Revenue, By Segment, 2010 � 2012 ($Million) 246
Table 113 Johnson & Johnson: Total Revenue, By Geography, 2010 � 2012 ($Million) 247
Table 114 Nestle Sa: Total Revenue And R&D Expenditure, 2010 � 2012 ($Million) 258
Table 115 Nestle Sa: Total Revenue, By Segment, 2010 � 2012 ($Million)
Table 116 Olympus Corporation: Total Revenue And R&D Expenses, 2010 � 2012 ($Million) 266
Table 117 Olympus Corporation: Total Revenue, By Segment, 2010 � 2012 ($Million) 266
Table 118 Olympus Corporation: Total Revenue, By Geography, 2010 � 2012 ($Million) 267
Table 119 Pepsico, Inc.: Total Revenue And R&D Expenditure, 2009 � 2011 ($Million) 271
Table 120 Pepsico, Inc.: Total Revenue, By Segment, 2009 � 2011 ($Million) 272
Table 121 Pepsico, Inc.: Total Revenue, By Geography, 2009 � 2011 ($Million) 272
Table 122 Weight Watchers International, Inc.: Total Revenue, By Segment, 2010 � 2012 ($Million) 281
Table 123 Weight Watchers International, Inc.: Total Revenue, By Geography, 2010 � 2012 ($Million) 281
List Of Figures (17 Figures)
Figure 1 North American Weight Loss Management Market and Obesity Management Product & Service Market, 2010 � 2017 ($Million)
Figure 2 North American Weight Loss Management Market and Obesity Management Market, By Type 35
Figure 3 Market Dynamics
Figure 4 North American Weight Loss Diet: Food, Beverages & Supplements Market, By Type
Figure 5 North American Weight Loss Food Market, By Type
Figure 6 North American Weight Loss Beverages Market, By Type
Figure 7 North American Weight Loss Supplements Market, By Type
Figure 8 North American Weight Loss Fitness And Surgical Equipment Market, By Type
Figure 9 North American Fitness Equipment Market, By Type
Figure 10 North American Cardiovascular Training Equipment Market, By Type
Figure 11 North American Weight Loss Surgical Equipment Market, By Type 103
Figure 12 North American Minimally Invasive Surgical Equipment Market, By Type Of Surgery
Figure 13 North American Bariatric Surgical Equipment Market, By Technique 108
Figure 14 North American Liposuction Equipment Market, By Technique
Figure 15 Non-Invasive Surgical Equipment Market, By Technique
Figure 16 North American Weight Loss Services Market, By Type
Figure 17 Key Growth Strategies, 2011 � 2013

 Generating Response ...


Growth opportunities and latent adjacency in North America Weight Loss /Obesity Management Market