Oil Country Tubular Goods Market by Grade (API, Premium), by Product (Seamless, ERW), & by Geography (North America, South America, Europe, Asia-Pacific, Africa, and Middle East) - Global Trends & Forecast to 2019


[362 Pages Report] Oil Country Tubular Goods are critical components in the production of oil and gas from the reservoir. The appropriate selection of OCTG can reduce the chances of any hazard, minimize risk, and also save cost.
The demand in the oil country tubular goods market is driven by high exploration and production activities, growth in the proven shale reserves, and escalating investments from the oil and gas operators. The trend is set to continue with the current surge in offshore activities and shale reserve exploratory activities. The global OCTG market is thereby expected to grow to approximately $59 billion by 2019, at a CAGR of more than 7% from 2014 to 2019.
Geographically, Asia-Pacific and North America are the largest markets that grew rapidly in the past decade. These regions are likely to continue to dominate in future. China and U.S. are the prime dominating countries and will drive the oil country tubular goods market. The South-American market will witness the highest growth rate; Europe and Africa will also develop with a decent CAGR.
The report analyzes and classifies the market by grade, product type, and geography. The market, split by grade, includes premium and API. The product types are categorized under premium and ERW (Electric Resistance Welding), the market split by geography includes North America, South America, Asia-Pacific, and the Middle East & Africa.
In order to provide a deeper understanding of the competitive landscape, this report includes profiles of some major oil country tubular goods manufacturers such as Tenaris (Luxembourg), Vallourec (France), TMK group (Russia), United States Steel Corporation (U.S.), and Nippon Steel and Sumitomo Metal Corporation (Japan). The top three players that include the above accounted for more than 71% of the market in 2012, by revenue.
The market share analysis, by revenue, of the top companies is also included in the report. The scope accordingly aids the market participants identify high growth markets and helps manage key investment decisions. For this study, the major players in the oil country tubular goods market are identified through secondary and primary research activities. The market share analysis of these key players is arrived at, based on key facts, annual financial information, and interviews with key opinion leaders such as CEOs, directors, and marketing executives.
Oil Country Tubular Goods market is witnessing a high growth due to increase in the number of exploration and development activities in all the countries across the world. The production of oil and gas requires various kind of OCTG, by product � Seamless and ERW, and by grade � API and Premium.
The OCTG market is estimated to reach about $59 billion by 2019, signifying a firm growth rate of over 7.2% from 2014 to 2019.
The figure below discusses the Oil Country Tubular Goods market share, based on regions, as of 2013.
Oil Country Tubular Goods: Market Share (Value), by Geography, 2013
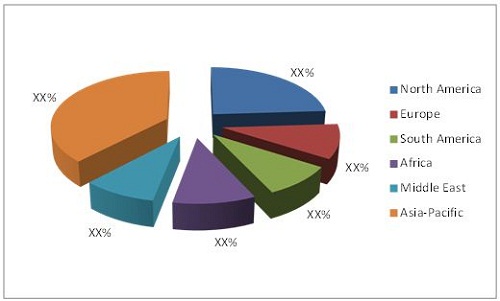
Source: MarketsandMarkets Analysis
Development is a prime concern in countries all across the world and to develop one requires energy. The increase in demand for energy is leading to the increase in oil and gas prices, which is resulting in an increase in exploration and development activities and furthermore catalyzing the demand for OCTG. The major trends which trigger the growth in the OCTG market are increased global rig counts, increased exploration and production activities, rise in unconventional reserves, and growing horizontal and directional drilling.
Geographically, the market has been studied for different regions such as Asia-Pacific, Europe, the Middle East, Africa, North America, and South America. The value of the Oil Country Tubular Goods Market is analyzed in detail for all the major countries. The study covers different strategies such as contract agreements, equipment supply, mergers & acquisition, geographical expansions, and others. Tenaris (Luxembourg), Vallourec (France), TMK group (Russia), United States Steel Corporation (U.S.), Nippon Steel and Sumitomo Metal Corporation (Japan), and National Oilwell Varco (NOV) are the dominant market leaders that provide OCTG.
 Exclusive indicates content/data unique to MarketsandMarkets and not available with any competitors.
Table Of Contents
1 Introduction (Page No. - 27)
1.1 Key Takeaways
1.2 Analyst Insights
1.3 Report Description
1.4 Market Definitions
1.5 Stakeholders
1.6 Research Methodology
1.6.1 Approach
1.6.2 Market Size Estimation
1.6.3 Market Breakdown & Data Triangulation
1.6.4 Key Points Taken From Secondary Sources
1.6.5 Key Secondary Sources Used
1.6.6 Key Points Taken From Primary Sources
1.6.7 Assumptions Made For This Report
2 Executive Summary (Page No. - 41)
3 Premium Insights (Page No. - 44)
3.1 Current Market and Growth Analysis
3.2 Increased Well Exploration Activity to Drive the Market
3.3 Market Share Scenario
3.4 Premium Grade Market Expected to See Lucarative Growth
3.5 Regional Market Life Cycle
4 Market Overview (Page No. - 55)
4.1 Introduction
4.2 Market Segmentation
4.2.1 By Grade
4.2.2 By Type
4.2.3 By Geography
4.3 Value Chain Analysis
4.3.1 Equipment Manufacturer
4.3.2 Service Providers
4.3.3 Oil Field Operators
4.4 Market Dynamics
4.4.1 Oil Country Tubular Goods Market Drivers
4.4.1.1 Shale Revolution
4.4.1.2 Rising Number of Deep Water Wells
4.4.1.3 Growth in Trend of Horizontal Drilling in Unconventional Reserves
4.4.2 Market Restraints
4.4.2.1 Risk Associated With the Cyclical Nature of the Tube Market
4.4.2.2 Risks Linked to Raw Materials and Energy-
4.4.3 Opportunities
4.4.3.1 increased Drilling Activities in Onshore and offshore
4.4.4 Winning Imperatives
4.4.4.1 Focus On Unconventional Reserves
4.4.5 Burning Issues
4.4.5.1 High Risk Business and Lack of Technical Professionals
4.5 Porter�s Five Forces Model
4.5.1 Threat of Substitutes
4.5.2 Threat of New Entrants
4.5.3 Bargaining Power of Buyers
4.5.4 Bargaining Power of Suppliers
4.5.5 Industry Rivalry
5 Oil Country Tubular Goods Market, By Geography (Page No. - 80)
5.1 Introduction
5.1.1 OCTG Market Volume, By Geography
5.1.2 OCTG Market Value, By Geography
5.2 Africa
5.2.1 Africa OCTG Market Analysis
5.2.1.1 Africa OCTG Market Volume, By Country
5.2.1.2 Africa OCTG Market Value, By Country
5.3 Asia-Pacific
5.3.1 Asia-Pacific Market Analysis
5.3.1.1 Asia-Pacific OCTG Market Volume, By Country
5.3.1.2 Asia-Pacific Market Value, By Country
5.4 Europe
5.4.1 Eupore OCTG Market Analysis
5.4.1.1 Europe OCTG Market Volume, By Country
5.4.1.2 Europe OCTG Market Value, By Country
5.5 Middle East
5.5.1 Middle East OCTG Market Analysis
5.5.1.1 Middle East OCTG Market Volume, By Country
5.5.1.2 Middle East OCTG Market Value, By Country
5.6 North America
5.6.1 North America Market Analysis
5.6.1.1 North America OCTG Market Volume, By Country
5.6.1.2 North America OCTG Market Value, By Country
5.7 South America
5.7.1 South America OCTG Market Analysis
5.7.1.1 South America OCTG Market Volume, By Country
5.7.1.2 South America OCTG Market Value, By Country
6 Oil Country Tubular Goods, By Product (Page No. - 113)
6.1 Introduction
6.2 Global Oil Country Tubular Goods Market Share, By Product
6.2.1 Global OCTG Market Volume Estimates, By Product
6.2.2 Global OCTG Market Volume Estimates, By Value
6.3 Regional Seamless Market Analysis
6.3.1 Global Seamless OCTG Market
6.3.1.1 Global Seamless Market Volume, By Region
6.3.1.2 Global Seamless Market Value, By Region
6.4 Regional ERW Market Analysis
6.4.1 Global ERW Market
6.4.1.1 Global ERW Market Volume By Region
6.4.1.2 Global ERW Market Value, By Region
6.5 Africa
6.5.1 Africa Seamless Market Analysis
6.5.1.1 Africa Seamless Market, By Volume
6.5.1.2 Africa Seamless Market, By Value
6.5.2 Africa ERW Market Analysis
6.5.2.1 Africa ERW Market, By Volume
6.5.2.2 Africa ERW Market, By Value
6.6 Asia-Pacific
6.6.1 Asia-Pacific Seamless Market Analysis
6.6.1.1 Asia-Pacific Seamless Market, By Volume
6.6.1.2 Asia-Pacific Seamless Market, By Value
6.6.2 Asia-Pacific ERW Market Analysis
6.6.2.1 Asia-Pacific ERW Market, By Volume
6.6.2.2 Asia-Pacific ERW Market, By Value
6.7 Europe
6.7.1 Europe Seamless Market Analysis
6.7.1.1 Europe Seamless Market, By Volume
6.7.1.2 Europe Seamless Market, By Value
6.7.2 Europe ERW Market Analysis
6.7.2.1 Europe ERW Market, By Volume
6.7.2.2 Europe ERW Market, By Value
6.8 Middle East
6.8.1 Middle East Seamless Market Analysis
6.8.1.1 Middle East Seamless Market, By Volume
6.8.1.2 Middle East Seamless Market, By Value
6.8.2 Middle East ERW Market Analysis
6.8.2.1 Middle East ERW Market, By Volume
6.8.2.2 Middle East ERW Market, By Value
6.9 North America
6.9.1 North America Seamless Market Analysis
6.9.1.1 North America Seamless Market, By Volume
6.9.1.2 North America Seamless Market, By Value
6.9.2 North America ERW Market Analysis
6.9.2.1 North America ERW Market, By Volume
6.9.2.2 North America ERW Market, By Value
6.10 South America
6.10.1 South America Seamless Market Analysis
6.10.1.1 South America Seamless Market, By Volume
6.10.1.2 South America Seamless Market, By Value
6.10.2 South America ERW Market Analysis
6.10.2.1 South America ERW Market, By Volume
6.10.2.2 South America ERW Market, By Value
7 Oil Country Tubular Goods Market, By Grade (Page No. - 181)
7.1 Introduction
7.2 Global Oil Country Tubular Goods Market, By Grade
7.2.1 Global OCTG Market Value, By Grade
7.2.2 Global OCTG Market Volume, By Grade
7.2.3 API OCTG Market
7.2.3.1 API OCTG Market Value, By Geography
7.2.3.2 API OCTG Market Volume, By Geography
7.2.4 Premium OCTG Market, By Grade
7.2.4.1 Premium OCTG Market Value, By Geography
7.2.4.2 Premium OCTG Market Volume, By Geography
7.2.5 North America OCTG Market, By Grade
7.2.5.1 North America API OCTG Market Value, By Country
7.2.5.2 North America API OCTG Market Volume, By Country
7.2.5.3 North America Premium OCTG Market Value, By Country
7.2.5.4 North America Premium OCTG Market Volume, By Country
7.2.6 Europe OCTG Market, By Grade
7.2.6.1 Europe API OCTG Market Value, By Country
7.2.6.2 Europe API OCTG Market Volume, By Country,
7.2.6.3 Europe Premium OCTG Market Value, By Country
7.2.6.4 Europe Premium OCTG Market Volume, By Country
7.2.7 South America OCTG Market, By Grade
7.2.7.1 South America API OCTG Market Value, By Country
7.2.7.2 South America API OCTG Market Volume, By Country
7.2.7.3 South America Premium OCTG Market Value, By Country
7.2.7.4 South America Premium OCTG Market Volume, By Country
7.2.8 Africa OCTG Market, By Grade
7.2.8.1 Africa API OCTG Market Value, By Country
7.2.8.2 Africa API OCTG Market Volume, By Country
7.2.8.3 Africa Premium OCTG Market Value, By Country
7.2.8.4 Africa Premium OCTG Market Volume, By Country
7.2.9 Middle East OCTG Market, By Grade
7.2.9.1 Middle East API OCTG Market Value, By Country
7.2.9.2 Middle East API OCTG Market Volume, By Country
7.2.9.3 Middle East Premium OCTG Market Value, By Country
7.2.9.4 Middle East Premium OCTG Market Volume, By Country
7.2.10 Asia-Pacific OCTG Market, By Country
7.2.10.1 Asia-Pacific API OCTG Market Value, By Country
7.2.10.2 Asia-Pacific API OCTG Market Volume, By Country
7.2.10.3 Asia-Pacific Premium OCTG Market Value, By Country
7.2.10.4 Asia-Pacific Premium OCTG Market Volume, By Country
8 Competitive Landscape (Page No. - 220)
8.1 Introduction
8.2 Key Players of the OCTG Market
8.2.1 List of Key Players
8.3 Growth Strategies in the OCTG Market
8.4 Most Active Companies in the OCTG Market
8.5 Market Share Analysis
8.5.1 Market Rankings of the Industry Players
8.6 Competitive Situations & Trends
8.6.1 Contracts & Agreements
8.6.2 Expansions
8.6.3 Mergers & Acquisitions
8.6.4 New Product Launches
8.6.5 Other Developments
9 Company Profiles (Page No. - 268)
9.1 Arcelormittal
9.1.1 Introduction
9.1.2 Products & Services
9.1.3 SWOT Analysis
9.1.4 Strategy & Insights
9.1.5 Recent Developments
9.2 JFE Steel Corporation
9.2.1 Introduction
9.2.2 Products & Services
9.2.3 SWOT Analysis
9.2.4 Strategy & Insights
9.2.5 Recent Developments
9.3 Jindal SAw Ltd.
9.3.1 Introduction
9.3.2 Products & Services
9.3.3 SWOT Analysis
9.3.4 Strategy & Insights
9.3.5 Recent Developments
9.4 MRC Global
9.4.1 Introduction
9.4.2 Products & Services
9.4.3 SWOT Analysis
9.4.4 Strategy & Insights
9.4.5 Recent Developments
9.5 National Oilwell Varco (Nov)
9.5.1 Introduction
9.5.2 Products & Services
9.5.3 SWOT Analysis
9.5.4 Strategy & Insights
9.5.5 Recent Developments
9.6 Nippon Steel & Sumitomo Metal Corporation
9.6.1 Introduction
9.6.2 Products & Services
9.6.3 SWOT Analysis
9.6.4 Strategy & Insights
9.6.5 Recent Developments
9.6.6 MNM View
9.7 Tenaris SA
9.7.1 Introduction
9.7.2 Products & Services
9.7.3 SWOT Analysis
9.7.4 Strategy & Insights
9.7.5 Recent Developments
9.7.6 MNM View
9.8 Tmk Group
9.8.1 Introduction
9.8.2 Products & Services
9.8.3 SWOT Analysis
9.8.4 Strategy & Insights
9.8.5 Recent Developments
9.8.6 MNM View
9.9 United States Steel (USS) Corporation
9.9.1 Introduction
9.9.2 Products & Services
9.9.3 SWOT Analysis
9.9.4 Strategy & Insights
9.9.5 Recent Developments
9.9.6 MNM View
9.10 Vallourec
9.10.1 Introduction
9.10.2 Products & Services
9.10.3 SWOT Analysis
9.10.4 Strategy & Insights
9.10.5 Recent Developments
9.10.6 MNM View
List of Tables (93 Tables)
Table 1 Global OCTG Market Size, 2012 � 2019, ($Million)
Table 2 total Number of Wells Drilled
Table 3 Count of Active offshore Rigs
Table 4 total Number of Wells Drilled
Table 5 Oil Country Tubular Goods Market Size, By Geography, 2012-2019 (Kiloton)
Table 6 OCTG Market Size, By Geography, 2012-2019 ($Million)
Table 7 Africa: Oil Country Tubular Goods Market Size, By Country, 2012�2019 (Kiloton)
Table 8 Africa: OCTG Market Size, By Country, 2012�2019 ($Million)
Table 9 Asia-Pacific: Oil Country Tubular Goods Market Size, By Country, 2012�2019 (Kiloton)
Table 10 Asia-Pacific: OCTG Market Size, By Country, 2012�2019 ($Million)
Table 11 Europe: Oil Country Tubular Goods Market Size, By Country, 2012�2019 (Kiloton)
Table 12 Europe: OCTG Market Size, By Country, 2012�2019 ($Million)
Table 13 Middle East: Oil Country Tubular Goods Market Size, By Country, 2012�2019 (Kiloton)
Table 14 Middle East: OCTG Market Size, By Country, 2012�2019 ($Million)
Table 15 North America: Oil Country Tubular Goods Market Size, By Country, 2012�2019 (Kiloton)
Table 16 North America: Oil Country Tubular Goods Market Size, By Country, 2012�2019 ($Million)
Table 17 South America: OCTG Market Size, By Country, 2012�2019 (Kiloton)
Table 18 South America: Oil Country Tubular Goods Market Size, By Country, 2012�2019 ($Million)
Table 19 Oil Country Tubular Goods Market Size,By Product, 2012-2019 (Kiloton)
Table 20 OCTG Market Size, By Product, 2012-2019 ($Million)
Table 21 Seamless OCTG Market Size, By Geography, 2012-2019 (Kiloton)
Table 22 Seamless OCTG Market Size, By Geography, 2012-2019 ($Million)
Table 23 ERW OCTG Market Size, By Geography, 2012 -2019 (Kiloton)
Table 24 ERW OCTG Market Size, By Region, 2012-2019 ($Million)
Table 25 Seamless Product Market Size, By Country, 2012-2019 (Kiloton)
Table 26 Seamless Product Market Size, By Country, 2012-2019 ($Million)
Table 27 ERW Product Market Size, By Country, 2012-2019 (Kiloton)
Table 28 ERW Product Market Size, By Country, 2012-2019 ($Million)
Table 29 Seamless Product Market Size, By Country, 2012-2019 (Kiloton)
Table 30 Seamless Product Market Size, By Country, 2012-2019 ($Million)
Table 31 ERW Product Market Size, By Country, 2012-2019 (Kiloton)
Table 32 ERW Product Market Size, By Country, 2012-2019 ($Million)
Table 33 Seamless Product Market Size, By Country, 2012 -2019 (Kiloton)
Table 34 Seamless Product Market Size, By Country, 2012-2019 ($Million)
Table 35 ERW Product Market Size, By Country, 2012-2019 (Kiloton)
Table 36 ERW Product Market Size, By Country, 2012-2019 ($Million)
Table 37 Seamless Product Market Size, By Country, 2012 -2019 (Kiloton)
Table 38 Seamless Product Market Size, By Country, 2012 -2019 ($Million)
Table 39 ERW Product Market Size, By Country, 2012-2019 (Kiloton)
Table 40 ERW Product Market Size, By Country, 2012-2019 ($Million)
Table 41 Seamless Product Market Size, By Country, 2012-2019 (Kiloton)
Table 42 Seamless Product Market Size, By Country, 2012 -2019 ($Million)
Table 43 ERW Product Market Size, By Country, 2012 -2019 (Kiloton)
Table 44 ERW Product Market Size, By Country, 2012-2019 ($Million)
Table 45 Seamless Product Market Size, By Country, 2012 -2019 (Kiloton)
Table 46 Seamless Product Market Size, By Country, 2012-2019 ($Million)
Table 47 ERW Product Market Size, By Country, 2012-2019 (Kiloton)
Table 48 ERW Product Market Size, By Country, 2012-2019 ($Million)
Table 49 Global OCTG Market Size, By Grade, 2012-2019, ($Million)
Table 50 Global OCTG Market Size, By Grade, 2012-2019, (Kiloton)
Table 51 API OCTG Market Size, By Geography, 2012-2019, ($Million)
Table 52 API OCTG Market Size, By Geography, 2012-2019, (Kilotons)
Table 53 Premium OCTG Market Size, By Geography, 2012-2019, ($Million)
Table 54 Premium OCTG Market Size, By Geography, 2012-2019, (Kiloton)
Table 55 North America API OCTG Market Size, By Country, 2012-2019, ($Million)
Table 56 North America API OCTG Market Size, By Country, 2012-2019, (Kiloton)
Table 57 North America Premium OCTG Market Size, By Country, 2012-2019, ($Million)
Table 58 North America Premium OCTG Market Size, By Country, 2012-2019, (Kilotons)
Table 59 Europe API OCTG Market Size, By Country, 2012-2019, ($Million)
Table 60 Europe API OCTG Market Size, By Country, 2012-2019, (Kiloton)
Table 61 Europe Premium OCTG Market Size, By Country, 2012-2019 ($Million)
Table 62 Europe Premium OCTG Market Size, By Country, 2012-2019 (Kiloton)
Table 63 South America API OCTG Market Size, By Country, 2012-2019 ($Million)
Table 64 South America API OCTG Market Size, By Country, 2012-2019 (Kiloton)
Table 65 South America Premium OCTG Market Size, By Country, 2012-2019 ($Million)
Table 66 South America Premium OCTG Market Size, By Country, 2012-2019 (Kiloton)
Table 67 Africa API OCTG Market Size, By Country, 2012-2019 ($Million)
Table 68 Africa API OCTG Market Size, By Country, 2012-2019 (Kiloton)
Table 69 Africa Premium OCTG Market Size, By Country, 2012-2019 ($Million)
Table 70 Africa Premium OCTG Market Size, By Country, 2012-2019 (Kiloton)
Table 71 Middle East API OCTG Market Size, By Country, 2012-2019 ($Million)
Table 72 Middle East API OCTG Market Size, By Country, 2012-2019 (Kiloton)
Table 73 Middle East Premium OCTG Market Size, By Country, 2012-2019 ($Million)
Table 74 Middle East Premium OCTG Market Size, By Country, 2012-2019 (Kiloton)
Table 75 Asia-Pacific API OCTG Market Size, By Country, 2012-2019 ($Million)
Table 76 Asia-Pacific API OCTG Market Size, By Country, 2012-2019 (Kiloton)
Table 77 Asia-Pacific Premium OCTG Market Size, By Country 2012-2019 ($Million)
Table 78 Asia-Pacific Premium OCTG Market Size, By Country, 2012-2019 (Kiloton)
Table 79 Annual Contracts & Agreements, 2011�2014
Table 80 Expansions, 2011-2014
Table 81 Mergers & Acquisitions, 2011-2014
Table 82 New Product Launches, 2011-2014
Table 83 Other Developments, 2011-2014
Table 84 Arcelormittal: Products & Equipment/Services
Table 85 JFE Steel Corporation: Products & Equipment/Services
Table 86 Jindal Saw Ltd.: Products & Equipment/Services
Table 87 MRC Global: Products & Equipment/Services
Table 88 National Oilwell Varco: Products & Equipments/Services
Table 89 Nippon Steel & Sumitomo Metal Corporation: Products & Equipment/Services
Table 90 Tenaris SA: Products & Equipment/Services
Table 91 Tnk Group: Products & Equipment/Services
Table 92 United States Steel (USS) Corporation: Products & Equipment/Services
Table 93 Valluorec: Products & Equipment/Services
List of Figures (48 Figures)
Figure 1 Research Methodology
Figure 2 Data Triangulation Methodology
Figure 3 OCTG Market (2013), By Market Size & Growth Rate
Figure 4 Global Market By Volume, 2012-2019 (Kilotons)
Figure 5 OCTG Market Value Share: top 5 Companies Vs. Others, 2013
Figure 6 OCTG Market Share, By Grade, 2013
Figure 7 Regional Market Life Cycle Analysis
Figure 8 Oil Country Tubular Goods Market Share, By Grade, 2013
Figure 9 OCTG Market Share, By Type, 2013
Figure 10 Oil Country Tubular Goods Market Share, By Type 2013
Figure 11 Value Chain Analysis of OCTG Market
Figure 12 Shale Gas Resource Share, By Country, 2013
Figure 13 Shale Oil Resource Share, By Country, 2013
Figure 14 offshore Wells According to Well Depth
Figure 15 The Natural Gas Production By Well Type in Barnett Shale, U.S.
Figure 16 Porter�s Five Forces Analysis
Figure 17 Global Oil Country Tubular Goods Market Share, By Geography, 2013
Figure 18 Africa OCTG Market Share, By Country, 2013
Figure 19 Asia-Pacific Oil Country Tubular Goods Market Share, By Country, 2013
Figure 20 Europe OCTG : Market Share, By Country, 2013
Figure 21 Middle East OCTG Market Share, By Country, 2013
Figure 22 North America OCTG Market Share, By Country, 2013
Figure 23 South America OCTG : Market Share, By Country, 2013
Figure 24 Global OCTG Market Share, By Product, 2013
Figure 25 Global Seamless Oil Country Tubular Goods Market Share, By Region, 2013
Figure 26 Global ERW OCTG Market Share, By Region, 2013
Figure 27 Africa Seamless Market Share, By Country, 2013
Figure 28 Africa ERW Market Share, By Country, 2013
Figure 29 Asia-Pacific Seamless Market Share, By Country, 2013
Figure 30 Asia-Pacific ERW Market Share, By Country, 2013
Figure 31 Europe Seamless Market Share, By Country, 2013
Figure 32 Europe ERW Market Share, By Country, 2013
Figure 33 Middle East Seamless Market Share, By Country, 2013
Figure 34 Middle East ERW Market Share, By Country, 2013
Figure 35 North America Seamless Market Share, By Country, 2013
Figure 36 North America ERW Market Share, By Country, 2013
Figure 37 South America Seamless Market Share, By Country, 2013
Figure 38 South America ERW Market Share, By Country, 2013
Figure 39 Global Oil Country Tubular Goods Market Share, By Grade, 2013
Figure 40 OCTG Market: Number of Developments 2011-2014
Figure 41 OCTG Market Development Share, By Growth Strategy 2011-2014
Figure 42 OCTG Market Activities, By Key Player 2011-2014
Figure 43 Market Share Analysis: By Company, 2012
Figure 44 Contract Agreements Analysis, 2011-2014
Figure 45 Expansions Analysis, 2011-2014
Figure 46 Mergers & Acqusitions Analysis, 2011-2014
Figure 47 New Products Launch Analysis, 2011-2014
Figure 48 Other Development Analysis, 2011-2013


Growth opportunities and latent adjacency in Oil Country Tubular Goods Market