Oilfield Equipment Rental Market by Equipment (Drilling Equipment (Drill Pipe, Drill Collars, Hevi-Wate, and Subs), Pressure & Flow Control Equipment, and Fishing Equipment), Application (Onshore and Offshore), and Region - Global Forecasts to 2022


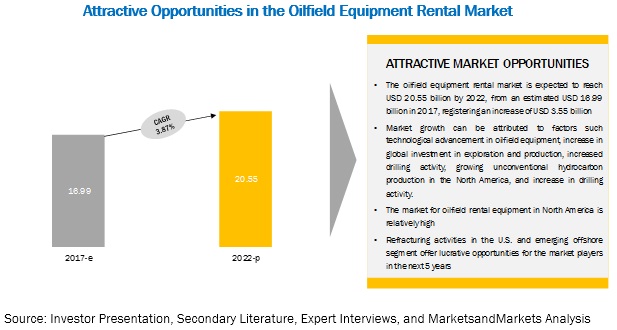
[182 Pages Report] MarketsandMarkets forecasts the global Oilfield Equipment Rental Market is projected to grow at a CAGR of 3.87% from 2017 to 2022, to reach a market size of USD 20.55 billion by 2022. Increasing technological advancements in oilfield equipment, rising global investments in Exploration & Production (E&P), growing drilling activity, and increasing unconventional hydrocarbon production in North America would drive the oilfield equipment rental market in the forecast period.
The drilling equipment is expected to hold the largest share of the oilfield equipment rental market, by equipment, during the forecast period.
The drilling segment dominated the oilfield equipment rental market during the forecast period. Extensive shale mining is being carried out in North America and technological advancement in the drilling equipment used in such unconventional shale reserves is expected to drive the drilling equipment segment.
Onshore is the largest segment in the oilfield equipment rental market
With regard to the application segment, onshore segment in the oilfield equipment rental market is expected to be the largest market in 2017. Rising demand for rental equipment from China, Southeast Asia, and the Middle East would drive the onshore segment. The presence of huge onshore shale reserves in the U.S. and Australia, is likely to boost the demand for onshore oilfields.
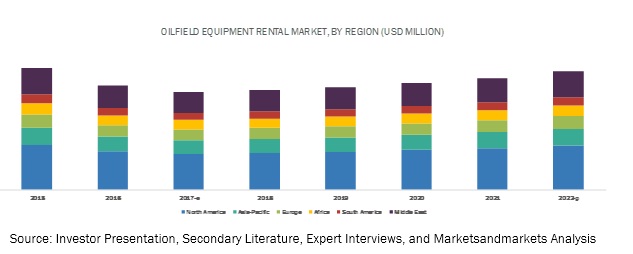
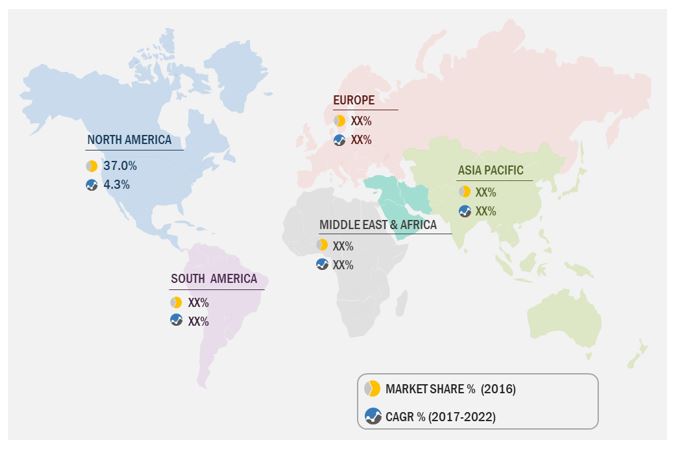
North America: Key market for the oilfield equipment rental market during the forecast period
North America is expected to dominate the global oilfield equipment rental market, given growing unconventional hydrocarbon production in the region. The region is the new swing producer in global oil markets owing to the boom in production from both shale operations and deep-water exploration and production in the Gulf of Mexico. Exploration and production activities in the region are also expected to gain momentum with increased capital spending by major oil companies. All these factors are expected to drive the North American oilfield equipment rental market.
Market Dynamics
Driver: Technological advancements in oilfield equipment
The oil & gas companies have started to shift their exploration focus towards the unconventional and deep hydrocarbon reservoirs such as shale gas, coal bed methane (CBM), tight gas, and heavy oil. The petroleum industry currently, has advanced IT based machinery and software to perform operations in different unconventional and deep reservoir conditions. This paves the way for new age technology as the tool to execute stiff operations. For instance, advanced Radio Frequency Identification (RFID) circulation sub which assists in facilitating drilling and hole-cleanup operations. The RFID circulation sub enables operators to reduce the amount of non-productive time. The application of advanced drilling and completion technologies have enabled financially viable drilling in shale formations. The traditional equipment are not fully equipped to meet the new challenges. Technologies like horizontal drilling and hydraulic fracturing, have opened up significant shale oil & gas formations. There has been a significant rise is the horizontal component of the oil rig count.
Restraint: Customized demands by drillers
The exploration of new reserves and the depletion of current ones has enforced the application of new extraction techniques and increased the complexity of drilling. The demand for customized drilling equipment is driven by the increasing volume and complexity of well requirements in order to meet global production targets. The delivery of significant number of high specification rigs and associated equipment is expected in the next five years. Most of the high technology new rigs are expected to be used for horizontal drilling. All this imposes additional pressure on the rental equipment providers as demand for well operators varies from well to well. The rental equipment providers are supposed to maintain inventory of wide variety of these equipment which affects their economies of scale. The oilfield equipment providers have to constantly modify their inventory, which in turn requires more capital. These factors hinder the growth of the oilfield equipment rental market.
Opportunity: Emerging offshore opportunities
Exploration, drilling, and production activities in the offshore environment require different environmental and technical considerations than onshore oil & gas activities. Despite the challenges posed by such harsh offshore environmental conditions, advances in exploration and production technology for application in ice prone regions like– the Grand Banks, Bohai Sea, Caspian Sea, Cook Inlet and Sakhalin Island, has developed economically feasible solutions for production in these regions. The global slowdown in oil prices resulted in downturn in the drilling activities in past few years putting further pressure on offshore drillers and service providers. But opportunities for offshore drillers is expected to grow as the industry tend to recover moderately. For instance, In Argentina the Ministry of Energy is planning to launch an auction process for between 6 and 10 offshore exploration blocks towards the end of 2017. Whereas the Colombian government reduced offshore gas royalties and lowered windfall profit fees to support offshore developments in the country. Other activities like– Commercialization of Liza oil discovery in the Stabroek offshore block by ExxonMobil in Guyana and growing contracts for exploration and production of hydrocarbons in the deep-water offshore in Mexico are expected to develop new opportunities for offshore drilling.
Challenge: Success rate of exploration
With declining production from mature oil fields, oil & gas companies are forced into increasing exploration activities into challenging areas such as deep water, beneath salt and basalt, and in carbonate reservoirs. The success rate of oil & gas exploration is only about 40%, but with advanced marine-seismic technology, this success rate is bound to increase. Drilling deep water well can cost up to USD 100 Million. Exploratory drilling requires significant capital investment and does not always result in commercial quantities or new development projects. Bringing down exploration cost is a major challenge for the oil & gas companies. In the low oil price scenario, the deep-water drilling and explorations have reduced as companies are focusing more on producing fields rather than spending more on new explorations which has reduced the demand for rental oilfield equipment for deep-water explorations.
Scope of the Report
|
Report Metric |
Details |
|
Market size available for years |
2016–2022 |
|
Base year considered |
2016 |
|
Forecast period |
2017–2022 |
|
Forecast units |
Billion (USD) |
|
Segments covered |
Equipment (Drilling Equipment, Pressure & Flow Control Equipment), Application (Onshore, Offshore), and Region |
|
Geographies covered |
Asia Pacific, Europe, North America, South America, Middle East, and Africa |
|
Companies covered |
Halliburton (US), Schlumberger (US), Weatherford International, PLC (Switzerland), and Superior Energy Services, Inc. (US) |
The research report categorizes the Oilfield Equipment Rental Market to forecast the revenues and analyze the trends in each of the following sub-segments:
By Equipment
- Drilling
- Pressure & Flow Control
By Application
- Onshore
- Offshore
By Region
- Asia Pacific
- Europe
- North America
- Middle East
- South America
- Africa
Key Market Players
Halliburton Company (US), Schlumberger Limited (US), Weatherford International, PLC (Switzerland), Superior Energy Services, Inc. (US), Oil States International, Inc. (US), and Parker Drilling Company (US)
Halliburton Company is one of the leading service providers and product suppliers in the upstream sector of the oil & gas industry. The company provides thirteen Product Service Lines (PSLs) under two main divisions, namely, drilling and evaluation and completion and production. The company has operations in 80 countries across the globe. The company has manufacturing operations in the U.S., China, Singapore, Canada, Malaysia, and the U.K. The long-term strategy of the company is to focus on three areas, namely, international business opportunities, applied technology, and integrated solutions. The company is well positioned to utilize its global infrastructure and technological prowess to provide operational distinction at low costs. As a part of its expansion strategy, the company has recently opened technology and research centers in Iberia, Brazil, and the U.S. to have technologically advanced products and solutions.
Recent Developments
- In May 2016, Parker Drilling Company received contract for operation and maintenance three customers owned rigs in support of Sakhalin-1 Project.
- In April 2016, Schlumberger acquired coiled tubing drilling and coiled tubing units. This will strengthen its coiled tubing portfolio in markets of U.S. and Saudi Arabia.
- In February 2016, Oil States Industries, Inc. opened facility in U.K. The facility is 240,000 square foot and supports engineering, project management, sales, and administrative functions.
Critical questions the report answers:
- Where will all these developments take the industry in the long term?
- What are the upcoming trends for the Oilfield Equipment Rental market?
- Which segment provides the most opportunity for growth?
- Who are the leading vendors operating in this market?
- What are the opportunities for new market entrants?
To speak to our analyst for a discussion on the above findings, click Speak to Analyst
 Exclusive indicates content/data unique to MarketsandMarkets and not available with any competitors.
Table of Contents
1 Introduction (Page No. - 14)
1.1 Objectives of the Study
1.2 Market Definition
1.3 Market Scope
1.3.1 Markets Covered
1.3.2 Years Considered for the Study
1.4 Currency
1.5 Limitations
1.6 Stakeholders
2 Research Methodology (Page No. - 17)
2.1 Research Data
2.1.1 Secondary Data
2.1.2 Primary Data
2.1.2.1 Key Data From Primary Sources
2.1.2.2 Key Industry Insights
2.1.2.3 Breakdown of Primary Interviews
2.2 Market Size Estimation
2.3 Market Breakdown & Data Triangulation
2.4 Research Assumptions
3 Executive Summary (Page No. - 25)
4 Premium Insights (Page No. - 30)
4.1 Attractive Opportunities in the Oilfield Equipment Rental Market, 2017–2022
4.2 Oilfield Equipment Rental Market, By Region, 2016
4.3 Oilfield Equipment Rental Market, By Equipment, 2017 & 2022
5 Market Overview (Page No. - 33)
5.1 Introduction
5.2 Market Dynamics
5.2.1 Drivers
5.2.1.1 Technological Advancements in Oilfield Equipment
5.2.1.2 Increase in Global Investments in Exploration & Production (E&P)
5.2.1.3 Increased Drilling Activity
5.2.1.4 Growing Unconventional Hydrocarbon Production in North America
5.2.2 Restraints
5.2.2.1 Customized Demands By Drillers
5.2.2.2 Uncertain Regulatory Framework
5.2.2.3 Equipment Utilization and Cold Stacked Inventory
5.2.3 Opportunities
5.2.3.1 Refracturing Activities in the U.S.
5.2.3.2 Emerging Offshore Opportunities
5.2.4 Challenges
5.2.4.1 Success Rate of Exploration
6 Oilfield Equipment Rental Market, By Equipment (Page No. - 43)
6.1 Introduction
6.2 Drilling Equipment
6.2.1 Drill Pipe
6.2.2 Drill Collar
6.2.3 Hevi-Wate
6.2.4 Subs
6.2.5 Other Drilling Equipment
6.3 Pressure & Flow Control Equipment
6.3.1 Blow Out Preventer (BOP)
6.3.2 Valves & Manifolds
6.3.3 Other Pressure & Flow Control Equipment
6.4 Fishing Equipment
6.5 Other Oilfield Equipment Rental Market
7 Oilfield Equipment Rental Market, By Application (Page No. - 58)
7.1 Introduction
7.2 Onshore
7.3 Offshore
8 Oilfield Equipment Rental Market, By Region (Page No. - 62)
8.1 Introduction
8.2 Asia-Pacific
8.2.1 By Equipment
8.2.2 By Application
8.2.2.1 By Country
8.2.2.1.1 China
8.2.2.1.2 India
8.2.2.1.3 Indonesia
8.2.2.1.4 Australia
8.2.2.1.5 Rest of Asia-Pacific
8.3 Europe
8.3.1 By Equipment
8.3.2 By Application
8.3.2.1 By Country
8.3.2.1.1 Russia
8.3.2.1.2 Norway
8.3.2.1.3 Kazakhstan
8.3.2.1.4 U.K.
8.3.2.1.5 Rest of Europe
8.4 North America
8.4.1 By Equipment
8.4.2 By Application
8.4.2.1 By Country
8.4.2.1.1 U.S.
8.4.2.1.2 Canada
8.4.2.1.3 Mexico
8.5 Middle East
8.5.1 By Equipment
8.5.2 By Application
8.5.2.1 By Country
8.5.2.1.1 Saudi Arabia
8.5.2.1.2 Iran
8.5.2.1.3 Qatar
8.5.2.1.4 Rest of the Middle East
8.6 Africa
8.6.1 By Equipment
8.6.2 By Application
8.6.3 By Country
8.6.3.1 Angola
8.6.3.2 Egypt
8.6.3.3 Nigeria
8.6.3.4 Rest of Africa
8.7 South America
8.7.1 By Equipment
8.7.2 By Application
8.7.3 By Country
8.7.4 Brazil
8.7.4.1 Venezuela
8.7.4.2 Rest of South America
9 Competitive Landscape (Page No. - 104)
9.1 Overview
9.2 Key Players of the Oilfield Equipment Rental Market
9.2.1 Key Company Focus Area
9.2.1.1 Growth Strategies in the Market
9.3 Market Share Analysis
9.3.1 Global Market Scenario
9.4 Competitive Situations & Trends
9.5 Vendor Dive Overview
9.5.1 Vanguards
9.5.2 Dynamic
9.5.3 Innovators
9.5.4 Emerging
9.6 Analysis of the Product Portfolio of Major Players in the Market (25 Companies)
9.7 Business Strategy Adopted By Major Players in the Market (25 Companies)
10 Company Profiles (Page No. - 112)
10.1 Schlumberger Limited
10.2 Halliburton Company
10.3 Superior Energy Services, Inc.
10.4 Oil States International, Inc.
10.5 Technipfmc, PLC
10.6 Weatherford International, PLC
10.7 Parker Drilling Company
10.8 Seventy Seven Energy, Inc.
10.9 Basic Energy Services, Inc.
10.10 Key Energy Services, Inc.
10.11 John Energy, Ltd.
10.12 Circle T Service & Rental, Ltd.
10.13 Ensign Energy Services, Inc.
10.14 Bestway Oilfields
10.15 Kit Oil & Gas
11 Appendix (Page No. - 165)
11.1 Insights of Industry Experts
11.2 Discussion Guide
11.3 Knowledge Store: Marketsandmarkets’ Subscription Portal
11.4 Introducing RT: Real-Time Market Intelligence
11.5 Available Customizations
11.6 Related Reports
11.7 Author Details
List of Tables (67 Tables)
Table 1 Global Oilfield Equipment Rental Snapshot
Table 2 Worldwide Exploration & Production Spending By Region (USD Billion)
Table 3 World Energy Consumption By Country, 2012–2040 (Quadrillion Btu)
Table 4 Demand Outlook, Floaters, and Jackups 2013–2020
Table 5 Oilfield Equipment Rental Market Analysis: By Equipment
Table 6 Oilfield Equipment Rental Market Size, By Equipment, 2015–2022 (USD Million)
Table 7 Drilling Equipment Rental Market, By Region 2015–2022 (USD Million)
Table 8 Drill Pipe Equipment Rental Market, By Region 2015–2022 (USD Million)
Table 9 Drill Collar Equipment Rental Market, By Region 2015–2022 (USD Million)
Table 10 Hevi-Wate Equipment Rental Market, By Region 2015–2022 (USD Million)
Table 11 Subs Equipment Rental Market, By Region 2015–2022 (USD Million)
Table 12 Other Drilling Equipment Rental Market, By Region 2015–2022 (USD Million)
Table 13 Pressure & Flow Control Equipment Rental Market, By Region 2015–2022 (USD Million)
Table 14 Blow Out Preventer Equipment Rental Market, By Region 2015–2022 (USD Million)
Table 15 Valves & Manifolds Equipment Rental Market, By Region 2015–2022 (USD Million)
Table 16 Other Pressure & Flow Control Equipment Rental Market, By Region 2015–2022 (USD Million)
Table 17 Fishing Equipment Rental Market, By Region 2015–2022 (USD Million)
Table 18 Other Equipment Rental Market, By Region 2015–2022 (USD Million)
Table 19 Oilfield Equipment Rental Market Size, By Application, 2015–2022 (USD Million)
Table 20 Onshore OER Market Size, By Application, 2015–2022 (USD Million)
Table 21 Offshore OER Market Size, By Application, 2015–2022 (USD Million)
Table 22 Oilfield Equipment Rental Market Size, By Region, 2015–2022 (USD Million)
Table 23 Asia-Pacific: OER Market Size, By Country, 2015–2022 (USD Million)
Table 24 Asia-Pacific: Market Size, By Equipment, 2015–2022 (USD Million)
Table 25 Asia-Pacific: Market Size, By Application, 2015–2022 (USD Million)
Table 26 China: Market Size, By Equipment, 2015–2022 (USD Million)
Table 27 India: OER Market Size, By Equipment, 2015–2022 (USD Million)
Table 28 Indonesia: OER Market Size, By Equipment, 2015–2022 (USD Million)
Table 29 Australia: OER Market Size, By Equipment, 2015–2022 (USD Million)
Table 30 Rest of Asia-Pacific: Market Size, By Equipment, 2015–2022 (USD Million)
Table 31 Europe: Oilfield Equipment Rental Market Size, By Country, 2015–2022 (USD Million)
Table 32 Europe: Market Size, By Equipment, 2015–2022 (USD Million)
Table 33 Europe: Market Size, By Application, 2015–2022 (USD Million)
Table 34 Russia: Market Size, By Equipment, 2015–2022 (USD Million)
Table 35 Norway: Market Size, By Equipment, 2015–2022 (USD Million)
Table 36 Kazakhstan: Market Size, By Equipment, 2015–2022 (USD Million)
Table 37 U.K.: Oilfield Equipment Rental Market Size, By Equipment, 2015–2022 (USD Million)
Table 38 Rest of Europe: Market Size, By Equipment, 2015–2022 (USD Million)
Table 39 North America: Market Size, By Country, 2015–2022 (USD Million)
Table 40 North America: Market Size, By Equipment, 2015–2022 (USD Million)
Table 41 North America: Market Size, By Application, 2015–2022 (USD Million)
Table 42 U.S.: Oilfield Equipment Rental Market Size, By Equipment, 2015–2022 (USD Million)
Table 43 Canada: Market Size, By Equipment, 2015–2022 (USD Million)
Table 44 Mexico: Market Size, By Equipment, 2015–2022 (USD Million)
Table 45 Middle East Exploration and Production Spending, (USD Million)
Table 46 Middle East: Market Size, By Country, 2015–2022 (USD Million)
Table 47 Middle East: Market Size, By Equipment, 2015–2022 (USD Million)
Table 48 Middle East: Market Size, By Application, 2015–2022 (USD Million)
Table 49 Saudi Arabia: Market Size, By Equipment, 2015–2022 (USD Million)
Table 50 Contracts Awarded, Head of Agreements, and Memorandum of Understanding, 2016–2017
Table 51 Iran: Oilfield Equipment Rental Market Size, By Equipment, 2015–2022 (USD Million)
Table 52 Qatar: Market Size, By Equipment, 2015–2022 (USD Million)
Table 53 Rest of the Middle East: Market Size, By Equipment, 2015–2022 (USD Million)
Table 54 Africa: Oilfield Equipment Rental Market Size, By Country, 2015–2022 (USD Million)
Table 55 Africa: Market Size, By Equipment, 2015–2022 (USD Million)
Table 56 Africa: Market Size, By Application, 2015–2022 (USD Million)
Table 57 Angola: Market Size, By Equipment, 2015–2022 (USD Million)
Table 58 Egypt: Market Size, By Equipment, 2015–2022 (USD Million)
Table 59 Nigeria: Market Size, By Equipment, 2015–2022 (USD Million)
Table 60 Rest of Africa: Market Size, By Equipment, 2015–2022 (USD Million)
Table 61 South America: Market Size, By Country, 2015–2022 (USD Million)
Table 62 South America: Market Size, By Equipment, 2015–2022 (USD Million)
Table 63 South America: Market Size, By Application, 2015–2022 (USD Million)
Table 64 Brazil: Market Size, By Equipment, 2015–2022 (USD Million)
Table 65 Venezuela: Market Size, By Equipment, 2015–2022 (USD Million)
Table 66 Rest of South America: Oilfield Equipment Rental Market Size, By Equipment, 2015–2022 (USD Million)
Table 67 Market Ranking, 2016
List of Figures (52 Figures)
Figure 1 Markets Covered: Oilfield Equipment Rental Market
Figure 2 Oilfield Equipment Rental Market: Research Design
Figure 3 Breakdown of Primary Interviews: By Company Type, Designation, & Region
Figure 4 Market Size Estimation Methodology: Bottom-Up Approach
Figure 5 Market Size Estimation Methodology: Top-Down Approach
Figure 6 Data Triangulation Methodology
Figure 7 North America Dominated the Market in 2016
Figure 8 Drilling Equipment Segment is Expected to Dominate the Oilfield Equipment Rental Market During the Forecast Period
Figure 9 Oilfield Equipment Rental Market: Application Snapshot
Figure 10 Technological Advancement in Oilfield Equipment Expected to Drive the Market During the Forecast Period
Figure 11 North America is Also Expected to Grow at A Fast Pace During the Forecast Period
Figure 12 Onshore Segment is Expected to Hold the Largest Share During the Forecast Period
Figure 13 Drilling Equipment Segment is Estimated to Dominate the Oilfield Equipment Rental Market Till the Forecast Period
Figure 14 Market Dynamics: Oilfield Equipment Rental Market
Figure 15 Upstream Investment Plans (USD Billion) By Oil Producing and Exporting Countries (OPEC)
Figure 16 Russian Horizontal Drilling Activity, 2010–2016 (Km/D)
Figure 17 Drilling Segment is Expected to Hold the Maximum Share of the Oilfield Equipment Rental Market From 2017 to 2022
Figure 18 Rental Equipment Supplies By Well Stages & Category of Equipment
Figure 19 Market, By Equipment, 2017 & 2022
Figure 20 Pressure & Flow Control Rental Market, By Region, 2017 & 2022
Figure 21 Fishing Equipment Rental Market, By Region, 2017 & 2022
Figure 22 Onshore Equipment Rental Market Dominates the Market, By Application, During the Forecast Period
Figure 23 Onshore Market, By Region, 2017 & 2022
Figure 24 Regional Snapshot: North America Expected to Dominate the Market Till 2022
Figure 25 North America: the Largest & Fastest Growing Market Till 2022
Figure 26 China: the Largest Market for Market During the Forecast Period
Figure 27 Onshore and Offshore Exploration & Development Drilling Activities, 2016
Figure 28 Russia: the Largest Market During the Forecast Period
Figure 29 Production History and Forecast Distributed Per Resource Category, 2010–2030
Figure 30 U.K. Continental Shelf (UKCS) Exploration and Appraisal Well Count, 2014–2018
Figure 31 North America Rig Count By Area, 2017
Figure 32 Capital Expenditure for Oil Companies, 2016–2017
Figure 33 North America Market: Regional Snapshot
Figure 34 Oil & Gas Production in Permian Region, 2010–2017
Figure 35 Middle East Market: Regional Snapshot
Figure 36 Nigeria: the Largest Market for Market During the Forecast Period
Figure 37 Natural Gas Demand in South America, 2000–2030
Figure 38 Brazil: the Largest Market for Market During the Forecast Period
Figure 39 Companies Adopted Mergers & Acquistions and Investments & Contracts & Agreements Were Key Strategies to Capture the Market, 2014–2017
Figure 40 Mergers & Acquisitions is the Most Adopted Startegy During the Forecast Period
Figure 41 Market Evaluation Framework: Mergers & Acquisitions Have Fueled the Growth of Companies, 2014–2016
Figure 42 Vendor Dive Matrix
Figure 43 Schlumberger Limited: Company Snapshot
Figure 44 Halliburton Company: Company Snapshot
Figure 45 Superior Energy Services, Inc.: Company Snapshot
Figure 46 Oil States International, Inc.: Company Snapshot
Figure 47 Weatherford International, PLC.: Company Snapshot
Figure 48 Parker Drilling Company: Company Snapshot
Figure 49 Seventy Seven Energy, Inc.: Company Snapshot
Figure 50 Basic Energy Services, Inc.: Company Snapshot
Figure 51 Key Energy Services, Inc.: Company Snapshot
Figure 52 Ensign Energy Services, Inc.: Company Snapshot


Growth opportunities and latent adjacency in Oilfield Equipment Rental Market