Optical Brighteners Market by Application (Paper, Fabrics, Detergents & Soaps, Synthetics & Plastics & Others), by End User (Consumer Products, Textiles & Apparel, Packaging, Security & Safety & Others) - Global Forecast to 2020


The optical brighteners market is projected to reach USD 1.05 Billion by 2020, at a CAGR of 9.6%. The report segments the market by application into paper, fabrics, detergents & soaps, synthetics & plastics, and others, by end-users into consumer products, security & safety, textiles & apparel, packaging, and by region into Asia-Pacific, North America, Europe, and RoW. Base year considered for the study is 2014, while the forecast period is between 2015 and 2020.
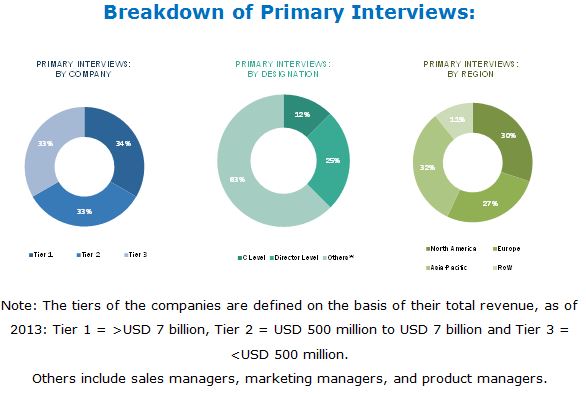
Both top-down and bottom-up approaches have been used to estimate and validate the size of the global market and to estimate the sizes of various other dependent submarkets in the overall optical brightener market. The research study involved extensive use of secondary sources, directories, and databases such as Hoovers, Bloomberg, Chemical Weekly, Factiva, and other government and private websites to identify and collect information useful for the technical, market-oriented, and commercial study of the global optical brighteners market.
To know about the assumptions considered for the study, download the pdf brochure
The value chain of optical brighteners market starts with the sourcing of basic raw materials, manufacturing, supplies it to intermediate product manufacturer, and used for various end-use applications. Raw material suppliers are the 4,4’ diamino- 2,2’- stilbenesulfonic acid (DAS) manufacturers and suppliers. Various companies, such as Emco Dyestuff Pvt Ltd, Roop Dhara Industries, Tianjin Yakete International Trade Co., Ltd. manufacture DAS. Companies manufacture 4,4’ diamino- 2,2’- stilbenesulfonic acid (DAS) and supply it to the optical brighteners manufacturers. Optical brighteners manufacturers uses it in various intermediate products such as paper, fabrics and plastics. Development of newer technology shall also be an opportunity for the optical brightener market. Clariant manufactured new products Leucophor BMBB and the Hostalux ACK brighteners, which are chlorine resistant.
Key Target Audience in Optical Brighteners Market
- Raw material suppliers
- Optical Brighteners manufacturers
- Traders, distributors, and Optical Brighteners suppliers
- Government and regional agencies and research organizations
- Investment research firms
Optical Brighteners Market Report Scope
This research report categorizes the global optical brighteners market on the basis of application and region.
On the basis of Application:
- Paper
- Fabrics
- Detergents & Soaps
- Synthetics & Plastics
- Other applications (lacquers, ultraviolet tracer and pigmented lacquers)
On the basis of Region:
- North America
- Europe
- Asia-Pacific
- RoW
The market is further analyzed for the key countries in each of these regions.
Optical Brighteners Market Report Available Customizations
With the given market data, MarketsandMarkets offers customizations according to the company’s specific needs. The following customization options are available for the report:
Optical Brighteners Market Geographic Analysis:
- Country-level analysis of the optical brighteners market by application
Optical Brighteners Market Company Information:
- Detailed analysis and profiling of additional market players
Optical Brighteners Market Product Analysis
- Product Matrix, which gives a detailed comparison of product portfolio of each company
The global optical brighteners market is estimated to reach USD 1.05 Billion by 2020, registering a CAGR of 9.6% between 2015 and 2020. The market is driven by increasing demand for optical brighteners in emerging markets and high demand from the paper, fabrics, detergents & soap application segments. Optical brighteners have unique properties, such as high fluorescence, light fastness, heat resistance, chemical stability, for which it is widely used in paper and textile industry.
Optical brighteners are used in various applications, such as paper, fabrics, detergents & soap, synthetics & plastic, packaging, and others. In 2014, the Paper segment accounted for the largest market share, in terms of volume, followed by fabrics. Optical brighteners are used in papers for making them more bright and white. Optical brighteners are also used in the detergents and soap for whitening of cloths. Increasing industrialization in emerging countries of Asia-Pacific is driving the optical brightener market in paper and fabrics application. New and emerging applications such as lacquers, universal tracer and pigmented lacquers are gaining attention and are potential applications of optical brighteners.
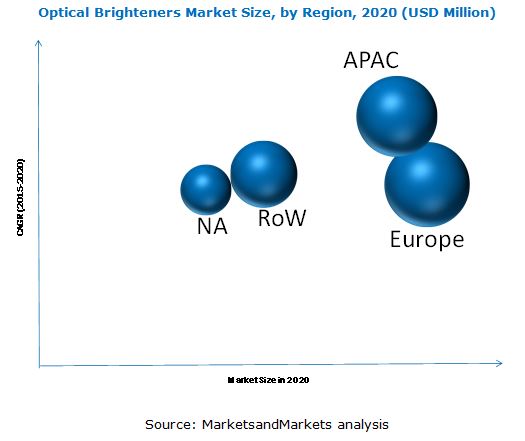
Improving economies coupled with increased demand from the paper, fabrics, detergents & soap, synthetics & plastics, packaging, and other applications boost the market in Asia-Pacific. The region accounts for a second largest share in the optical brighteners market globally. Europe accounted for the largest market share in the optical brighteners market in 2014, but Asia-Pacific is ahead in growth rate during the forecast period
US is the largest producer of optical brighteners worldwide with the presence of manufacturing sites of major industry players in the country. China and the U.S. have majority of the optical brighteners manufacturing plants. Most of the big players are backward integrated and have the competitive advantage over other suppliers. Threat of new entrants is high in China, India and other Asia-pacific country’s due to low cost of raw material and labor coupled with low requirement of technical know-how.
The major companies operating in this market are adopting strategies such as new product launches, acquisitions and expansion in order to increase their application as well as geographical reach. Among all the developments tracked in this report by the major companies, new product launch accounted for the largest share between 2012 and 2015.
Key Players in Audience in Optical Brighteners Market Industry
The optical brightener market is dominated by renowned manufacturers such as BASF SE (Germany), RPM International Corp. (U.S.), Keystone Aniline Corporation (U.S.), Aron Universal (India), Huntsman Corporation (U.S.), Clariant AG (Switzerland), Brilliant Colors Inc. (U.S.), 3 V Incorporation (U.S.), and The Fong Min International Company Limited (Taiwan), and Archroma (Switzerland).
Frequently Asked Questions (FAQ):
What is the Optical Brighteners Market growth?
Registering at a CAGR of 9.6% between 2015 and 2020.
Who leading market players in Optical Brighteners industry?
The key companies profiled in optical brighteners market research report are BASF SE (Germany), RPM International Corp. (U.S.), Keystone Aniline Corporation (U.S.), Aron Universal (India), Huntsman Corporation (U.S.), Clariant AG (Switzerland), Brilliant Colors Inc. (U.S.), 3 V Incorporation (U.S.), and The Fong Min International Company Limited. (Taiwan), and Archroma (Switzerland).
How big is the Optical Brighteners Market?
The global optical brighteners market is projected to reach USD 1.05 Billion by 2020.
Which segments are covered in Optical Brighteners Market report?
By Application (Paper, Fabrics, Detergents & Soaps, Synthetics & Plastics) & By End User (Consumer Products, Textiles & Apparel, Packaging, Security & Safety).
To speak to our analyst for a discussion on the above findings, click Speak to Analyst
 Exclusive indicates content/data unique to MarketsandMarkets and not available with any competitors.
Table of Contents
1 Introduction (Page No. - 15)
1.1 Objectives of the Study
1.2 Market Definition
1.3 Market Scope
1.3.1 Years Considered for the Study
1.4 Currency
1.5 Package Size
1.6 Limitations
1.7 Stakeholders
2 Research Methodology (Page No. - 19)
2.1 Research Data
2.1.1 Secondary Data
2.1.1.1 Key Data From Secondary Sources
2.1.2 Primary Data
2.1.2.1 Key Data From Primary Sources
2.1.2.2 Key Industry Insights
2.1.2.3 Breakdown of Primary Interviews
2.2 Market Size Estimation
2.2.1 Bottom-Up Approach
2.2.2 Top-Down Approach
2.3 Market Breakdown and Data Triangulation
2.4 Research Assumptions
3 Executive Summary (Page No. - 27)
4 Premium Insights (Page No. - 31)
4.1 Attractive Market Opportunities for Optical Brighteners
4.2 Optical Brighteners Market Share, By Application and Region
4.3 Applications of Optical Brighteners Market, By Region
5 Market Overview (Page No. - 34)
5.1 Introduction
5.2 Segmentation
5.2.1 By Application
5.2.2 By End User
5.2.3 By Region
5.3 Market Dynamics
5.3.1 Drivers
5.3.1.1 Growing Demand From Synthetics & Plastics Industry
5.3.1.2 Rising Demand for Biodegradable Brighteners
5.3.1.3 Growing Textiles & Apparel Industry in Asia-Pacific
5.3.2 Restraints
5.3.2.1 Non-Stilbenes Brighteners Acting as A Substitute for Optical Brighteners
5.3.3 Opportunities
5.3.3.1 Emerging Applications in Printing Inks and Photo Processing Industries
5.3.4 Challenges
5.3.4.1 High Cost of Production
6 Industry Trends (Page No. - 43)
6.1 Introduction
6.2 Value-Chain Analysis
6.3 Porter’s Five Forces Analysis
6.3.1 Bargaining Power of Suppliers
6.3.2 Threat of New Entrants
6.3.3 Threat of Substitutes
6.3.4 Bargaining Power of Buyers
6.3.5 Intensity of Competitive Rivalry
7 Optical Brighteners, By Application (Page No. - 48)
7.1 Introduction
7.2 Paper
7.3 Fabrics
7.4 Detergents & Soaps
7.5 Synthetics & Plastics
7.6 Others
8 Optical Brighteners Market, By End User (Page No. - 58)
8.1 Introduction
8.2 Consumer Products
8.3 Security & Safety
8.4 Textiles & Apparel
8.5 Packaging
8.6 Other End Users
9 Optical Brighteners Market, By Region (Page No. - 68)
9.1 Introduction
9.2 North America
9.2.1 U.S.
9.2.2 Rest of North America
9.3 Europe
9.3.1 Germany
9.3.2 France
9.3.3 Italy
9.3.4 U.K.
9.3.5 Rest of Europe
9.4 Asia-Pacific
9.4.1 China
9.4.2 India
9.4.3 Japan
9.4.4 South Korea
9.4.5 Rest of Asia-Pacific
9.5 RoW
9.5.1 South America
9.5.2 Middle East & Africa
10 Competitive Landscape (Page No. - 112)
10.1 Overview
10.2 New Product Launch: the Most Popular Growth Strategy Between 2012 and 2015
10.2.1 New Product Launch
10.2.2 Expansion
10.2.3 Merger & Acquisition
11 Company Profiles (Page No. - 117)
(Overview, Financial*, Products & Services, Strategy, and Developments)
11.1 Introduction
11.2 RPM International Inc.
11.3 BASF SE
11.4 Huntsman Corp
11.5 Clariant AG
11.6 Keystone Aniline Corporation
11.7 Brilliant Group Inc.
11.8 Aron Universal Ltd
11.9 3V Inc.
11.10 TEH Fong Min International Co. Ltd.
11.11 Archroma
*Details Might Not Be Captured in Case of Unlisted Companies
12 Appendix (Page No. - 137)
12.1 Insights of Industry Experts
12.2 Discussion Guide
12.3 Knowledge Store: Marketsandmarkets’ Subscription Portal
12.4 Introducing RT: Real Time Market Intelligence
12.5 Available Customizations
12.6 Related Reports
List of Tables (122 Tables)
Table 1 Optical Brighteners Market, By Type
Table 2 Increasing Textiles & Apparel Industry in Asia-Pacific Driving Growth of the Optical Brighteners Market
Table 3 Economic Slowdown in Europe and Less Availability of Substitutes Restrain the Market Growth
Table 4 Emerging Applications in Photo Processing and Printing Ink Industries Create Opportunities for Optical Brighteners
Table 5 High Production Cost is the Key Challenge in the Market
Table 6 Optical Brighteners Market Size in Paper Application, By Region, 2013–2020 (Kiloton)
Table 7 Optical Brightener Market Size in Paper Application, By Region, 2013–2020 (USD Million)
Table 8 Optical Brighteners Market Size in Fabrics Application, By Region, 2013–2020 (Kiloton)
Table 9 Optical Brightener Market Size in Fabrics Application, By Region, 2013–2020 (USD Million)
Table 10 Optical Brighteners Market Size in Detergents & Soaps Application, By Region, 2013–2020 (Kiloton)
Table 11 Optical Brightener Market Size in Detergents & Soaps Application, By Region, 2013–2020 (USD Million)
Table 12 Optical Brighteners Market Size in Synthetics & Plastics Application, By Region, 2013–2020 (Kiloton)
Table 13 Optical Brightener Market Size in Synthetics & Plastics Application, By Region, 2013–2020 (USD Million)
Table 14 Optical Brighteners Market Size in Other Applications, By Region, 2013–2020 (Kiloton)
Table 15 Optical Brightener Market Size in Other Applications, By Region, 2013–2020 (USD Million)
Table 16 Optical Brighteners Market Size in Consumer Products End User Segment, (Kiloton), 2013–2020
Table 17 Optical Brightener Market Size in Consumer Products End User Segment, (USD Million), 2013–2020
Table 18 Optical Brighteners Market Size in Security & Safety End User Segment, (Kiloton), 2013–2020
Table 19 Optical Brightener Market Size in Security & Safety End User Segment, (USD Million), 2013–2020
Table 20 Optical Brighteners Market Size in Textiles & Apparel End User Segment, (Kiloton), 2013–2020
Table 21 Optical Brightener Market Size in Textiles & Apparel End User Segment, (USD Million), 2013–2020
Table 22 Optical Brighteners Market Size in Packaging Segment (Kiloton), 2013–2020
Table 23 Optical Brightener Market Size in Packaging (USD Million), 2013–2020
Table 24 Optical Brighteners Market Size in Other End User Segments (Kiloton), 2013–2020
Table 25 Optical Brightener Market Size in Other End User Segments (USD Million), 2013–2020
Table 26 Optical Brighteners Market, By Region, 2013-2020 (Kiloton)
Table 27 Optical Brightener Market, By Region, 2013-2020 (USD Million)
Table 28 Optical Brighteners Market Size, By Type, 2013-2020 (Kiloton)
Table 29 Optical Brightener Market Size, By Type, 2013-2020 (USD Million)
Table 30 North America: Optical Brighteners Market, By Country, 2013-2020 (Kiloton)
Table 31 North America: Market, By Country, 2013-2020 (USD Million)
Table 32 North America: Market, By Application, 2013-2020 (Kiloton)
Table 33 North America: Market , By Application, 2013-2020 (USD Million)
Table 34 North America: Market, By End User, 2013-2020 (Kiloton)
Table 35 North America: Market, By End User, 2013-2020 (USD Million)
Table 36 U.S.: Optical Brighteners Market Size, By Application, 2013-2020 (Kiloton)
Table 37 U.S.: Market Size, By Application, 2013-2020 (USD Million)
Table 38 U.S.: Market, By End User, 2013-2020 (Kiloton)
Table 39 U.S.: Market, By End User, 2013-2020 (USD Million)
Table 40 Rest of North America: Optical Brighteners Market Size, By Application, 2013-2020 (Kiloton)
Table 41 Rest of North America: Market Size, By Application, 2013-2020 (USD Million)
Table 42 Rest of North America: Market, By End User, 2013-2020 (Kiloton)
Table 43 Rest of North America: Market, By End User, 2013-2020 (USD Million)
Table 44 Europe: Optical Brighteners Market, By Country, 2013-2020 (Kiloton)
Table 45 Europe: Market, By Country, 2013-2020 (USD Million)
Table 46 Europe: Market, By Application, 2013-2020 (Kiloton)
Table 47 Europe: Market, By Application, 2013-2020 (USD Million)
Table 48 Europe: Market, By End User, 2013-2020 (Kiloton)
Table 49 Europe: Market, By End User, 2013-2020 (USD Million)
Table 50 Germany: Optical Brighteners Market Size, By Application, 2013-2020 (Kiloton)
Table 51 Germany: Market Size, By Application, 2013-2020 (USD Million)
Table 52 Germany: Market, By End User, 2013-2020 (Kiloton)
Table 53 Germany: Market, By End User, 2013-2020 (USD Million)
Table 54 France: Optical Brighteners Market Size, By Application, 2013-2020 (Kiloton)
Table 55 France: Market Size, By Application, 2013-2020 (USD Million)
Table 56 France: Market, By End User, 2013-2020 (Kiloton)
Table 57 France: Market , By End User, 2013-2020 (USD Million)
Table 58 Italy: Optical Brighteners Market Size, By Application, 2013-2020 (Kiloton)
Table 59 Italy: Market Size, By Application, 2013-2020 (USD Million)
Table 60 Italy: Market, By End User, 2013-2020 (Kiloton)
Table 61 Italy: Market, By End User, 2013-2020 (USD Million)
Table 62 U.K.: Optical Brighteners Market Size, By Application, 2013-2020 (Kiloton)
Table 63 U.K.: Market Size, By Application, 2013-2020 (USD Million)
Table 64 U.K.: Market, By End User, 2013-2020 (Kiloton)
Table 65 U.K.: Market , By End User, 2013-2020 (USD Million)
Table 66 Rest of Europe: Optical Brighteners Market Size, By Application, 2013-2020 (Kiloton)
Table 67 Rest of Europe: Market Size, By Application, 2013-2020 (USD Million)
Table 68 Rest of Europe: Market, By End User, 2013-2020 (Kiloton)
Table 69 Rest of Europe: Market, By End User, 2013-2020 (USD Million)
Table 70 Asia-Pacific: Optical Brighteners Market Size, By Country, 2013-2020 (Kiloton)
Table 71 Asia-Pacific: Market Size, By Country, 2013-2020 (USD Million)
Table 72 Asia-Pacific: Market, By Application, 2013-2020 (Kiloton)
Table 73 Asia-Pacific: Market, By Application, 2013-2020 (USD Million)
Table 74 Asia-Pacific: Market, By End User, 2013-2020 (Kiloton)
Table 75 Asia-Pacific: Market, By End User, 2013-2020 (USD Million)
Table 76 China: Optical Brighteners Market Size, By Application, 2013-2020 (Kiloton)
Table 77 China: Market Size, By Application, 2013-2020 (USD Million)
Table 78 China: Market, By End User, 2013-2020 (Kiloton)
Table 79 China: Market , By End User, 2013-2020 (USD Million)
Table 80 India: Optical Brighteners Market Size, By Application, 2013-2020 (Kiloton)
Table 81 India: Market Size, By Application, 2013-2020 (USD Million)
Table 82 India: Market, By End User, 2013-2020 (Kiloton)
Table 83 India: Market, By End User, 2013-2020 (USD Million)
Table 84 Japan: Optical Brighteners Market Size, By Application, 2013-2020 (Kiloton)
Table 85 Japan: Market Size, By Application, 2013-2020 (USD Million)
Table 86 Japan: Market, By End User, 2013-2020 (Kiloton)
Table 87 Japan: Market , By End User, 2013-2020 (USD Million)
Table 88 South Korea: Optical Brighteners Market Size, By Application, 2013-2020 (Kiloton)
Table 89 South Korea: Market Size, By Application, 2013-2020 (USD Million)
Table 90 South Korea: Market, By End User, 2013-2020 (Kiloton)
Table 91 South Korea: Market , By End User, 2013-2020 (USD Million)
Table 92 Rest of Asia-Pacific: Optical Brighteners Market Size, By Application, 2013-2020 (Kiloton)
Table 93 Rest of Asia-Pacific: Market Size, By Application, 2013-2020 (USD Million)
Table 94 Rest of Asia-Pacific: Market, By End User, 2013-2020 (Kiloton)
Table 95 Rest of Asia-Pacific: Market , By End User, 2013-2020 (USD Million)
Table 96 RoW: Optical Brighteners Market Size, By Region, 2013-2020 (Kiloton)
Table 97 RoW: Market Size, By Region, 2013-2020 (USD Million)
Table 98 RoW: Market, By Application, 2013-2020 (Kiloton)
Table 99 RoW: Market , By Application, 2013-2020 (USD Million)
Table 100 RoW: Market, By End User, 2013-2020 (Kiloton)
Table 101 RoW: Market, By End User, 2013-2020 (USD Million)
Table 102 South America: Optical Brighteners Market Size, By Application, 2013-2020 (Kiloton)
Table 103 South America: Market Size, By Application, 2013-2020 (USD Million)
Table 104 South America: Market, By End User, 2013-2020 (Kiloton)
Table 105 South America: Market, By End User, 2013-2020 (USD Million)
Table 106 Middle East & Africa: Optical Brighteners Market Size, By Application, 2013-2020 (Kiloton)
Table 107 Middle East & Africa: Market Size, By Application, 2013-2020 (USD Million)
Table 108 Middle East & Africa: Market, By End User, 2013-2020 (Kiloton)
Table 109 Middle East & Africa: Market, By End User, 2013-2020 (USD Million)
Table 110 New Product Launch
Table 111 Expansion
Table 112 Merger & Acquisition
Table 113 RPM: Products Offered
Table 114 BASF SE: Products Offered
Table 115 Huntsman Corp.: Products Offered
Table 116 Clariant AG.: Products Offered
Table 117 Keystone Aniline Corporation: Products Offered
Table 118 Brilliant Group: Products Offered
Table 119 Aron Universal Ltd.: Products Offered
Table 120 3V Inc.: Products Offered
Table 121 TEH Fong Min International Co. Ltd.: Products Offered
Table 122 Archroma: Products Offered
List of Figures (49 Figures)
Figure 1 Research Methodology
Figure 2 Market Size Estimation Methodology: Bottom-Up Approach
Figure 3 Market Size Estimation Methodology: Top-Down Approach
Figure 4 Data Triangulation: Optical Brighteners Market
Figure 5 Other Optical Brighteners are Projected to Register Higher CAGR Than Stilbene Brighteners
Figure 6 Paper and Fabric Applications Contributed for the Maximum Share of the Optical Brighteners Market
Figure 7 Asia-Pacific Dominated the Optical Brightener Market, in Terms of Volume, in 2014
Figure 8 Optical Brighteners Market Size, 2015 vs 2020 (USD Million)
Figure 9 Europe is Projected to Be the Most Dominant Region and Paper to Be the Most Dominant Application
Figure 10 Asia-Pacific is Projected to Dominate the Optical Brighteners Market (2015–2020)
Figure 11 Paper Accounted for the Largest Market Share Across All Regions in 2014
Figure 12 Optical Brighteners Market, By Application
Figure 13 Optical Brightener Market, By End User
Figure 14 Optical Brighteners Market, By Region
Figure 15 Optical Brightener Market: Market Dynamics
Figure 16 Optical Brighteners Market: Value-Chain Analysis
Figure 17 Porter’s Five Forces Analysis
Figure 18 Paper is the Largest Application of Optical Brighteners Followed By Fabrics in Terms of Volume (KT)
Figure 19 Asia-Pacific is the Fastest-Growing Market for Optical Brighteners in Paper Application
Figure 20 Europe is the Largest Consumer for Optical Brighteners in Fabrics Application
Figure 21 Asia-Pacific is the Fastest-Growing Market for Optical Brighteners in Detergents & Soaps Application
Figure 22 Asia-Pacific is the Largest Consumer of Optical Brighteners in Synthetics & Plastics Application
Figure 23 Asia-Pacific is the Fastest-Growing Market for Optical Brighteners in Other Applications
Figure 24 Consumer Products is the Largest End-Use Segment of Optical Brighteners Followed By Security & Safety
Figure 25 Asia Pacific is the Fastest-Growing Market for Optical Brighteners in Consumer Products End User Segment
Figure 26 Europe is the Largest Consumer of Optical Brighteners in Security & Safety End User Segment
Figure 27 Asia-Pacific is the Fastest-Growing Market for Optical Brighteners in Textiles & Apparel End User Segment
Figure 28 Europe is the Largest Consumer of Optical Brighteners in Packaging Segment
Figure 29 Asia Pacific is the Fastest-Growing Market for Optical Brighteners in Other End User Segments
Figure 30 Regional Snapshot – Rapid Growth Markets are Emerging as New Hotspots
Figure 31 North American Market Snapshot: Increase in Consumption of Optical Brighteners (2015-2020)
Figure 32 Paper Application Dominates the Optical Brighteners Market in the U.S.
Figure 33 Europe Snapshot: Country Wise Consumption of Optical Brighteners in Paper, Fabrics, and Detergents & Soaps in 2014
Figure 34 China Dominates the Optical Brightener Market in Asia-Pacific
Figure 35 Asia-Pacific: Country Wise Consumption in Paper, Fabrics, and Detergents & Soap (Kiloton) in 2014
Figure 36 Companies Adopted New Product Launch as the Key Growth Strategy in the Last Three Years
Figure 37 Top Companies Adopted New Product Launch as the Key Growth Strategy Between 2012 and 2015
Figure 38 Major Growth Strategies for Acquiring Market Share, 2012–2015
Figure 39 Regional Revenue Mix of Top Market Players
Figure 40 RPM: Company Snapshot
Figure 41 RPM: SWOT Analysis
Figure 42 BASF SE: Company Snapshot
Figure 43 BASF SE: SWOT Analysis
Figure 44 Huntsman Corp.: Company Snapshot
Figure 45 Huntsman Corp.: SWOT Analysis
Figure 46 Clariant AG.: Company Snapshot
Figure 47 Clariant AG.: SWOT Analysis
Figure 48 Marketsandmarkets Knowledge Store Snapshot
Figure 49 Marketsandmarkets Knowledge Store: Chemicals & Material Industry Snapshot


Growth opportunities and latent adjacency in Optical Brighteners Market