Performance Fabric Market by Type (Coated Fabrics, Polyamide, Polyester, Composite Fabrics, & Aramid), Application (Water, Stain, Abrasion, Fire, U.V. Resistance & Anti-Microbial), End-Use Industry and by Region - Global Trends & Forecast to 2020


[203 Pages Report] The global performance fabric market is projected to register a CAGR of 4.8% between 2015 and 2020 to reach a market size of USD 79.55 Billion by 2020. The market is currently growing on account of the technological developments in performance fabrics and the increasing demand for higher functionality and comfort fabrics from end-use industries. The base year taken for estimating the market figures of 2015 in the report is 2014. This report contains forecasts for the market between 2015 and 2020.
The demand for performance fabrics is expected to increase at a rapid pace in North America region on account of the rising awareness for personal hygiene and physical fitness. The recovery of the construction and industrial sectors and the rising threats to the homeland security in the region is also driving the growth of the market.
The anti-microbial segment is projected to be the fastest-growing application for performance fabrics during the forecast period.
The performance fabric market has been analyzed in terms of revenue (USD) and volume (Million Square Meter) for all major regions, namely, North America, Asia-Pacific, Europe, South America, and the Middle East & Africa. The market has been further categorized on the basis of major countries for each of the respective regions. The various performance fabrics applications that have been identified and covered in the report are water resistance, stain resistance, abrasion resistance, anti-microbial, fire resistance, and U.V. resistance. The market is also segmented on the basis of types, such as, coated fabrics, polyamide, high-tenacity polyester, composite fabrics, and aramid, among others; and on the basis of end-use industry - industrial, defense & public safety, construction, aerospace & automotive, fire-fighting, and sports apparel, among others.
Various secondary sources such as encyclopedia, directories, technical handbooks, company annual reports, industry association publications, defense magazine articles, world economic outlook, trade websites, and databases have been referred to identify and collect information useful for this extensive commercial study of the market. The primary sources - experts from related industries and suppliers � have been interviewed to obtain and verify critical information as well as to assess the future prospects and market estimations.
The report strives to answer various questions about the performance fabric market for various players such as fiber manufacturers, performance fabric manufacturers, defense & industrial protective clothing manufacturers, armor manufacturers, and sports apparel manufacturers, among others.
Scope of the Report
On the basis of Region:
- North America
- Asia-Pacific
- Europe
- South America
- Middle East & Africa
On the basis Applications:
- Water resistance
- Stain resistance
- Abrasion resistance
- Anti-microbial
- Fire resistance
- U.V. resistance
- Others
On the basis of type:
- Coated fabrics
- Polyamide
- High-tenacity polyester
- Composite fabrics
- Aramid
- Others
On the basis of end-use industry:
- Industrial
- Defense & public safety
- Construction
- Fire-fighting
- Aerospace & automotive
- Sports apparel
- Others
The various customizations available for this report are:
Product Analysis
- Product Matrix that gives a detailed comparison of product portfolio of each company
Regional Analysis
- Further breakdown of a region with respect to a particular country
Company Information
- Detailed analysis and profiling of additional market players (up to five)
The performance fabric market is projected to reach 79.55 Billion by 2020, registering a CAGR of 4.8% between 2015 and 2020. Increasing awareness regarding personal hygiene and physical fitness and advancement in performance fabric production technology are the major drivers of the market.
The market is witnessing high growth on account of increasing demand from industrial, defense & public safety, construction, aerospace & automotive, and sports apparel industries. Changing warfare and working conditions in industrial facilities, along with the stringency in rules and regulations regarding employee safety, are driving the growth of the market as well. The market in the defense & public safety industry is projected to witness the highest growth between 2015 and 2020.
Coated fabrics dominate the performance fabric market due to their low cost, higher functionality, and wide application base. Aramid are the fastest-growing performance fabric type as they have high strength-to-weight ratio, making it desirable for use in a number of end-use industries such as defense & public safety, fire-fighting, industrial, and aerospace & automotive.
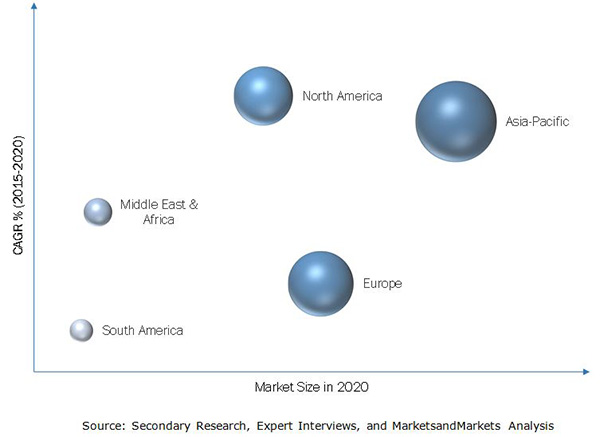
Asia-Pacific is the largest market for performance fabrics and will continue to dominate the market in 2020. China is the major performance fabric consumer in the region, as well as on a global level, on account of the low cost of performance fabric production, change in lifestyle of the people in the region, and increasing importance given for industrial and defense protective clothing. North America is projected to be the fastest-growing market for performance fabrics. The market in North America is driven by increasing awareness for personal hygiene and physical fitness and the recovery of the construction and manufacturing sectors. Stringent implementation of rules and regulations regarding worker�s safety also help drive the demand for performance fabrics in North America.
Below is the graph representing the performance fabrics market.
The performance fabric market is moderately competitive as it is mature. The market has a large number of active players. Performance fabric manufacturers focus more on bringing innovation in their products and on expanding their market reach and production capacity.
There are many global players in the performance fabric market manufacturing and marketing a particular type of performance fabric. The leading players in the market such as DuPont (U.S.), Royal TenCate N.V. (Netherlands), Toray Industries (Japan), Hexcel (U.S.) and Omnova Solutions (U.S.), among others have been focusing on new product launch, expansions, and merger and acquisitions, among other strategies to increase their market share.
 Exclusive indicates content/data unique to MarketsandMarkets and not available with any competitors.
Table of Contents
1 Introduction (Page No. - 17)
1.1 Objectives of the Study
1.2 Market Definition
1.3 Market Scope
1.3.1 Markets Covered
1.3.2 By Region
1.3.3 Years Considered for the Study
1.4 Currency
1.5 Package Size
1.6 Stakeholders
2 Research Methodology (Page No. - 20)
2.1 Research Data
2.1.1 Secondary Data
2.1.1.1 Key Data From Secondary Sources
2.1.1.2 Primary Data
2.1.1.3 Key Data From Primary Sources
2.1.1.4 Key Industry Insights
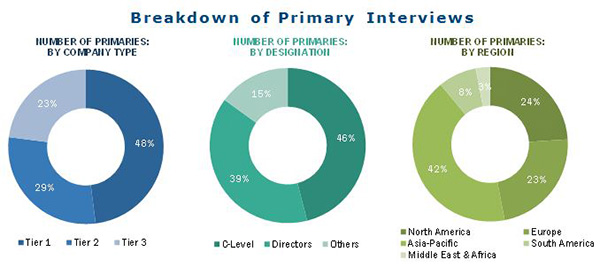
2.1.1.5 Breakdown of Primary Interviews
2.2 Market Size Estimation
2.2.1 Bottom-Up Approach
2.2.2 Top-Down Approach
2.3 Market Breakdown and Data Triangulation
2.4 Assumptions
2.5 Limitations
3 Executive Summary (Page No. - 28)
4 Premium Insights (Page No. - 32)
4.1 Attractive Market Opportunities for Performance Fabrics Manufacturers
4.2 Rapid Growth in the Global Performance Fabric Market
4.3 Market Attractiveness, By Type, 2015
4.4 Life Cycle Analysis
5 Market Overview (Page No. - 37)
5.1 Introduction
5.2 Market Segmentation
5.2.1 By Type
5.2.2 By Application
5.2.3 By End-Use Industry
5.2.4 By Region
5.3 Market Dynamics
5.3.1 Drivers
5.3.1.1 Increasing Demand for Comfort and Functionality in Fabrics
5.3.1.2 Increasing Use of Performance Fabrics in End-Use Industries
5.3.1.3 Stringent Regulations and Increasing Concerns for Worker�s Safety
5.3.2 Restraints
5.3.2.1 Availability of Substitutes
5.3.3 Opportunities
5.3.3.1 Potential Opportunities in New Applications
5.3.3.2 Innovative Product Development in Protective Clothing and Sports Apparel Segment
5.3.4 Challenges
5.3.4.1 Lack of Safety Compliance
5.4 Value-Chain Analysis
5.4.1 Raw Materials
5.4.2 Manufacturing
5.4.3 Distribution
5.4.4 Marketing and Sales
5.5 Porter�s Five Forces Analysis
5.5.1 Threat of New Entrants
5.5.2 Bargaining Power of Suppliers
5.5.3 Threat of Substitutes
5.5.4 Bargaining Power of Buyers
5.5.5 Intensity of Rivalry
5.6 Policies and Regulations
5.6.1 Abrasion Resistance
5.6.1.1 Astm D4157-07
5.6.1.2 Astm D4966-98
5.6.2 Stain Resistance
5.6.2.1 Ec 2005/29
5.6.2.2 The Astm Dm4265 Standard for Evaluating Stain Removal in Home Laundering
5.6.3 UV Resistance
5.6.3.1 U.S.
5.6.3.2 British Standards
5.6.3.3 Australia and New Zealand
5.6.4 Anti-Microbial
5.6.4.1 Directive 98/8 Ec Placing Biocide Products on the Market
5.6.5 Fire and Heat Resistance
6 Performance Fabric Market, By Type (Page No. - 54)
6.1 Introduction
6.2 Coated Fabrics
6.2.1 Most Widely Used Performance Fabrics
6.2.2 Polymer Coated Fabrics
6.2.2.1 Vinyl Coated Fabrics
6.2.2.2 Polyurethane Coated Fabrics
6.2.2.3 Polyethylene Coated Fabrics
6.2.3 Rubber Coated Fabrics
6.2.4 Fabric Backed Wall Coverings
6.3 Polyamide
6.3.1 Polyamide to Register Highest Growth in North America
6.4 High-Tenacity Polyester
6.4.1 High-Tenacity Polyester to Register Highest Growth in Asia-Pacific
6.5 Composite Fabrics
6.5.1 Composite Fabrics to Register Highest Growth in Asia-Pacific
6.6 Aramid
6.6.1 Aramid Fiber Projected to Register Highest Growth in Asia-Pacific
6.6.2 Para-Aramid
6.6.3 Meta-Aramid
6.6.4 Other Aramid Fibers
6.6.4.1 Co-Polymer Aramid Fibers
6.6.4.2 Terpolyaramid Fibers
6.7 Other Performance Fabrics
6.7.1 Other Performance Fabrics to Register Highest Growth in Europe
7 Performance Fabric Market, By Application (Page No. - 74)
7.1 Introduction
7.2 Water Resistance
7.2.1 Increasing Demand for Water Resistant Fabrics Driving the Performance Fabric Market in North America
7.3 Stain Resistance
7.3.1 Demand for Stain Resistant Fabrics Rising in Asia-Pacific and North America
7.4 Abrasion Resistance
7.4.1 North America to Offer High Growth Opportunity for Performance Fabrics in Abrasion Resistance Application
7.5 Anti-Microbial
7.5.1 Anti-Microbial Performance Fabrics to Witness High Demand in North America
7.6 Fire Resistance
7.6.1 High Demand for Performance Fabrics in Middle East & Africa in Fire Resistance Application
7.7 UV Resistance
7.7.1 Middle East & Africa to Show High Growth Potential in UV Resistance Application
7.8 Other Applications
7.8.1 Asia-Pacific Offers High Growth Potential for Other Applications
8 Performance Fabric Market, By End-Use Industry (Page No. - 94)
8.1 Introduction
8.2 Industrial
8.2.1 Industrial Demand for Performance Fabrics Rising Due to Imposition of Stringent Regulations
8.3 Defence & Public Safety
8.4 Construction
8.4.1 Demand Growing on Account of High Strength to Weight Ratio of Performance Fabrics
8.5 Fire-Fighting
8.5.1 Governmental Regulations Driving Market Growth in Fire-Fighting Sector
8.6 Aerospace & Automotive
8.6.1 Europe is the Largest Market in Aerospace & Automotive Segment
8.7 Sports Apparel
8.7.1 Increasing Demand for Comfort and Functionality Driving Growth in the Sports Apparel Sector
8.8 Other End-Use Industries
8.8.1 Asia-Pacific Offers High Growth Potential for Other End-Use Industries
9 Performance Fabric Market, By Region (Page No. - 107)
9.1 Introduction
9.2 Asia-Pacific
9.2.1 China
9.2.2 India
9.2.3 South Korea
9.2.4 Rest of Asia-Pacific
9.3 Europe
9.3.1 Germany
9.3.2 U.K.
9.3.3 Italy
9.3.4 Rest of Europe
9.4 North America
9.4.1 U.S.
9.4.2 Canada
9.4.3 Mexico
9.5 Middle East & Africa
9.6 South America
10 Competitive Landscape (Page No. - 149)
10.1 Overview
10.2 New Product Launch: the Most Popular Growth Strategy
10.3 Maximum Developments in 2013
10.4 Competitive Situations and Trends
10.4.1 New Product Launch
10.4.2 Expansion
10.4.3 Merger & Acquisition
10.4.4 Partnership & Collaboration
10.4.5 Others
11 Company Profiles (Page No. - 164)
(Overview, Products & Services, Strategies & Insights, Developments and Mnm View)*
11.1 Introduction
11.2 E.I. Dupont De Nemours and Company
11.3 Hexcel Corporation
11.4 Sigmatex Ltd.
11.5 Toray Industries Inc.
11.6 Royal Tencate N.V.
11.7 Takata Corporation
11.8 Omnova Solutions Inc.
11.9 Spradling International Inc.
11.10 Invista S.A.R.L. (Koch Industries, Inc.)
11.11 Milliken & Company
11.12 W.L. Gore & Associates Inc.
11.13 Teijin Ltd.
*Details on Overview, Products & Services, Strategies & Insights, Developments and Mnm View Might Not Be Captured in Case of Unlisted Companies.
12 Appendix (Page No. - 197)
12.1 Insights From Industry Experts
12.2 Discussion Guide
12.3 Introducing RT: Real-Time Market Intelligence
12.4 Available Customizations
12.5 Related Reports
List of Tables (111 Tables)
Table 1 Performance Fabric Market Segmentation, By Type
Table 2 U.S.: Ppe Provisions and Standards
Table 3 Direct and Hidden Costs of Workplace Accidents
Table 4 Performance Fabric Market Size, By Type, 2013-2020 (Million Square Meter)
Table 5 Performance Fabric Market Size, By Type, 2013-2020 (USD Million)
Table 6 Leading Companies Manufacturing Coated Fabrics
Table 7 Coated Fabrics Market Size, By Region, 2013-2020 (Million Square Meter)
Table 8 Coated Fabrics Market Size, By Region, 2013-2020 (USD Million)
Table 9 Leading Companies Producing Ceramics and Composites
Table 10 Polyamide Market Size, By Region, 2013-2020 (Million Square Meter)
Table 11 Polyamide Market Size, By Region, 2013-2020 (USD Million)
Table 12 Leading Companies Producing High-Tenacity Polyester
Table 13 High-Tenacity Polyester Market Size, By Region, 2013-2020 (Million Square Meter)
Table 14 High-Tenacity Polyester Market Size, By Region, 2013-2020 (USD Million)
Table 15 Leading Companies Producing Composite Fabrics
Table 16 Composite Fabrics Market Size, By Region, 2013-2020 (Million Square Meter)
Table 17 Composite Fabrics Fiber Market Size, By Region, 2013-2020 (USD Million)
Table 18 Leading Companies Producing Aramid
Table 19 Aramid Market Size, By Region, 2013-2020 (Million Square Meter)
Table 20 Aramid Market Size, By Region, 2013-2020 (USD Million)
Table 21 Other Performance Fabric Market Size, By Region, 2013-2020 (Million Square Meter)
Table 22 Other Performance Fabric Market Size, By Region, 2013-2020 (USD Million)
Table 23 Performance Fabric Market Size, By Application, 2013-2020 (Million Square Meter)
Table 24 Market Size, By Application, 2013-2020 (USD Million)
Table 25 Performance Fabric Market Size in Water Resistance Application, By Region, 2013-2020 (Million Square Meter)
Table 26 Performance Fabric Market Size in Water Resistance Application, By Region, 2013-2020 (USD Million)
Table 27 Performance Fabric Market Size in Stain Resistance Application, By Region, 2013-2020 (Million Square Meter)
Table 28 Performance Fabric Market Size in Stain Resistance Application, By Region, 2013-2020 (USD Million)
Table 29 Market Size in Abrasion Resistance Application, By Region, 2013-2020 (Million Square Meter)
Table 30 Market Size in Abrasion Resistance Application, By Region, 2013-2020 (USD Million)
Table 31 Performance Fabric Market Size in Anti-Microbial, By Region, 2013-2020 (Million Square Meter)
Table 32 Market Size in Anti-Microbial, By Region, 2013-2020 (USD Million)
Table 33 Market Size in Fire Resistance Application, By Region, 2013-2020 (Million Square Meter)
Table 34 Performance Fabric Market Size in Fire Resistance Application, By Region, 2013-2020 (USD Million)
Table 35 Market Size in UV Resistance Application, By Region, 2013-2020 (Million Square Meter)
Table 36 Market Size in UV Resistance Application, By Region, 2013-2020 (USD Million)
Table 37 Market Size in Other Applications Segment, By Region, 2013-2020 (Million Square Meter)
Table 38 Market Size in Other Applications Segment, By Region, 2013-2020 (USD Million)
Table 39 Market Size, By End-Use Industry, 2013-2020 (USD Million)
Table 40 Market Size in Industrial End-Use Industry, By Region, 2013-2020 (USD Million)
Table 41 Market Size in Defence & Public Safety, By Region, 2013-2020 (USD Million)
Table 42 Performance Fabric Market Size in Construction, By Region, 2013-2020 (USD Million)
Table 43 Performance Fabric Market Size in Fire-Fighting, By Region, 2013-2020 (USD Million)
Table 44 Performance Fabric Market Size in Aerospace & Automotive, By Region, 2013-2020 (USD Million)
Table 45 Performance Fabric Market Size in Sports Apparel, By Region, 2013-2020 (USD Million)
Table 46 Performance Fabric Market Size in Other End-Use Industries, By Region, 2013-2020 (USD Million)
Table 47 Performance Fabric Market Size, By Region, 2013-2020 ( Million Square Meter)
Table 48 Performance Fabric Market Size, By Region, 2013-2020 (USD Million)
Table 49 Asia-Pacific: Performance Fabric Market Size, By Country, 2013-2020 (Million Square Meter)
Table 50 Asia-Pacific: Market Size, By Country, 2013-2020 (USD Million)
Table 51 Asia-Pacific: Market Size, By Type, 2013-2020 (Million Square Meter)
Table 52 Asia-Pacific: Market Size, By Type, 2013-2020 (USD Million)
Table 53 Asia-Pacific: Market Size, By Application, 2013-2020 (Million Square Meter)
Table 54 Asia-Pacific: Market Size, By Application, 2013-2020 (USD Million)
Table 55 Asia-Pacific: Market Size, By End-Use Industry, 2013-2020 (USD Million)
Table 56 China: Performance Fabric Market Size, By Application, 2013-2020 (Million Square Meter)
Table 57 China: Market Size, By Application, 2013-2020 (USD Million)
Table 58 China: Market Size, By End-Use Industry, 2013-2020 (USD Million)
Table 59 India: Performance Fabric Market Size, By Application, 2013-2020 (Million Square Meter)
Table 60 India: Market Size, By Application, 2013-2020 (USD Million)
Table 61 India: Market Size, By End-Use Industry, 2013-2020 (USD Million)
Table 62 South Korea: Performance Fabric Market Size, By Application, 2013-2020 (Million Square Meter)
Table 63 South Korea: Market Size, By Application, 2013-2020 (USD Million)
Table 64 South Korea: Market Size, By End-Use Industry, 2013-2020 (USD Million)
Table 65 Europe: Performance Fabric Market Size, By Country, 2013-2020 (Million Square Meter)
Table 66 Europe: Market Size, By Country, 2013-2020 (USD Million)
Table 67 Europe: Market Size, By Type, 2013-2020 (Million Square Meter)
Table 68 Europe: Market Size, By Type, 2013-2020 (USD Million)
Table 69 Europe: Market Size, By Application, 2013-2020 (Million Square Meter)
Table 70 Europe: Market Size, By Application, 2013-2020 (USD Million)
Table 71 Europe: Market Size, By End-Use Industry, 2013-2020 (USD Million)
Table 72 Germany: Performance Fabric Market Size, By Application, 2013-2020 (Million Square Meter)
Table 73 Germany: Market Size, By Application, 2013-2020 (USD Million)
Table 74 Germany: Market Size, By End-Use Industry, 2013-2020 (USD Million)
Table 75 U.K.: Performance Fabric Market Size, By Application, 2013-2020 (Million Square Meter)
Table 76 U.K.: Market Size, By Application, 2013-2020 (USD Million)
Table 77 U.K.: Market Size, By End-Use Industry, 2013-2020 (USD Million)
Table 78 Italy: Performance Fabric Market Size, By Application, 2013-2020 (Million Square Meter
Table 79 Italy: Market Size, By Application, 2013-2020 (USD Million)
Table 80 Italy: Market Size, By End-Use Industry, 2013-2020 (USD Million)
Table 81 North America: Performance Fabric Market Size, By Country, 2013-2020 (Million Square Meter)
Table 82 North America: Performance Fabric Market Size, By Country, 2013-2020 (USD Million)
Table 83 North America: Market Size, By Type, 2013-2020 (Million Square Meter)
Table 84 North America: Market Size, By Type, 2013-2020 (USD Million)
Table 85 North America: Market Size, By Application, 2013-2020 (Million Square Meter)
Table 86 North America: Market Size, By Application, 2013-2020 (USD Million)
Table 87 North America: Market Size, By End-Use Industry, 2013-2020 (USD Million)
Table 88 U.S.: Performance Fabric Market Size, By Application, 2013-2020 (Million Square Meter)
Table 89 U.S.: Market Size, By Application, 2013-2020 (USD Million)
Table 90 U.S.: Market Size, By End-Use Industry, 2013-2020 (USD Million)
Table 91 Canada: Performance Fabric Market Size, By Application, 2013-2020 (Million Square Meter)
Table 92 Canada: Performance Fabric Market Size, By Application, 2013-2020 (USD Million)
Table 93 Canada: Market Size, By End-Use Industry, 2013-2020 (USD Million)
Table 94 Mexico: Performance Fabric Market Size, By Application, 2013-2020 (Million Square Meter)
Table 95 Mexico: Market Size, By Application, 2013-2020 (USD Million)
Table 96 Mexico: Market Size, By End-Use Industry, 2013-2020 (USD Million)
Table 97 Middle East & Africa: Market Size, By Type, 2013-2020 (Million Square Meter)
Table 98 Middle East & Africa: Market Size, By Type, 2013-2020 (USD Million)
Table 99 Middle East & Africa: Performance Fabric Market Size, By Application, 2013-2020 (Million Square Meter)
Table 100 Middle East & Africa: Market Size, By Application, 2013-2020 (USD Million)
Table 101 Middle East & Africa: Market Size, By End-Use Industry, 2013-2020 (USD Million)
Table 102 South America: Market Size, By Type, 2013-2020 (Million Square Meter)
Table 103 South America: Market Size, By Type, 2013-2020 (USD Million)
Table 104 South America: Market Size, By Application, 2013-2020 (Million Square Meter)
Table 105 South America: Market Size, By Application, 2013-2020 (USD Million)
Table 106 South America: Performance Fabric Market Size, By End-Use Industry, 2013-2020 (USD Million)
Table 107 New Product Launch, 2012�2015
Table 108 Expansion, 2012�2015
Table 109 Merger & Acquisition, 2012�2015
Table 110 Partnership & Collaboration, 2012�2015
Table 111 Others, 2012�2015
List of Figures (79 Figures)
Figure 1 Performance Fabric Market: Research Design
Figure 2 Market Size Estimation: Bottom-Up Approach
Figure 3 Market Size Estimation: Top-Down Approach
Figure 4 Data Triangulation: the Performance Fabric Market
Figure 5 Polyamide to Dominate Performance Fabric Market Til 2020
Figure 6 Performance Fabric arket, By Application
Figure 7 Anti-Microbial Application to Witness the Highest Growth During the Forecast Period
Figure 8 North America is Estimated to Be the Fastest Growing Market, 2015
Figure 9 Defense & Public Safety to Witness the Highest Growth in the Performance Fabric Market Between 2015 and 2020
Figure 10 Attractive Opportunities in the Performance Fabric Market
Figure 11 Performance Fabric Market: Water-Resistance the Largest Application
Figure 12 Coated Fabrics Lead the Performance Fabrics Market in 2015
Figure 13 Aramid to Be the Fastest Growing Performance Fabric Between 2015 and 2020
Figure 14 Mexico is Projected to Register the Highest Growth (2015 vs 2020)
Figure 15 Asia-Pacific: Largest Market for Performance Fabrics, 2015
Figure 16 Defense & Public Safety is Expected to Be the Fastest-Growing End-Use Industry for Performance Fabrics
Figure 17 The Market in Asia-Pacific to Witness Significant Growth After 2015
Figure 18 Performance Fabric Market Segmentation, By Application
Figure 19 Performance Fabrics Market Segmentation, By End-Use Industry
Figure 20 Performance Fabric Market, By Region
Figure 21 Overview of Factors Governing the Global Performance Fabrics Market
Figure 22 Maximum Value is Added During Manufacturing and R&D
Figure 23 Porter�s Five Forces Analysis: Performance Fabric Market
Figure 24 Performance Fabrics: By Type
Figure 25 Aramid and Composite Fabrics to Witness the Fastest Growth
Figure 26 Aramid to Experience Highest Growth Between 2015 and 2020
Figure 27 Asia-Pacific to Be the Fastest-Growing Market for Coated Fabrics Market (2015 vs 2020)
Figure 28 Coated Fabrics to Witness High Growth in Asia-Pacific Between 2015-2020
Figure 29 North America Projected to Be the Fastest-Growing Market for Polyamide
Figure 30 Polyamide to Witness Highest Growth in North America Between 2015 and 2020
Figure 31 Asia-Pacific to Be the Fastest-Growing Market for High-Tenacity Polyester
Figure 32 High-Tenacity Polyester to Witness Highest Growth in Asia-Pacific Between 2015 and 2020
Figure 33 Asia-Pacific to Be the Fastest-Growing Market for Composite Fabrics
Figure 34 Composite Fabrics Fiber to Witness Highest Growth in Asia-Pacific Between 2015 and 2020
Figure 35 Asia-Pacific Projected to Be the Fastest-Growing Market for Aramid
Figure 36 Aramid to Witness Highest Growth in Asia-Pacific Between 2015 and 2020
Figure 37 Performance Fabric arket in Anti-Microbial Application to Witness the Highest Growth
Figure 38 Anti-Microbial Application to Register Highest Growth, 2015�2020
Figure 39 Water Resistance Application to Witness High Growth in North America (2015 vs 2020)
Figure 40 North America Projected to Witness Highest Growth (Value) in Water Resistance Application
Figure 41 Asia-Pacific to Drive Growth in Stain Resistance Application Between 2015 and 2020
Figure 42 North America Driving Growth of Performance Fabric Market in Stain Resistance Application Between 2015 and 2020
Figure 43 Asia-Pacific and North America Market Projected to Register Highest CAGR in Abrasion Resistance Application Beetween 2015 and 2020d
Figure 44 Abrasion Resistance Application to Register Highest Growth in North American Performance Fabric Market
Figure 45 North America Projected to Register Highest CAGR in Anti-Microbial Application Segment Between 2015 and 2020
Figure 46 North America Driving the Growth of Performance Fabric Market in Anti-Microbial Application
Figure 47 Middle East & Africa Market Projected to Register Highest CAGR in Fire Resistance Application Segment (2015 and 2020)
Figure 48 Fire Resistance Application to Witness Highest Growth in Middle East & Africa
Figure 49 Middle East & Africa to Register Highest CAGR in UV Resistance Application Segment Between 2015 and 2020
Figure 50 Middle East & Africa to Offer High Value Growth for Performance Fabrics in UV Resistance Application
Figure 51 North America Projected to Register Highest CAGR in Other Application Segment Between 2015 and 2020
Figure 52 North America Performance Fabric Market to Register Fastest Growth in Other Applications Segment
Figure 53 Performance Fabrics Market in Defence & Public Safety to Register Highest Growth, (2015-2020)
Figure 54 Asia-Pacific to Be the Largest Market for Performance Fabrics in Industrial End-Use Segment
Figure 55 North America Driving Market Growth in Defence & Public Safety End-Use Industry Between 2015 and 2020
Figure 56 Asia-Pacific is the Largest Perfomance Fabric Market in Construction Segment
Figure 57 Europe is the Largest Market for Performance Fabric in Fire-Fighting Sector
Figure 58 North America to Register Highest Growth in the Aerospace & Automotive Industry
Figure 59 North America to Account for the Highest Growth in the Sports Apparel Industry
Figure 60 Asia-Pacific to Register High Growth in Other End-Use Industries Segment
Figure 61 Asia-Pacific to Witness Highest Growth Between 2015 and 2020
Figure 62 Asia-Pacific Projected to Emerge as the Fastest-Growing Performance Fabrics Market
Figure 63 Leading Countries in Performance Fabric Market: Mexico Projected to Be the Fastest Growing Market
Figure 64 China to Dominate Performance Fabric Market (2015 vs 2020)
Figure 65 Asia-Pacific: Performance Fabric Market Snapshot
Figure 66 China: Largest Market for Performance Fabrics in Asia-Pacific
Figure 67 European Performance Fabrics Market Snapshot: Germany Dominates the Market
Figure 68 Germany: Largest Market for Performance Fabrics in Europe
Figure 69 Companies Primarily Adopted Organic Growth Strategies
Figure 70 Key Growth Strategies in the Global Performance Fabric Market, 2012�2015
Figure 71 Developments in Performance Fabric Market, 2012�2015
Figure 72 Performance Fabric Market: Regional Revenue Mix
Figure 73 E.I. Dupont De Nemours & Company: Company Snapshot
Figure 74 Hexcel Corporation: Company Snapshot
Figure 75 Toray Industries Inc.: Company Snapshot
Figure 76 Royal Tencate N.V.: Company Snapshot
Figure 77 Takata Corporation : Company Snapshot
Figure 78 Omnova Solutions Inc.: Company Snapshot
Figure 79 Teijin Ltd.: Company Snapshot


Growth opportunities and latent adjacency in Performance Fabric Market