Plastic Waste Management Market by Service (Collection, Recycling), By Polymer Type (PP, LDPE), By Source (Residential, Commercial, Industrial), By End-Use Applications (Packaging, Building & Construction), Region - Global Forecast to 2024


Updated on : March 08, 2023
Plastic Waste Management Market
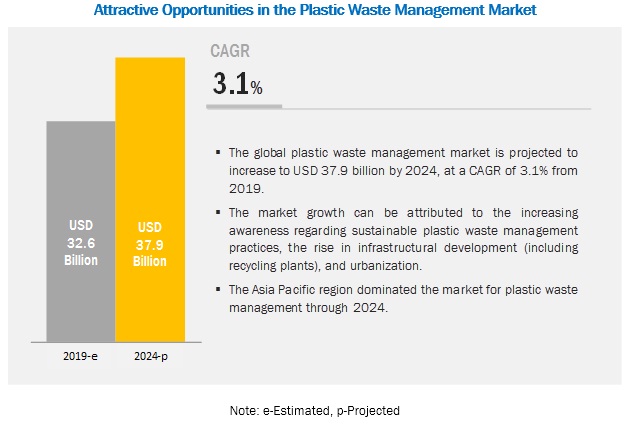
Plastic Waste Management Market was valued at USD 32.6 billion in 2019 and is projected to reach USD 37.9 billion by 2024, growing at a cagr 3.1% from 2019 to 2024. Factors such as economic growth, increasing urbanization, industrialization, and changing lifestyles of people have raised the levels of plastic waste generation, which has resulted in an increasing threat to the environment. The awareness about plastic waste management has increased significantly with the progress in consumer education and rising awareness about health & environment. The growing population and the growing income levels of people have generated new opportunities for the plastic waste management industry.
In terms of volume, the landfills segment is projected to lead the plastic waste management market from 2019 to 2024.
Based on service, the landfills segment is projected to dominate the plastic waste management market, in terms of volume, from 2019 to 2024. Presence of less number of recycling plants and incinerators leads to mismanagement of waste, contributing to the rise in plastic waste disposals and landfills.
In terms of value, the packaging segment in the recycled plastic waste market is projected to grow at the highest CAGR during the forecast period.
Based on the end-use application, the packaging segment in the recycled plastic waste market is projected to grow at the highest CAGR, in terms of value, during the forecast period. Various benefits of recycled plastics (such as reduction of pollution and lesser dependence on fossil fuels) and its wide application in sustainable packaging solutions (such as containers, bottles, bags, films, and other protective packaging products) drive its demand.
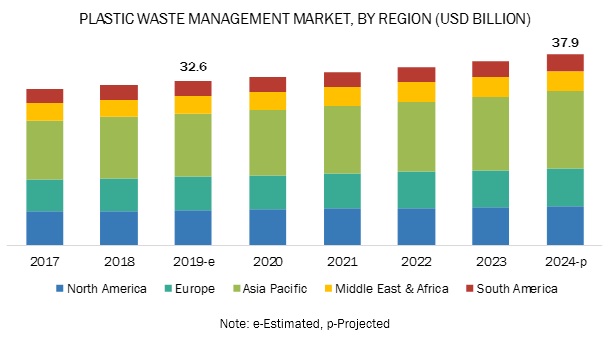
In terms of value, the Asia Pacific plastic waste management market is projected to grow at the highest CAGR during the forecast period.
The Asia Pacific plastic waste management industry is projected to grow at the highest CAGR from 2019 to 2024, in terms of value. The growing population, rising GDP, and increasing disposable income in Asia Pacific are leading to the generation of more solid waste (including plastic waste), which, in turn, is creating opportunities for the market in the region. Infrastructural development in under-developed and developing countries of Asia Pacific is driving the growth of various methods of plastic waste management in this region.
Key Market Players
Veolia Environnement (France), SUEZ (France), Waste Management, Inc. (US), Republic Services (US), Waste Connections Inc (Canada), Clean Harbors (US), Biffa (UK), Covanta Holding Corporation (US), Stericycle (US), and Remondis SE & Co. KG (Germany) are the key players operating in the plastic waste management market.
SUEZ is one of the key waste management service providers. It offers various services, such as collection & transportation of domestic & hazardous waste, treatment & storage, decontaminating, and marketing of recycled, secondary raw materials to help the municipalities, industries, and healthcare professionals in waste management. The company’s strong presence in the European market, along with its robust product & service portfolio, has helped it to establish a key position in the plastic waste management market. Its focus on growth strategies, such as expansions, contracts, new service developments, new product developments, joint ventures, and partnerships, will aid in its growth in the emerging and developed markets. For instance, in May 2018, SUEZ entered into a partnership with the French Confederation of Construction Tradesmen and Contractors (CAPEB) for raising awareness and knowledge among the construction contractors about improvement in the sorting and recovery of waste from building materials. This partnership also aimed at forecasting the co-development of solutions, which will enable construction specialists to meet the target set by France’s Energy Transition Law (for recovering 70% of building waste by 2020).
Scope of the Report
|
Report Metric |
Details |
|
Market size available for years |
2017–2024 |
|
Base year considered |
2018 |
|
Forecast period |
2019–2024 |
|
Forecast units |
Value (USD Billion) and Volume (Million Tons) |
|
Segments covered |
Service, Polymer, Source, End-use Application, and Region |
|
Geographies covered |
North America, Asia Pacific, Europe, South America, and the Middle East & Africa |
|
Companies covered |
Veolia Environnement (France), SUEZ (France), Waste Management, Inc. (US), Republic Services (US), Waste Connections Inc (Canada), Clean Harbors (US), Biffa (UK), Covanta Holding Corporation (US), Stericycle (US), and Remondis SE & Co. KG (Germany). |
This research report categorizes the plastic waste management market based on service, polymer, source, end-use application, and region.
Based on service:
- Collection & transportation
- Recycling
- Incineration
- Landfills
Based on polymer type:
- Polypropylene (PP)
- Low-density polyethylene (LDPE)
- High-density polyethylene (HDPE)
- Polyvinyl chloride (PVC)
- Polyurethane (PUR)
- Polystyrene (PS)
- Polyethylene
- terephthalate (PET)
- Others (thermoset and thermoplastics (not included in the above segmentation such as SPI code 7 plastics, melamine-formaldehyde, bakelite, and others polyester resins))
Based on source:
- Commercial & institutional
- Residential
- Industrial
- Others (waste generated due to construction & demolition activities and agricultural waste)
The Based on the end-use application:
- Packaging
- Building & construction
- Textile & clothing
- Automotive
- Furniture
- Others (electrical & electronic components and appliances; specific applications in aerospace & defense, toys, and other stationery products)
Based on the region:
- North America
- Europe
- Asia Pacific
- Middle East & Africa
- South America
Recent Developments
- In July 2019, SUEZ opened a packaging sorting plant in Germany. It is Europe's most advanced packaging sorting facility. The plant operations include sorting of lightweight packaging, with a capacity of 110,232 tons of waste. This expansion is expected to better the waste management processes in Germany.
- In May 2019, LC Packaging (Netherlands) and Veolia Netherlands signed a strategic partnership for the reduction of flexible packaging waste globally.
Key Questions Addressed by the Report:
- What are the global trends driving the demand for plastic waste management? Would the market witness an increase or decline in demand in the coming years?
- What is the estimated demand for different services of plastic waste management?
- Where will the strategic developments take the industry in the mid- to long-term?
- What are the upcoming industry trends for plastic waste management?
- Who are the major players in the plastic waste management market?
To speak to our analyst for a discussion on the above findings, click Speak to Analyst
 Exclusive indicates content/data unique to MarketsandMarkets and not available with any competitors.
Table of Contents
1 Introduction (Page No. - 21)
1.1 Objectives of the Study
1.2 Market Definition
1.3 Study Scope
1.3.1 Periodization Considered
1.4 Currency Considered
1.5 Units Considered
1.6 Stakeholders
2 Research Methodology (Page No. - 25)
2.1 Research Data
2.2 Market Size Estimation
2.2.1 Approach
2.2.1.1 Volume Market
2.2.1.1.1 Approach 1 (Based on Plastic Waste Generation, By Country)
2.2.1.1.2 Approach 2 (Based on Global Solid Waste Generation Market)
2.2.1.2 Value Market
2.2.1.2.1 Approach to Calculate the Market Size (Value) for A Country
2.3 Data Triangulation
2.4 Research Assumptions & Limitations
2.4.1 Assumptions
2.4.2 Limitations
3 Executive Summary (Page No. - 30)
3.1 Introduction
4 Premium Insights (Page No. - 34)
4.1 Developing Economies to Register High Growth in the Plastic Waste Management Market
4.2 Plastic Waste Management Market, By Source and Region
4.3 Plastic Waste Management Market, By Service
4.4 Recycled Plastic Waste Market, By End-Use Application
5 Market Overview (Page No. - 37)
5.1 Introduction
5.2 Market Dynamics
5.2.1 Drivers
5.2.1.1 Laws & Regulations Enforced By Governments
5.2.1.2 Increase in Awareness Programs Regarding Sustainable Waste Management Practices
5.2.1.3 Increasing Urbanization and Industrialization
5.2.1.4 Reduced Environmental Impact Through Plastic Recycling
5.2.2 Restraints
5.2.2.1 Less Participation of Source Sectors in the Management of Plastic Waste
5.2.2.2 Absence of the Required Framework for Plastic Waste Collection and Segregation
5.2.2.3 Fewer Treatment Plants and Lack of Expertise for the Recycling of Plastic Waste
5.2.3 Opportunities
5.2.3.1 Rising Demand From Emerging Economies
5.2.3.2 Public & Private Sector Partnership Helps Establish A Win-Win Situation to Both
5.2.4 Challenges
5.2.4.1 High Cost of Using Recycled Plastics
5.2.4.2 Difficulty in Managing the Supply Chain
6 Plastic Waste Management Market, By Service (Page No. - 43)
6.1 Introduction
6.2 Collection & Transportation
6.3 Recycling
6.4 Incineration
6.5 Landfills/Disposal
7 Plastic Waste Management Market, By Polymer Type (Page No. - 47)
7.1 Introduction
7.1.1 Plastic Waste Management Market, By Polymer Type
7.1.1.1 The PP Segment is Projected to Be the Fastest-Growing in the Plastic Waste Management Market, in Terms of Volume, During the Forecast Period
7.2 Polypropylene (PP)
7.2.1 The PP Segment Dominated the Plastic Waste Management Market in 2018
7.3 Low-Density Polyethylene (LDPE)
7.3.1 The LDPE Segment is Projected to Be the Second-Fastest-Growing Segment in the Plastic Waste Management Market During the Forecast Period
7.4 High-Density Polyethylene (HDPE)
7.4.1 The HDPE Segment is Estimated to Be the Third-Largest Segment in the Plastic Waste Management Market in 2019
7.5 Polyvinyl Chloride (PVC)
7.5.1 The Wide Properties of PVC Lead to Its Increased DemandFrom Different Applications
7.6 Polyurethane (PUR)
7.6.1 The PUR Segment is Projected to Experience Reduced Growth During the Forecast Period
7.7 Polystyrene (PS)
7.7.1 The Use of Polystyrene in A Wide Range of Applications
7.8 Polyethylene Terephthalate (PET)
7.8.1 Health Hazards Associated With the Use of PET Polymers Limiting their Growth
7.9 Others
7.9.1 The Others Segment is Projected to Register Slow Growth in the Plastic Waste Management Market During the Forecast Period
8 Plastic Waste Management Market, By Source (Page No. - 52)
8.1 Introduction
8.2 Residential
8.2.1 Increased Disposable Income, Rapid Urbanization, and Population Growth Have Led to the Increase in the Quantity of Plastic Waste
8.3 Industrial
8.3.1 The Industrial Segment is Projected to Be the Second-Largest Contributor of Plastic Waste
8.4 Commercial & Institutional
8.4.1 The Commercial & Institutional Segment is Estimated to Be the Third-Largest in the Plastic Waste Management Market in 2019
8.5 Others
8.5.1 The Others Segment is Projected to Register Slow Growth During the Forecast Period
9 Recycled Plastic Waste Market, By End-Use Application (Page No. - 55)
9.1 Introduction
9.2 Packaging
9.2.1 The Packaging Segment Dominated the Recycled Plastic Waste Market in 2018
9.3 Building & Construction
9.3.1 Growth in Sustainable Construction Driving the Demand for Recycled Plastics in the Building & Construction Segment
9.4 Textile & Clothing
9.4.1 Textile & Clothing Segment Estimated to Be the Third-LargestIn the Recycled Plastic Waste Market in 2019
9.5 Automotive
9.5.1 Demand for Recycled Plastics in the Automotive Industry Supported By Its Application in the Manufacturing of Vehicle Components
9.6 Furniture
9.6.1 Varied Applications of Plastics in Furniture Products Leading to their High Demand
9.7 Recycled Plastics in Other End-Use Applications
9.7.1 High Growth for Recycled Plastic Waste for Other End-Use Applications
10 Plastic Waste Management Market, By Region (Page No. - 60)
10.1 Introduction
10.2 Asia Pacific
10.2.1 China
10.2.1.1 The Chinese Plastic Waste Management Market is Projected to Grow at the Second-Highest Rate By 2024
10.2.1.1.1 China: Laws & Regulations
10.2.2 Japan
10.2.2.1 The Packaging Segment, By End-Use Application, is Projected to Grow at the Highest Rate in the Recycled Plastic Market By 2024
10.2.2.1.1 Japan: Laws & Regulations
10.2.3 India
10.2.3.1 India is Projected to Witness the Highest Growth in the Asia Pacific Market, in Terms of Volume
10.2.3.1.1 India: Laws & Regulations
10.2.4 Southeast Asia
10.2.4.1 Southeast Asia is Projected to Witness the Highest Growth in the Asia Pacific Market, in Terms of Value
10.2.4.1.1 Indonesia: Laws & Regulations
10.2.5 Rest of Asia Pacific
10.2.5.1 Recycling is Projected to Be the Fastest-Growing Method for Plastic Waste Management During the Forecast Period in the Rest of Asia Pacific
10.3 North America
10.3.1 US
10.3.1.1 The US Was the Largest Producer of Plastic Waste in North America in 2018
10.3.1.1.1 US: Laws & Regulations
10.3.2 Canada
10.3.2.1 Packaging Segment to Grow at the Highest Cagr, in Terms of Both Volume and Value, in the Canadian Recycled Plastic Market
10.3.2.1.1 Canada: Laws & Regulations
10.3.3 Mexico
10.3.3.1 Mexico is Projected to Be the Second-Fastest-Growing Country in the North American Plastic Waste Management Market During the Forecast Period
10.3.3.1.1 Mexico: Laws & Regulations
10.4 Europe
10.4.1 Germany
10.4.1.1 Germany Accounted for the Largest Country-Level Segment in the European Plastic Waste Management Market in 2018
10.4.1.1.1 Germany: Laws & Regulations
10.4.2 UK
10.4.2.1 The UK Accounted for the Third-Largest Country-Level Segment in the European Plastic Waste Management Market in 2018
10.4.2.1.1 UK: Laws & Regulations
10.4.3 France
10.4.3.1 The Incineration Segment Dominated the French Plastic Waste Management Market in 2018
10.4.3.1.1 France: Laws & Regulations
10.4.4 Italy
10.4.4.1 Italy is Projected to Experience Slow Growth in the European Plastic Waste Management Market During the Forecast Period
10.4.5 Russia
10.4.5.1 Russia Accounted for the Second-Largest Country-Level Segment in the European Plastic Waste Management Market in 2018, in Terms of Volume 105
10.4.6 Spain
10.4.6.1 The Spanish Plastic Waste Management Market is Characterized By Significant Plastic Recycling
10.4.7 Rest of Europe
10.4.7.1 The Rest of Europe is Projected to Record the Highest Growth in the European Plastic Waste Management Market By 2024
10.5 Middle East & Africa
10.5.1 Turkey
10.5.1.1 Turkey is Estimated to Be the Second-Largest Market for Plastic Waste Management in the Middle East & Africa in 2019, in Terms of Volume114
10.5.1.1.1 Turkey: Laws & Regulations
10.5.2 Nigeria
10.5.2.1 Nigeria is Estimated to Be the Largest Market in the Middle East & Africa, in Terms of Volume, in 2019
10.5.2.1.1 Nigeria: Laws & Regulations
10.5.3 South Africa
10.5.3.1 Packaging Segment Led the South African Recycled Plastic Waste Market, in Terms of Value, in 2018
10.5.3.1.1 South Africa: Laws & Regulations
10.5.4 Egypt
10.5.4.1 Egypt is Projected to Have A High Potential for Growth in the Plastic Waste Management Market
10.5.4.1.1 Egypt: Laws & Regulations
10.5.5 Rest of the Middle East & Africa
10.5.5.1 The Rest of MEA Market is Projected to Have A High Potential for Growth in the Plastic Waste Management Market
10.6 South America
10.6.1 Brazil
10.6.1.1 Brazil to Account for the Largest Share in the South American Plastic Waste Management Market
10.6.1.1.1 Brazil: Laws & Regulations
10.6.2 Argentina
10.6.2.1 Argentina Accounted for the Second-Largest Share of the Plastic Waste Management Market in South America
10.6.2.1.1 Argentina: Laws & Regulations
10.6.3 Rest of South America
10.6.3.1 The Plastic Packaging Segment is Projected to Remain the Largest, in Terms of Consumption, of the Recycled Plastics Market in the Rest of South America
11 Competitive Landscape (Page No. - 135)
11.1 Overview
11.2 Market Ranking
11.3 Competitive Scenario
11.3.1 Acquisitions
11.3.2 Expansions
11.3.3 Partnerships & Joint Ventures
11.3.4 Contracts
11.3.5 New Product & Service Developments
12 Company Profiles (Page No. - 143)
(Business Overview, Services Offered, Recent Developments, SWOT Analysis, MnM View)*
12.1 Veolia Environnement
12.2 SUEZ
12.3 Waste Management Inc.
12.4 Republic Services
12.5 Stericycle
12.6 Clean Harbors
12.7 Waste Connections, Inc.
12.8 Covanta Holding Corporation
12.9 Remondis SE & Co. Kg
12.10 Biffa
12.11 Other Key Players
12.11.1 Plastic Energy
12.11.2 Krubong-Karich Group
12.11.3 Hahn Plastics
12.11.4 Luxus Limited
12.11.5 United Plastic Recycling
12.11.6 TM Recycling
12.11.7 Casella Waste Systems
12.11.8 Plasgran
*Details on Business Overview, Services Offered, Recent Developments, SWOT Analysis, MnM View Might Not Be Captured in Case of Unlisted Companies.
13 Appendix (Page No. - 172)
13.1 Discussion Guide
13.2 Knowledge Store: Marketsandmarkets’ Subscription Portal
13.3 Available Customizations
13.4 Related Reports
13.5 Author Details
List of Tables (142 Tables)
Table 1 USD Conversion Rates, 2016–2018
Table 2 Urban/Rural Population Growth Prospects, By Country/Region, 1990–2050 (Thousand)
Table 3 Plastic Waste Management Market Size, By Service, 2017–2024 (USD Billion)
Table 4 Plastic Waste Management Market Size, By Service, 2017–2024 (Million Tons)
Table 5 Plastic Waste Management Market Size, By Polymer Type, 2017–2024 (Million Tons)
Table 6 Plastic Waste Management Market Size, By Source, 2017–2024 (Million Tons)
Table 7 Recycled Plastic Waste Market Size, By End-Use Application, 2017–2024 (USD Billion)
Table 8 Recycled Plastic Waste Market Size, By End-Use Application, 2017–2024 (Million Tons)
Table 9 Plastic Waste Management Market Size, By Region, 2017–2024 (USD Billion)
Table 10 Plastic Waste Management Market Size, By Region, 2017–2024 (Million Tons)
Table 11 Asia Pacific: Plastic Waste Management Market Size, By Country/Region, 2017–2024 (USD Billion)
Table 12 Asia Pacific: Plastic Waste Management Market Size, By Country/Region, 2017–2024 (Million Tons)
Table 13 Asia Pacific: Plastic Waste Management Market Size, By Service, 2017–2024 (USD Billion)
Table 14 Asia Pacific: Plastic Waste Management Market Size, By Service, 2017–2024 (Million Tons)
Table 15 Asia Pacific: Plastic Waste Management Market Size, By Source, 2017–2024 (Million Tons)
Table 16 Asia Pacific: Recycled Plastic Waste Market Size, By End-Use Application, 2017–2024 (USD Billion)
Table 17 Asia Pacific: Recycled Plastic Waste Market Size, By End-Use Application, 2017–2024 (Million Tons)
Table 18 China: Plastic Waste Management Market Size, By Service, 2017–2024 (USD Billion)
Table 19 China: Plastic Waste Management Market Size, By Service, 2017–2024 (Million Tons)
Table 20 China: Recycled Plastic Waste Market Size, By End-Use Application, 2017–2024 (USD Billion)
Table 21 China: Recycled Plastic Waste Market Size, By End-Use Application, 2017–2024 (Million Tons)
Table 22 Japan: Plastic Waste Management Market Size, By Service, 2017–2024 (USD Billion)
Table 23 Japan: Plastic Waste Management Market Size, By Service, 2017–2024 (Million Tons)
Table 24 Japan: Recycled Plastic Waste Market Size, By End-Use Application, 2017–2024 (USD Billion)
Table 25 Japan: Recycled Plastic Waste Market Size, By End-Use Application, 2017–2024 (Million Tons)
Table 26 India: Plastic Waste Management Market Size, By Service, 2017–2024 (USD Billion)
Table 27 India: Plastic Waste Management Market Size, By Service, 2017–2024 (Million Tons)
Table 28 India: Recycled Plastic Waste Market Size, By End-Use Application, 2017–2024 (USD Billion)
Table 29 India: Recycled Plastic Waste Market Size, By End-Use Application, 2017–2024 (Million Tons)
Table 30 Southeast Asia: Plastic Waste Management Market Size, By Service, 2017–2024 (USD Billion)
Table 31 Southeast Asia: Plastic Waste Management Market Size, By Service, 2017–2024 (Million Tons)
Table 32 Southeast Asia: Recycled Plastic Waste Market Size, By End-Use Application, 2017–2024 (USD Billion)
Table 33 Southeast Asia: Recycled Plastic Waste Market Size, By End-Use Application, 2017–2024 (Million Tons)
Table 34 Rest of Asia Pacific: Plastic Waste Management Market Size, By Service, 2017–2024 (USD Billion)
Table 35 Rest of Asia Pacific: Plastic Waste Management Market Size, By Service, 2017–2024 (Million Tons)
Table 36 Rest of Asia Pacific: Recycled Plastic Waste Market Size, By End-Use Application, 2017–2024 (USD Billion)
Table 37 Rest of Asia Pacific: Recycled Plastic Waste Market Size, By End-Use Application, 2017–2024 (Million Tons)
Table 38 North America: Plastic Waste Management Market Size, By Country, 2017–2024 (USD Billion)
Table 39 North America: Plastic Waste Management Market Size, By Country, 2017–2024 (Million Tons)
Table 40 North America: Plastic Waste Management Market Size, By Service, 2017–2024 (USD Billion)
Table 41 North America: Plastic Waste Management Market Size, By Service, 2017–2024 (Million Tons)
Table 42 North America: Plastic Waste Management Market Size, By Source, 2017–2024 (Million Tons)
Table 43 North America: Recycled Plastic Waste Market Size, By End-Use Application, 2017–2024 (USD Billion)
Table 44 North America: Recycled Plastic Waste Market Size, By End-Use Application, 2017–2024 (Million Tons)
Table 45 US: Plastic Waste Management Market Size, By Service, 2017–2024 (USD Billion)
Table 46 US: Plastic Waste Management Market Size, By Service, 2017–2024 (Million Tons)
Table 47 US: Recycled Plastic Waste Market Size, By End-Use Application, 2017–2024 (USD Billion)
Table 48 US: Recycled Plastic Waste Market Size, By End-Use Application, 2017–2024 (Million Tons)
Table 49 Canada: Plastic Waste Management Market Size, By Service, 2017–2024 (USD Billion)
Table 50 Canada: Plastic Waste Management Market Size, By Service, 2017–2024 (Million Tons)
Table 51 Canada: Recycled Plastic Waste Market Size, By End-Use Application, 2017–2024 (USD Billion)
Table 52 Canada: Recycled Plastic Waste Market Size, By End-Use Application, 2017–2024 (Million Tons)
Table 53 Mexico: Plastic Waste Management Market Size, By Service, 2017–2024 (USD Billion)
Table 54 Mexico: Plastic Waste Management Market Size, By Service, 2017–2024 (Million Tons)
Table 55 Mexico: Recycled Plastic Waste Market Size, By End-Use Application, 2017–2024 (USD Billion)
Table 56 Mexico: Recycled Plastic Waste Market Size, By End-Use Application, 2017–2024 (Million Tons)
Table 57 Europe: Plastic Waste Management Market Size, By Country, 2017–2024 (USD Billion)
Table 58 Europe: Plastic Waste Management Market Size, By Country, 2017–2024 (Million Tons)
Table 59 Europe: Plastic Waste Management Market Size, By Service, 2017–2024 (USD Billion)
Table 60 Europe: Plastic Waste Management Market Size, By Service, 2017–2024 (Million Tons)
Table 61 Europe: Plastic Waste Management Market Size, By Source, 2017–2024 (Million Tons)
Table 62 Europe: Recycled Plastic Waste Market Size, By End-Use Application, 2017–2024 (USD Billion)
Table 63 Europe: Recycled Plastic Waste Market Size, By End-Use Application, 2017–2024 (Million Tons)
Table 64 Germany: Plastic Waste Management Market Size, By Service, 2017–2024 (USD Billion)
Table 65 Germany: Plastic Waste Management Market Size, By Service, 2017–2024 (Million Tons)
Table 66 Germany: Recycled Plastic Waste Market Size, By End-Use Application, 2017–2024 (USD Billion)
Table 67 Germany: Recycled Plastic Waste Market Size, By End-Use Application, 2017–2024 (Million Tons)
Table 68 UK: Plastic Waste Management Market Size, By Service, 2017–2024 (USD Billion)
Table 69 UK: Plastic Waste Management Market Size, By Service, 2017–2024 (Million Tons)
Table 70 UK: Recycled Plastic Waste Market Size, By End-Use Application, 2017–2024 (USD Billion)
Table 71 UK: Recycled Plastic Waste Market Size, By End-Use Application, 2017–2024 (Million Tons)
Table 72 France: Plastic Waste Management Market Size, By Service, 2017–2024 (USD Billion)
Table 73 France: Plastic Waste Management Market Size, By Service, 2017–2024 (Million Tons)
Table 74 France: Recycled Plastic Waste Market Size, By End-Use Application, 2017–2024 (USD Billion)
Table 75 France: Recycled Plastic Waste Market Size, By End-Use Application, 2017–2024 (Million Tons)
Table 76 Italy: Plastic Waste Management Market Size, By Service, 2017–2024 (USD Billion)
Table 77 Italy: Plastic Waste Management Market Size, By Service, 2017–2024 (Million Tons)
Table 78 Italy: Recycled Plastic Waste Market Size, By End-Use Application, 2017–2024 (USD Billion)
Table 79 Italy: Recycled Plastic Waste Market Size, By End-Use Application, 2017–2024 (Million Tons)
Table 80 Russia: Plastic Waste Management Market Size, By Service, 2017–2024 (USD Billion)
Table 81 Russia: Plastic Waste Management Market Size, By Service, 2017–2024 (Million Tons)
Table 82 Russia: Recycled Plastic Waste Market Size, By End-Use Application, 2017–2024 (USD Billion)
Table 83 Russia: Recycled Plastic Waste Market Size, By End-Use Application, 2017–2024 (Million Tons)
Table 84 Spain: Plastic Waste Management Market Size, By Service, 2017–2024 (USD Billion)
Table 85 Spain: Plastic Waste Management Market Size, By Service, 2017–2024 (Million Tons)
Table 86 Spain: Recycled Plastic Waste Market Size, By End-Use Application, 2017–2024 (USD Billion)
Table 87 Spain: Recycled Plastic Waste Market Size, By End-Use Application, 2017–2024 (Million Tons)
Table 88 Rest of Europe: Plastic Waste Management Market Size, By Service, 2017–2024 (USD Billion)
Table 89 Rest of Europe: Plastic Waste Management Market Size, By Service, 2017–2024 (Million Tons)
Table 90 Rest of Europe: Recycled Plastic Waste Market Size, By End-Use Application, 2017–2024 (USD Billion)
Table 91 Rest of Europe: Recycled Plastic Waste Market Size, By End-Use Application, 2017–2024 (Million Tons)
Table 92 MEA: Plastic Waste Management Market Size, By Country, 2017–2024 (USD Billion)
Table 93 MEA: Plastic Waste Management Market Size, By Country, 2017–2024 (Million Tons)
Table 94 MEA: Plastic Waste Management Market Size, By Service, 2017–2024 (USD Billion)
Table 95 MEA: Plastic Waste Management Market Size, By Service, 2017–2024 (Million Tons)
Table 96 MEA: Plastic Waste Management Market Size, By Source, 2017–2024 (Million Tons)
Table 97 MEA: Recycled Plastic Waste Market Size, By End-Use Application, 2017–2024 (USD Billion)
Table 98 MEA: Recycled Plastic Waste Market Size, By End-Use Application, 2017–2024 (Million Tons)
Table 99 Turkey: Plastic Waste Management Market Size, By Service, 2017–2024 (USD Billion)
Table 100 Turkey: Plastic Waste Management Market Size, By Service, 2017–2024 (Million Tons)
Table 101 Turkey: Recycled Plastic Waste Market Size, By End-Use Application, 2017–2024 (USD Billion)
Table 102 Turkey: Recycled Plastic Waste Market Size, By End-Use Application, 2017–2024 (Million Tons)
Table 103 Nigeria: Plastic Waste Management Market Size, By Service, 2017–2024 (USD Billion)
Table 104 Nigeria: Plastic Waste Management Market Size, By Service, 2017–2024 (Million Tons)
Table 105 Nigeria: Recycled Plastic Waste Market Size, By End-Use Application, 2017–2024 (USD Billion)
Table 106 Nigeria: Recycled Plastic Waste Market Size, By End-Use Application, 2017–2024 (Million Tons)
Table 107 South Africa: Plastic Waste Management Market Size, By Service, 2017–2024 (USD Billion)
Table 108 South Africa: Plastic Waste Management Market Size, By Service, 2017–2024 (Million Tons)
Table 109 South Africa: Recycled Plastic Waste Market Size, By End-Use Application, 2017–2024 (USD Billion)
Table 110 South Africa: Recycled Plastic Waste Market Size, By End-Use Application, 2017–2024 (Million Tons)
Table 111 Egypt: Plastic Waste Management Market Size, By Service, 2017–2024 (USD Billion)
Table 112 Egypt: Plastic Waste Management Market Size, By Service, 2017–2024 (Million Tons)
Table 113 Egypt: Recycled Plastic Waste Market Size, By End-Use Application, 2017–2024 (USD Billion)
Table 114 Egypt: Recycled Plastic Waste Market Size, By End-Use Application, 2017–2024 (Million Tons)
Table 115 Rest of MEA: Plastic Waste Management Market Size, By Service, 2017–2024 (USD Billion)
Table 116 Rest of MEA: Plastic Waste Management Market Size, By Service, 2017–2024 (Million Tons)
Table 117 Rest of MEA: Recycled Plastic Waste Market Size, By End-Use Application, 2017–2024 (USD Billion)
Table 118 Rest of MEA: Recycled Plastic Waste Market Size, By End-Use Application, 2017–2024 (Million Tons)
Table 119 South America: Plastic Waste Management Market Size, By Country, 2017–2024 (USD Billion)
Table 120 South America: Plastic Waste Management Market Size, By Country, 2017–2024 (Million Tons)
Table 121 South America: Plastic Waste Management Market Size, By Service, 2017–2024 (USD Billion)
Table 122 South America: Plastic Waste Management Market Size, By Service, 2017–2024 (Million Tons)
Table 123 South America: Plastic Waste Management Market Size, By Source, 2017–2024 (Million Tons)
Table 124 South America: Recycled Plastic Waste Market Size, By End-Use Application, 2017–2024 (USD Billion)
Table 125 South America: Recycled Plastic Waste Market Size, By End-Use Application, 2017–2024 (Million Tons)
Table 126 Brazil: Plastic Waste Management Market Size, By Service, 2017–2024 (USD Billion)
Table 127 Brazil: Plastic Waste Management Market Size, By Service, 2017–2024 (Million Tons)
Table 128 Brazil: Recycled Plastic Waste Market Size, By End-Use Application, 2017–2024 (USD Billion)
Table 129 Brazil: Recycled Plastic Waste Market Size, By End-Use Application, 2017–2024 (Million Tons)
Table 130 Argentina: Plastic Waste Management Market Size, By Service, 2017–2024 (USD Billion)
Table 131 Argentina: Plastic Waste Management Market Size, By Service, 2017–2024 (Million Tons)
Table 132 Argentina: Recycled Plastic Waste Market Size, By End-Use Application, 2017–2024 (USD Billion)
Table 133 Argentina: Recycled Plastic Waste Market Size, By End-Use Application, 2017–2024 (Million Tons)
Table 134 Rest of South America: Plastic Waste Management Market Size, By Service, 2017–2024 (USD Billion)
Table 135 Rest of South America: Plastic Waste Management Market Size, By Service, 2017–2024 (Million Tons)
Table 136 Rest of South America: Recycled Plastic Waste Market Size, By End-Use Application, 2017–2024 (USD Billion)
Table 137 Rest of South America: Recycled Plastic Waste Market Size, By End-Use Application, 2017–2024 (Million Tons)
Table 138 Acquisitions
Table 139 Expansions
Table 140 Partnerships & Joint Ventures
Table 141 Contracts
Table 142 New Product & Service Developments
List of Figures (36 Figures)
Figure 1 Plastic Waste Management Market Segmentation
Figure 2 Plastic Waste Management Market: Data Triangulation
Figure 3 Key Market Insights
Figure 4 List of Stakeholders Involved and Breakdown of Primary Interviews
Figure 5 Plastic Waste Management Market, By Polymer Type, 2019 vs. 2024 (Million Tons)
Figure 6 Plastic Waste Management Market, By Service, 2019 vs. 2024 (USD Billion)
Figure 7 Plastic Waste Management Market, By Source, 2019 vs. 2024 (Million Tons)
Figure 8 Plastic Waste Management Market, By End-Use Application, 2019 vs. 2024 (USD Billion)
Figure 9 Asia Pacific Led the Plastic Waste Management Market in 2018, in Terms of Value
Figure 10 Rapid Urbanization and Industrialization to Drive the Plastic Waste Management Market
Figure 11 The Residential Segment and Asia Pacific Led the Market in 2018, in Terms of Volume
Figure 12 Recycling is Projected to Be the Fastest-Growing Segment During the Forecast Period, in Terms of Volume
Figure 13 The Packaging Segment is Projected to Be the Fastest-Growing During the Forecast Period, in Terms of Volume
Figure 14 Plastic Waste Management Market: Drivers, Restraints, Opportunities, and Challenges
Figure 15 Plastic Waste Management Market Size, By Service, 2019 vs. 2024 (USD Billion)
Figure 16 Plastic Waste Management Market Size, By Polymer Type, 2019 vs. 2024 (Million Tons)
Figure 17 Plastic Waste Management Market Size, By Source, 2019 vs. 2024 (Million Tons)
Figure 18 Recycled Plastic Waste Market Size, By End-Use Application, 2019 vs. 2024 (Million Tons)
Figure 19 Regional Snapshot: Southeast Asian Countries are Projected to Register the Fastest-Growth in the Plastic Waste Management Market, in Terms of Value, During the Forecast Period
Figure 20 Asia Pacific: Plastic Waste Management Market Snapshot
Figure 21 Companies Adopted Expansions, Partnerships, and Joint Ventures as the Key Growth Strategies Between 2017 and 2019
Figure 22 Market Ranking of Key Players, 2018
Figure 23 Veolia Environnement: Company Snapshot
Figure 24 Veolia Environnement: SWOT Analysis
Figure 25 SUEZ: Company Snapshot
Figure 26 SUEZ: SWOT Analysis
Figure 27 Waste Management, Inc.: Company Snapshot
Figure 28 Waste Management, Inc.: SWOT Analysis
Figure 29 Republic Services: Company Snapshot
Figure 30 Republic Services: SWOT Analysis
Figure 31 Stericycle: Company Snapshot
Figure 32 Stericycle: SWOT Analysis
Figure 33 Clean Harbors: Company Snapshot
Figure 34 Waste Connections: Company Snapshot
Figure 35 Covanta Holding Corporation: Company Snapshot
Figure 36 Biffa: Company Snapshot
The study involved four major activities in estimating the current global size of the plastic waste management market. The exhaustive secondary research was carried out to collect information on the market, the peer market, and the parent market. The next step was to validate these findings, assumptions, and sizes with the industry experts across the value chain of plastic waste management through primary research. The bottom-up approach was employed to estimate the overall size of the plastic waste management market. After that, the market breakdown and data triangulation procedures were used to estimate the size of different segments and subsegments of the market.
Secondary Research
In the secondary research process, various secondary sources such as the Wall Street Journal, the World Bank, PlasticsEurope, Bloomberg, and Factiva were referred to, to identify and collect information on the plastic waste management market. These secondary sources included annual reports, press releases & investor presentations of companies, white papers, certified publications, articles by recognized authors, gold & silver standard websites, packaging organizations, regulatory bodies, trade directories, and databases.
Primary Research
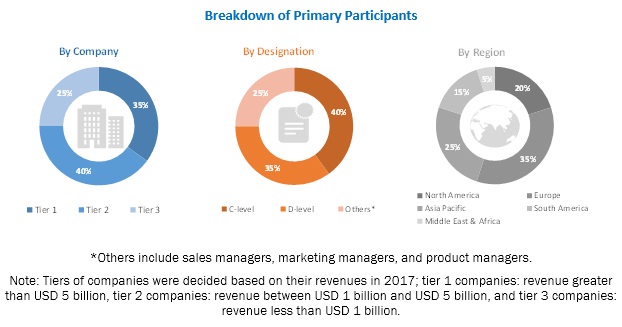
Various primary sources from both supply- and demand-side of the market were interviewed to obtain qualitative and quantitative information. The primary sources from the supply-side included industry experts such as Chief Executive Officers (CEOs), vice presidents, marketing directors, sales professionals, and related key executives from various key companies and organizations operating in the plastic waste management market. The primary sources from the demand-side included industry experts from core & related industries and preferred suppliers, recycled plastics end-users, packaging companies, standards & certification organizations, and organizations related to all segments of the value chain of the plastic waste management industry. The breakdown of the profiles of primary respondents is as follows:
To know about the assumptions considered for the study, download the pdf brochure
Market Size Estimation
The bottom-up approach was used to estimate and validate the global size of the plastic waste management market. Both bottom-up and top-down approaches were used extensively to estimate the size of various dependent segments of the market. The research methodology used to estimate the market size included the following details:
- The waste generation in key countries was identified through extensive secondary research
- The relative shares and pricing of various services in the total plastic waste management market, in terms of volume, were determined through primary and secondary research processes
- All percentage shares, splits, and breakdowns of the sub-segments were further determined using secondary sources and verified through primary sources.
Data Triangulation
After arriving at the overall market size from the estimation process explained above, the total market was split into several segments and subsegments. The data triangulation and market breakdown procedures were employed, wherever applicable to complete the overall market engineering process and arrive at the exact statistics for all segments and subsegments of the plastic waste management market. The data was triangulated by studying various factors and trends from both demand- and supply-side.
Research Objectives
- To define, segment, and project the size of the global plastic waste management market, based on polymer type, service, source, end-use application, and region
- To project the size of the market and its segments, in terms of value and volume, concerning five main regions (along with their respective key countries), namely, North America, Europe, Asia Pacific, the Middle East & Africa, and South America
- To provide detailed information about the key factors such as drivers, restraints, opportunities, and challenges influencing the growth of the market
- To analyze the opportunities in the market for stakeholders and provide a detailed competitive landscape of the market leaders
- To strategically profile the key players and comprehensively analyze their market ranking and core competencies
- To track and analyze competitive developments such as expansions, contracts, partnerships & joint ventures, acquisitions, and new product and service developments in the plastic waste management market
Available Customizations
With the given market data, MarketsandMarkets offers customizations according to client-specific needs.
The following customization options are available for the plastic waste management report:
Product Analysis
- Product matrix, which offers a detailed comparison of the product portfolio of companies
Regional Analysis
- Further analysis of the plastic waste management market for additional countries
Company Information
- Detailed analysis and profiling of additional market players (up to 5)


Growth opportunities and latent adjacency in Plastic Waste Management Market