Polymer Processing Aid Market by Polymer Type (Polyethylene (LLDPE, LDPE, HDPE), Polypropylene), Application (Blown Film & Cast Film, Extrusion Blow Molding, Wire & Cable, Pipe & Tube, Fibers & Raffia) - Global Forecast to 2021


[134 Pages Report] The global polymer processing aid market is projected to grow from USD 1.71 Billion in 2016 to USD 2.21 Billion by 2021, at a CAGR of 5.2% between 2016 and 2021. In this report, 2015 is considered as the base year and the forecast period is from 2016 to 2021.
Objectives of the Study
- To analyze and forecast the market size of polymer processing aid (PPA), in terms of volume and value
- To define, describe, and segment the PPA market by polymer type, application, and region
- To forecast the size of the global PPA market and its subsegments in Asia-Pacific, North America, Europe, the Middle East & Africa, and South America
- To provide detailed information regarding the important factors influencing the growth of the market (drivers, restraints, and opportunities)
- To strategically analyze the segmented markets with respect to individual growth trends, growth prospects, and contribution to the overall market
- To identify and analyze opportunities for stakeholders in the global PPA market
- To analyze competitive developments such as expansions, collaborations, acquisitions, agreements, and new product launches in the global PPA market
- To strategically profile key players and comprehensively analyze their core competencies
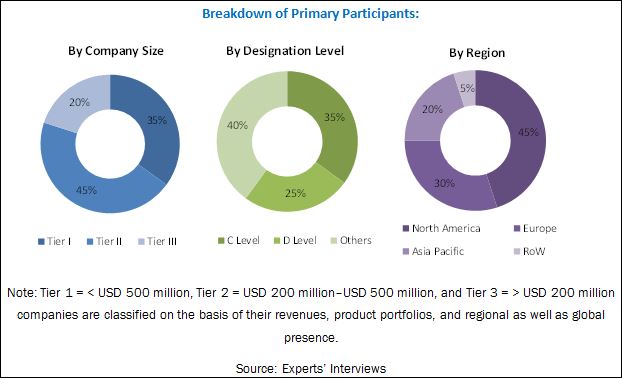
This research study involves the extensive use of secondary sources, directories, and databases (such as Hoovers, Bloomberg BusinessWeek, and Factiva) to identify and collect information useful for a technical, market-oriented, and commercial study of the global polymer processing aid market. The primary sources mainly include several industry experts from core and related industries and preferred suppliers, manufacturers, distributors, service providers, and organizations related to all segments of the industry�s supply chain. After arriving at the overall market size, the total market has been split into several segments and subsegments. The figure below illustrates the breakdown of primary interviews based on company type, designation, and region conducted during the research study:
To know about the assumptions considered for the study, download the pdf brochure
The polymer processing aid value chain includes raw materials manufactured by companies such as Arkema S.A. (France), and Clariant AG (Switzerland). Furthermore, raw materials are used for the processing of specific polymer types such as polyethylene and polypropylene. Companies supplying raw materials include Daikin America, Inc. (Japan), and Fine Organics (India), whereas, companies such as PolyOne Corporation (U.S.), Tosaf Group (Israel), and Wells Plastics Ltd. (U.K.) are engaged in the polymerization process of polymers and using them in different applications such as blown film & cast film and extrusion blow molding. Post the polymerization process, produced plastics are supplied to end-use industries and utilized on the basis of their technicality and compatibility.
The target audiences for the polymer processing aid market report are as follows:
- PPA Manufacturers
- PPA Suppliers
- Raw Material Manufacturers
- Plastic Manufacturers
- Composite Manufacturers
- Additive Distributors
Scope of the Report
This report categorizes the global polymer processing aid market on the basis of polymer type, application, and region.
Polymer Processing Aid Market, By Polymer Type:
- Polypropylene
- Polyethylene
- LLDPE
- LDPE
- HDPE
- Others
- Others
Polymer Processing Aid Market, By Application:
- Blown Film & Cast Film
- Wire & Cable
- Extrusion Blow Molding
- Pipe & Tube
- Fibers & Raffia
- Others
Polymer Processing Aid Market, By Region:
- Asia-Pacific
- Europe
- North America
- Middle East & Africa
- South America
Available Customizations:
With the given market data, MarketsandMarkets offers customizations according to the company�s specific needs. The following customization options are available for the report:
Regional Analysis
- Further breakdown of a region with respect to a particular country, additional application, and/or type
Country Information
- Additional country information (up to three)
Company Information
- Detailed analysis and profiles of additional market players (up to five)
The global polymer processing aid market is expected to grow from USD 1.71 Billion in 2016 to USD 2.21 Billion by 2021, at a CAGR of 5.2% during the forecast period. Increasing applicability of plastics in end-use industries such as automotive, building & construction, consumer goods, and packaging is driving the growth of the global polymer processing aid market.
The global polymer processing aid market has been segmented on the basis of polymer type, namely, polyethylene (LLDPE, LDPE, HDPE, and others), polypropylene, and others. The polyethylene segment is expected to lead the global polymer processing aid market, in terms of value and volume. The increased consumption of HDPE, LLDPE, and LDPE in building & construction, consumer goods, and automotive industries is fueling the growth of the polyethylene segment. The polypropylene segment of the global polymer processing aid market is expected to grow at the highest CAGR from 2016 to 2021, in terms of value, owing to the rising demand for polypropylene from building & construction and packaging industries.
On the basis of application, the global polymer processing aid market has been classified into blown film & cast film, extrusion blow molding, wire & cable, pipe & tube, fibers & raffia, and others. The blown film & cast film application is projected to be the largest application segment of the global polymer processing aid market. This growth is mainly attributed to the increasing use of polymer processing aids to produce blown films & cast films to meet the rising demand for high-quality clean films in China, India, Japan, and South Korea. Blown films are extremely durable and have high mechanical strength, whereas, cast films are soft and flexible. The use of PPA prevents materials from sticking to the surface of machineries, while processing of polymers into plastics. PPA also helps improve surface quality, eliminate melt fractures, maintain operational temperature, and reduce die deposits.
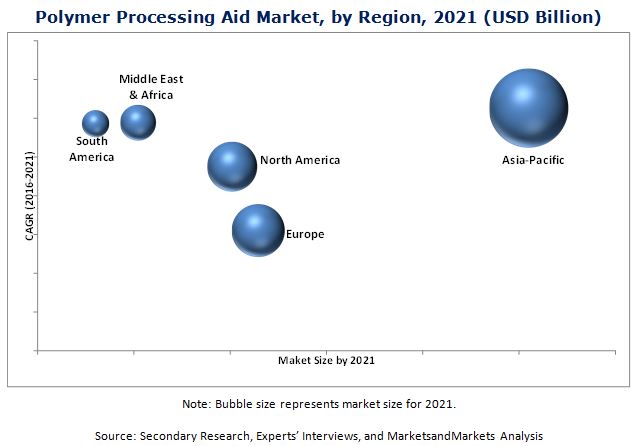
On the basis of region, the global polymer processing aid market has been segmented into Asia-Pacific, Europe, North America, Middle East & Africa, and South America. The Asia-Pacific region is the largest market for polymer processing aid. The per capita consumption of plastics from varied end-use industries in the Asia-Pacific region is increasing, which, in turn, has contributed to the growth of the polymer processing aid market in this region.
One of the most significant factors restraining the growth of the global polymer processing aid market is limited focus on R&D activities for the development of new technologies.
Some of the key players in the global polymer processing aid market include 3M Company (U.S.), A. Schulman, Inc. (U.S.), Arkema S.A. (France), Clariant AG (Switzerland), Daikin America, Inc. (Japan), Fine Organics (India), Micro Epsilon (Lebanon), PolyOne Corporation (U.S.), Tosaf Group (Israel), and Wells Plastics Ltd. (U.K.) among others.
To speak to our analyst for a discussion on the above findings, click Speak to Analyst
 Exclusive indicates content/data unique to MarketsandMarkets and not available with any competitors.
Table of Contents
1 Introduction (Page No. - 13)
1.1 Objectives of the Study
1.2 Market Definition
1.3 Scope of the Study
1.3.1 Markets Covered
1.3.2 Years Considered for the Study
1.4 Currency
1.5 Package Size
1.6 Limitations
1.7 Stakeholders
2 Research Methodology (Page No. - 17)
2.1 Research Data
2.1.1 Secondary Data
2.1.1.1 Key Data From Secondary Sources
2.1.2 Primary Data
2.1.2.1 Key Data From Primary Sources
2.1.2.2 Key Industry Insights
2.1.2.3 Breakdown of Primary Interviews
2.2 Market Size Estimation
2.2.1 Bottom-Up Approach
2.2.2 Top-Down Approach
2.3 Data Triangulation
2.4 Research Assumptions
2.4.1 Assumptions
3 Executive Summary (Page No. - 25)
4 Premium Insights (Page No. - 29)
4.1 Significant Opportunities in PPA Market
4.2 PPA Market to Register A High CAGR
4.3 Asia-Pacific PPA Market Scenario, By Country and Polymer Type
4.4 PPA Market Attractiveness
4.5 PPA Market, By Application and Region
5 Market Overview (Page No. - 32)
5.1 Introduction
5.2 Market Dynamics
5.2.1 Impact Analysis for Short, Medium, and Long Term
5.2.2 Drivers
5.2.2.1 Growing Demand for Compatible Processing Aid for High-Temperature Applications
5.2.2.2 Growing End-Use Industries in Emerging Markets
5.2.3 Restraints
5.2.3.1 Less R&D Expenditure in Emerging Markets
5.2.4 Opportunities
5.2.4.1 Unconventional Applications of PPA in Various End-Use Industries
6 Industry Trends (Page No. - 37)
6.1 Introduction
6.2 Value Chain Analysis
6.2.1 Raw Material
6.2.2 Polymer Processing
6.2.3 Application
6.2.4 Distribution Network
6.2.5 End-Use Industries
6.3 Porter�s Five Forces Analysis
6.3.1 Threat of New Entrants
6.3.2 Threat of Substitutes
6.3.3 Bargaining Power of Suppliers
6.3.4 Bargaining Power of Buyers
6.3.5 Intensity of Competitive Rivalry
7 Polymer Processing Aid Market, By Polymer Type (Page No. - 43)
7.1 Introduction
7.2 Market Size Estimation
7.3 Revenue Pocket Matrix
7.4 Polyethylene
7.4.1 Rising Demand From Packaging Industry to Drive the PE Market
7.4.2 HDPE
7.4.3 LDPE
7.4.4 LLDPE
7.4.5 Other Types of PE
7.5 Polypropylene
7.5.1 Increasing Demand From Automotive Industry to Fuel PPA Market in PP
7.6 Others
7.6.1 Technological Developments in Automotive and Building & Construction Industries to Drive PPA Market for Others
8 Polymer Processing Aid Market, By Application (Page No. - 53)
8.1 Introduction
8.2 Application Revenue Pocket Matrix
8.3 Blown Film & Cast Film
8.3.1 Rising Demand for High-Quality Clean Films is Driving PPA Market in Asia-Pacific
8.4 Wire & Cable
8.4.1 Rising Demand for Electronic Goods to Increase Consumption of PPA
8.5 Extrusion Blow Molding
8.5.1 Rising Consumption of Plastic Goods to Drive the Demand for PPA in Extrusion Blow Molding Application During Forecast Period
8.6 Pipe & Tube
8.6.1 Growing Construction Industry to Drive the Demand for PPA in Pipe & Tube Applciation
8.7 Fibers & Raffia
8.7.1 Increasing Demand From End-Use Industries to Drive PPA Market in Fibers & Raffia Application
8.8 Others
9 Polymer Processing Aid Market, By Region (Page No. - 65)
9.1 Introduction
9.2 Asia-Pacific
9.2.1 China
9.2.2 India
9.2.3 Japan
9.2.4 South Korea
9.2.5 Thailand
9.2.6 Indonesia
9.2.7 Taiwan
9.3 Europe
9.3.1 Germany
9.3.2 France
9.3.3 Russia
9.3.4 Italy
9.3.5 U.K.
9.3.6 Spain
9.3.7 Netherlands
9.4 North America
9.4.1 U.S.
9.4.2 Canada
9.4.3 Mexico
9.5 Middle East & Africa
9.5.1 Saudi Arabia
9.5.2 Iran
9.5.3 South Africa
9.6 South America
9.6.1 Brazil
9.6.2 Argentina
10 Competitive Landscape (Page No. - 105)
10.1 Overview
10.2 Market Share of Key Players
10.2.1 Arkema SA
10.2.2 A.Schulman, Inc.
10.3 Competitive Situations and Trends
10.3.1 Expansions
10.3.2 New Product Launches
10.3.3 Partnerships
10.3.4 Acquisitions
11 Company Profiles (Page No. - 109)
(Overview, Products and Services, Financials, Strategy & Development)*
11.1 3M Company
11.2 A. Schulman, Inc.
11.3 Arkema SA
11.4 Clariant AG
11.5 Daikin America, Inc.
11.6 Fine Organics
11.7 Micro-Epsilon Messtechnik GmbH & Co. Kg
11.8 Polyone Corporation
11.9 Tosaf Group
11.10 Wells Plastics Ltd.
*Details on Overview, Products and Services, Financials, Strategy & Development Might Not Be Captured in Case of Unlisted Companies
12 Appendix (Page No. - 126)
12.1 Insights From Industry Experts
12.2 Discussion Guide
12.3 Knowledge Store: Marketsandmarkets� Subscription Portal
12.4 Introducing RT: Real-Time Market Intelligence
12.5 Available Customizations
12.6 Related Reports
12.7 Author Details
List of Tables (86 Tables)
Table 1 PPA Market, By Polymer Type
Table 2 PPA Market, By Application
Table 3 PPA Market Size, By Polymer Type, 2014�2021 (USD Million)
Table 4 PPA Market Size, By Polymer Type, 2014�2021 (Kiloton)
Table 5 PE Market Size, By Region, 2014�2021 (USD Million)
Table 6 PE Market Size, By Region, 2014�2021 (Kiloton)
Table 7 PP Market Size, By Region, 2014�2021 (USD Million)
Table 8 PP Market Size, By Region, 2014�2021 (Kiloton)
Table 9 Other Polymer Type Market Size, By Region, 2014�2021 (USD Million)
Table 10 Other Polymer Type Market Size, By Region, 2014�2021 (Kiloton)
Table 11 Polymer Processing Aid Market Size, By Application, 2014�2021 (USD Million)
Table 12 Polymer Processing Aid Market Size, By Application, 2014�2021 (Kiloton)
Table 13 Polymer Processing Aid Market Size in Blown Film & Cast Film Application, By Region, 2014�2021 (USD Million)
Table 14 Polymer Processing Aid Market Size in Blown Film & Cast Film Application, By Region, 2014�2021 (Kiloton)
Table 15 Polymer Processing Aid Market Size in Wire & Cable Application, By Region, 2014�2021 (USD Million)
Table 16 Polymer Processing Aid Market Size in Wire & Cable Application, By Region, 2014�2021 (Kiloton)
Table 17 Polymer Processing Aid Market Size in Extrusion Blow Molding Application, By Region, 2014�2021 (USD Million)
Table 18 Polymer Processing Aid Market Size in Extrusion Blow Molding Application, By Region, 2014�2021 (Kiloton)
Table 19 Polymer Processing Aid Market Size in Pipe & Tube Application, By Region, 2014�2021 (USD Million)
Table 20 Polymer Processing Aid Market Size in Pipe & Tube Application, By Region, 2014�2021 (Kiloton)
Table 21 Polymer Processing Aid Market Size in Fibers & Raffia Application, By Region, 2014�2021 (USD Million)
Table 22 Polymer Processing Aid Market Size in Fibers & Raffia Application, By Region, 2014�2021 (Kiloton)
Table 23 Polymer Processing Aid Market Size in Other Applications, By Region, 2014�2021 (USD Million)
Table 24 Polymer Processing Aid Market Size in Other Applications, By Region, 2014�2021 (Kiloton)
Table 25 Polymer Processing Aid Market Size, By Region, 2014�2021 (USD Million)
Table 26 Polymer Processing Aid Market Size, By Region, 2014�2021 (Kiloton)
Table 27 Asia-Pacific: Polymer Processing Aid Market Size, By Country, 2014�2021 (USD Million)
Table 28 Asia-Pacific: Polymer Processing Aid Market Size, By Country, 2014�2021 (Kiloton)
Table 29 Asia-Pacific: Polymer Processing Aid Market Size, By Polymer Type, 2014�2021 (USD Million)
Table 30 Asia-Pacific: Polymer Processing Aid Market Size, By Polymer Type, 2014�2021 (Kiloton)
Table 31 Asia-Pacific: Polymer Processing Aid Market Size, By Application, 2014�2021 (USD Million)
Table 32 Asia-Pacific: Polymer Processing Aid Market Size, By Application, 2014�2021 (Kiloton)
Table 33 China: PPA Market Size, By Polymer Type, 2014�2021 (USD Million)
Table 34 China: PPA Market Size, By Polymer Type, 2014�2021 (Kiloton)
Table 35 India: PPA Market Size, By Polymer Type, 2014�2021 (USD Million)
Table 36 India: PPA Market Size, By Polymer Type, 2014�2021 (Kiloton)
Table 37 Japan: PPA Market Size, By Polymer Type, 2014�2021 (USD Million)
Table 38 Japan: PPA Market Size, By Polymer Type, 2014�2021 (Kiloton)
Table 39 Europe: PPA Market Size, By Country, 2014�2021 (USD Million)
Table 40 Europe: PPA Market Size, By Country, 2014�2021 (Kiloton)
Table 41 Europe: PPA Market Size, By Polymer Type, 2014�2021 (USD Million)
Table 42 Europe: PPA Market Size, By Polymer Type, 2014�2021 (Kiloton)
Table 43 Europe: PPA Market Size, By Application, 2014�2021 (USD Million)
Table 44 Europe: PPA Market Size, By Application, 2014�2021 (Kiloton)
Table 45 Germany: PPA Market Size, By Polymer Type, 2014�2021 (USD Million)
Table 46 Germany: PPA Market Size, By Polymer Type, 2014�2021 (Kiloton)
Table 47 France: PPA Market Size, By Polymer Type, 2014�2021 (USD Million)
Table 48 France: PPA Market Size, By Polymer Type, 2014�2021 (Kiloton)
Table 49 Russia: PPA Market Size, By Polymer Type, 2014�2021 (USD Million)
Table 50 Russia: PPA Market Size, By Polymer Type, 2014�2021 (Kiloton)
Table 51 North America: PPA Market Size, By Country, 2014�2021 (USD Million)
Table 52 North America: PPA Market Size, By Country, 2014�2021 (Kiloton)
Table 53 North America: PPA Market Size, By Polymer Type, 2014�2021 (USD Million)
Table 54 North America: PPA Market Size, By Polymer Type, 2014�2021 (Kiloton)
Table 55 North America: PPA Market Size, By Application, 2014�2021 (USD Million)
Table 56 North America: PPA Market Size, By Application, 2014�2021 (Kiloton)
Table 57 U.S.: PPA Market Size, By Polymer Type, 2014�2021 (USD Million)
Table 58 U.S.: PPA Market Size, By Polymer Type, 2014�2021 (Kiloton)
Table 59 Canada: PPA Market Size, By Polymer Type, 2014�2021 (USD Million)
Table 60 Canada: PPA Market Size, By Polymer Type, 2014�2021 (Kiloton)
Table 61 Mexico: PPA Market Size, By Polymer Type, 2014�2021 (USD Million)
Table 62 Mexico: PPA Market Size, By Polymer Type, 2014�2021 (Kiloton)
Table 63 Middle East & Africa: PPA Market Size, By Country, 2014�2021 (USD Million)
Table 64 Middle East & Africa: PPA Market Size, By Country, 2014�2021 (Kiloton)
Table 65 Middle East & Africa: PPA Market Size, By Polymer Type, 2014�2021 (USD Million)
Table 66 Middle East & Africa: PPA Market Size, By Polymer Type, 2014�2021 (Kiloton)
Table 67 Middle East & Africa: PPA Market Size, By Application, 2014�2021 (USD Million)
Table 68 Middle East & Africa: PPA Market Size, By Application, 2014�2021 (Kiloton)
Table 69 Saudi Arabia: PPA Market Size, By Polymer Type, 2014�2021 (USD Million)
Table 70 Saudi Arabia: PPA Market Size, By Polymer Type, 2014�2021 (Kiloton)
Table 71 Iran: PPA Market Size, By Polymer Type, 2014�2021 (USD Million)
Table 72 Iran: PPA Market Size, By Polymer Type, 2014�2021 (Kiloton)
Table 73 South America: PPA Market Size, By Country, 2014�2021 (USD Million)
Table 74 South America: PPA Market Size, By Country, 2014�2021 (Kiloton)
Table 75 South America: PPA Market Size, By Polymer Type, 2014�2021 (USD Million)
Table 76 South America: PPA Market Size, By Polymer Type, 2014�2021 (Kiloton)
Table 77 South America: PPA Market Size, By Application, 2014�2021 (USD Million)
Table 78 South America: PPA Market Size, By Application, 2014�2021 (Kiloton)
Table 79 Brazil: Polymer Processing Aid Market Size, By Polymer Type, 2014�2021 (USD Million)
Table 80 Brazil: Polymer Processing Aid Market Size, By Polymer Type, 2014�2021 (Kiloton)
Table 81 Argentina: Polymer Processing Aid Market Size, By Polymer Type, 2014�2021 (USD Million)
Table 82 Argentina: Polymer Processing Aid Market Size, By Polymer Type, 2014�2021 (Kiloton)
Table 83 Expansions, 2011�2016
Table 84 New Product Launches, 2011�2016
Table 85 Partnerships, 2011�2016
Table 86 Acquisitions, 2011�2016
List of Figures (60 Figures)
Figure 1 PPA Market: Research Design
Figure 2 Key Industry Insights
Figure 3 Breakdown of Primary Interviews
Figure 4 Market Size Estimation: Bottom-Up Approach
Figure 5 Market Size Estimation: Top-Down Approach
Figure 6 PPA Market: Data Triangulation
Figure 7 PE to Be the Largest Polymer Type in PPA Market Between 2016 and 2021
Figure 8 HDPE to Be the Largest Among the Sub-Segments of PE During the Forecast Period (2016-2021)
Figure 9 Blown Film & Cast Film to Be the Largest Application Segment
Figure 10 Asia-Pacific to Be the Fastest-Growing PPA Market, 2016�2021
Figure 11 PPA Market is Expected to Register High CAGR Between 2016 and 2021
Figure 12 Asia-Pacific to Be the Key Market for PPA Between 2016 and 2021
Figure 13 PPA Market in Asia-Pacific: PE Accounted for the Largest Share in 2015
Figure 14 Asia-Pacific to Be the Fastest-Growing Market for PPA Between 2016 and 2021
Figure 15 Blown Film & Cast Film Application Accounted for Major Share in PPA Market in 2015
Figure 16 PPA Market, By Region
Figure 17 Overview of Factors Governing the PPA Market
Figure 18 Drivers, Restraints and Opportunities of PPA Market
Figure 19 Value Chain of PPA Market
Figure 20 Porter�s Five Forces Analysis
Figure 21 PE to Dominate PPA Market During Forecast Period
Figure 22 Revenue Pocket Matrix, By Polymer Type
Figure 23 Asia-Pacific to Be the Largest Market for PE Between 2016 and 2021
Figure 24 HDPE Market Size, 2014�2021
Figure 25 LDPE Market Size, 2014�2021
Figure 26 LLDPE Market Size, 2014�2021
Figure 27 Other Types of PE Market Size, 2014�2021
Figure 28 Asia-Pacific to Be the Largest Market for PP Between 2016 and 2021
Figure 29 Europe to Be the Second-Largest Market for Other Polymer Type Between 2016 and 2021
Figure 30 Blown Film & Cast Film Application to Dominate PPA Market Between 2016 and 2021
Figure 31 Revenue Pocket Matrix: By Application
Figure 32 Asia-Pacific to Be the Largest Market for PPA in Blown Film & Cast Film Application During Forecast Period
Figure 33 Europe to Be the Second-Largest Market for PPA in Wire & Cable Application Between 2016 and 2021
Figure 34 Asia-Pacific to Be the Largest PPA Market in Extrusion Blow Molding Application Between 2016 and 2021
Figure 35 Europe to Be the Second-Largest Market for PPA in Pipe & Tube Application Between 2016 and 2021
Figure 36 Asia-Pacific to Be Dominate PPA Market in Fibers & Raffia Application Between 2016 and 2021
Figure 37 Asia-Pacific to Dominate PPA Market in Other Applications Between 2016 and 2021
Figure 38 China and India: Emerging Countries for PPA Market
Figure 39 China Dominates PPA Market in Asia-Pacific
Figure 40 South Korea PPA Market Size, 2014�2021
Figure 41 Thailand PPA Market Size, 2014�2021
Figure 42 Indonesia PPA Market Size, 2014�2021
Figure 43 Taiwan PPA Market Size, 2014�2021
Figure 44 Germany to Register the Highest CAGR in European PPA Market
Figure 45 Italy PPA Market Size, 2014�2021
Figure 46 U.K. PPA Market Size, 2014�2021
Figure 47 Spain PPA Market Size, 2014�2021
Figure 48 Netherlands PPA Market Size, 2014�2021
Figure 49 U.S. Dominates PPA Market in North America
Figure 50 South Africa: PPA Market Size 2014�2021
Figure 51 Expansion: the Most Preferred Growth Strategy Adopted By Key Players
Figure 52 Expansions and New Product Launches: the Most Preferred Growth Strategies in the PPA Market
Figure 53 Chinese Local Players Held Substantial Shares in PPA Market in 2015
Figure 54 3M Company: Company Snapshot
Figure 55 A. Schulman, Inc.: Company Snapshot
Figure 56 Arkema SA: Company Snapshot
Figure 57 Arkema SA: SWOT Analysis
Figure 58 Clariant AG: Company Snapshot
Figure 59 Daikin America, Inc.: Company Snapshot
Figure 60 Polyone Corporation: Company Snapshot


Growth opportunities and latent adjacency in Polymer Processing Aid Market