Power Metering Market by Application (Residential, Commercial & Industrial), by Phase, by type (Smart, Digital, Analog, & Others), & by Region (North America, South America, the Middle East Africa, APAC, & Europe) - Global Trend & Forecast to 2020


The global power metering market has huge growth opportunities owing to increasing demands from developing economies such as India, Brazil, and South Africa. The governments would enhance grid infrastructure, which would be done by installing more towers, so that more number of people have access to electricity. This would also ensure the growth of the power metering market since they would be installed to measure electricity consumption. In addition, rapidly increasing demands from various application industries and regions are generating several exciting markets opportunities for power meters.
The report has been segmented on the basis of application, phase, meter type, and region as follows:-
On the basis of meter type: The report considers various types of meters such as the emerging smart meters, the matured digital meters that occupy around 30% of the market, and analog meters.
On the basis of application: Under this segmentation, the report considers various applications such as residential usage, commercial usage, and industrial usage of meters. The markets of urban and rural applications have also been provided in the report.
On the basis of phase: Single and three phase meters have been considered in this segment.
On the basis of region: The regions analyzed in the report include Asia-Pacific, North America, Europe, the Middle East & Africa, and South America. Developing regions such as Asia-Pacific and Africa find a lucrative market for power meter manufacturers.
Growing environmental concerns, technological upgrade of the old grid infrastructure, and low maintenance cost are the major drivers behind the installation of smart meters in developed regions such as North America and Europe among others. Aging digital meters have to be replaced by technologically advanced smart meters by 2020, thereby boosting the smart meters market.
The report caters to power meter manufacturers, dealers, and suppliers, raw material providers, consulting companies in the energy and power sector, government and research organizations, government utility providers, private utility providers, private customers, network operators, metering companies, smart grid players, venture capital firms, and investment banks. Digital and analog meters have application and growth in developing economies such as Asia-Pacific and Africa, which are improving and enhancing their grid infrastructure to increase their electrification rate. These drivers are expected to push the power metering market size from USD 10,795.4 Million in 2014 to USD 17,850.6 Million by 2020. The report provides insights about the major players of the market and the growth strategies adopted by them. The leading players of the market such as General Electric (U.S.), Itron (U.S.), Toshiba Corp. (Japan), Melrose Plc. (U.K.), and Wasion Group Holdings Ltd. (China) among others have been profiled in this report.
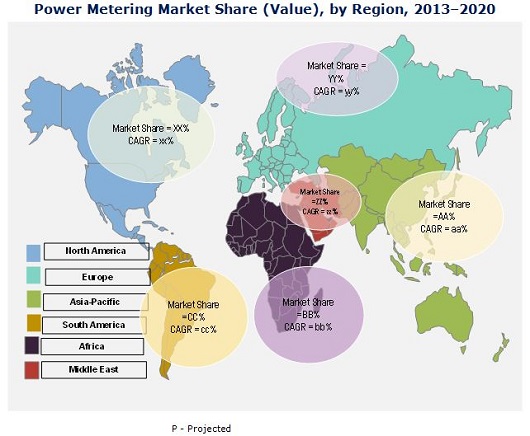
The market was dominated by Asia-Pacific with a share of about 45% in 2014. It is estimated to grow at a CAGR of 9.6% from 2015 to 2020. Europe is expected to be the fastest growing market, at a CAGR of 12.5% during the forecast period. Stringent government regulations to replace digital meters by smart meters would drive the market in the European region.
The power metering market is projected to reach USD 17.8 Billion by 2020, at a CAGR of 8.9% from 2015 to 2020.
According to an estimate, the total world population, which was pegged at 7.3 Billion in 2014, is growing at a rate of 1.14% per year. Governments of the emerging economies in an attempt to provide clean water, sanitation, and living facilities are investing heavily in the development of the infrastructure of their respective regions. This would result in an increase in the number of construction activities, acting as a catalyst for the power metering market. According to an estimate, China along with India in the Asia-Pacific region spent more than USD 1.7 Trillion on construction activities in 2012. Consequently, the region held the largest market share of more than 40% in 2014, and is expected to grow at a high CAGR of more than 8% from 2015 to 2020 to occupy a market share of 46% by 2020. China is relatively a low cost manufacturing base, which proves to be an attractive market for the global power metering manufacturers for sale to the domestic market and export. Governments of the African countries are taking up various initiatives to pace up the electrification rate, which would further drive the power metering market.
A power meter is an electric device that measures energy consumption and enables uni as well as bi-directional communication, between the meter and the central system. The device reads and stores data of the number of units of electricity consumed in intervals, and communicates this information back to the utility for billing and monitoring purposes. Growing environmental concerns, technological upgradation of the old grid infrastructure, low maintenance cost, and two-way communication are few of the major drivers pushing smart meters installations in various developed regions such as North America and Europe. Each region has been analyzed with respect to its market trends, growth, and future prospects, in terms of the power metering market. This report basically aims to estimate the global market for power metering from 2015 to 2020.
In terms of shipments, the power metering market witnessed more than 170 Million units of power meters shipped in 2014. Smart meters accounted for the highest number of shipments. Rising electrification projects, smart meter pilot projects, and aggressive meter replacement are the major drivers of the market in the Asia-Pacific region.
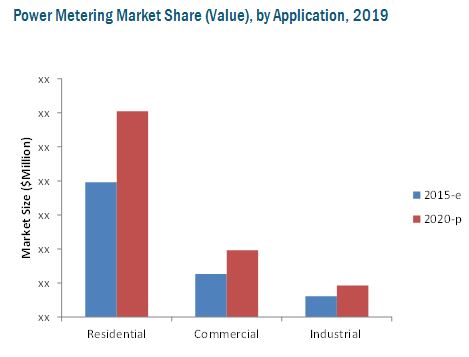
Currently, the residential application dominates the power metering market mainly due to continuous construction of households in the developing economies. According to an estimate, around 270 Million new houses are expected to be constructed in India and China by 2025. Commercial and industrial applications, such as the usage of power meter in educational institutes, shopping complexes, and manufacturing plants hold the second and third largest markets and are expected to do well during the forecast period.
 Exclusive indicates content/data unique to MarketsandMarkets and not available with any competitors.
Table of Contents
1 Introduction (Page No. - 18)
1.1 Objectives of the Study
1.2 Market Definition
1.3 Study Scope
1.3.1 Markets Covered
1.3.2 Years Considered for the Study
1.4 Currency
1.5 Limitations
1.6 Stakeholders
2 Research Methodology (Page No. - 21)
2.1 Research Data
2.1.1 Secondary Data
2.1.1.1 Key Data From Secondary Sources
2.1.2 Primary Data
2.1.2.1 Key Data From Primary Sources
2.1.2.2 Key Industry Insights
2.1.2.3 Breakdown of Primaries
2.2 Market Size Estimation
2.2.1 Bottom-Up Approach
2.2.2 Top-Down Approach
2.3 Market Breakdown & Data Triangulation
2.3.1 Key Data From Primary Sources
2.4 Research Assumptions & Limitations
2.4.1 Assumptions
2.4.2 Limitations
3 Executive Summary (Page No. - 31)
4 Premium Insights (Page No. - 37)
4.1 Attractive Market Opportunities in this Market
4.2 Power Metering Market- Top Meter Type Segment
4.3 Power Metering Market in Asia-Pacific
4.4 Asia-Pacific Dominates this Power Metering Market
5 Market Overview (Page No. - 41)
Key Findings
5.1 Introduction
5.2 Market Dynamics
5.2.1 Drivers
5.2.1.1 Government Mandates & Fiscal Incentives
5.2.1.2 Increasing Demand for Efficient Data Monitoring System
5.2.1.3 Energy Savings
5.2.1.4 Utilities Urge in Enhancing Their Distribution Efficiency
5.2.1.5 High Economic Growth & Rapid Urbanization
5.2.2 Restraints
5.2.2.1 Resistant to New Technologies
5.2.2.2 Financial Constraints
5.2.3 Opportunities
5.2.3.1 Emerging Electrifying Markets
5.2.3.2 Increase in Energy Demand
5.2.4 Challenges
5.2.4.1 Lack of Interoperability
5.2.4.2 Lack of Skilled Labor
5.2.4.3 Delay in Smart Meter Pilot Projects
5.3 Impact of Market Dynamics
5.4 Power Metering Market: Value Chain
5.4.1 Key Influencers
5.5 Porter�s Five Forces Analysis
5.5.1 Threat of Substitutes
5.5.2 Threat of New Entrants
5.5.3 Bargaining Power of Buyers
5.5.4 Bargaining Power of Suppliers
5.5.5 Intensity of Rivalry
6 Market, By Application (Page No. - 57)
6.1 Introduction
6.1.1 Residential Power Metering Market
6.1.2 Commercial Power Metering Market
6.1.3 Industrial Power Metering Market
7 Market, By Type (Page No. - 65)
7.1 Introduction
7.1.1 Smart Meter
7.1.2 Digital Meter
7.1.3 Analog Meter
7.1.4 Others Market
8 Power Metering Market, By Phase (Page No. - 76)
8.1 Introduction
8.1.1 Single Phase Power Metering Market
8.1.2 Three Phase Power Metering Market
9 Market, By Region (Page No. - 82)
9.1 Introduction
9.2 Regional Analysis
9.2.1 North America
9.2.1.1 By Meter Type
9.2.1.2 By Application
9.2.1.3 By Phase
9.2.2 U.S.
9.2.3 Canada
9.2.4 Mexico
9.2.5 South America
9.2.5.1 By Meter Type
9.2.5.2 By Application
9.2.5.3 By Phase
9.2.6 Brazil
9.2.7 Rest of South America
9.2.8 Asia-Pacific
9.2.8.1 By Meter Type
9.2.8.2 By Application
9.2.8.3 By Phase
9.2.8.3.1 China
9.2.8.3.2 India
9.2.8.3.3 Japan
9.2.8.3.4 Rest of Asia-Pacific
9.2.9 Europe
9.2.9.1 By Meter Type
9.2.9.2 By Application
9.2.9.3 By Phase
9.2.9.3.1 Germany
9.2.9.3.2 U.K.
9.2.10 France
9.2.11 Rest of Europe
9.2.12 Middle East
9.2.12.1 By Meter Type
9.2.12.2 By Application
9.2.12.3 By Phase
9.2.12.3.1 Saudi Arabia
9.2.12.3.2 Kuwait
9.2.13 Rest of Middle East
9.2.14 Africa
9.2.14.1 By Meter Type
9.2.14.2 By Application
9.2.14.3 By Phase
9.2.14.3.1 South Africa
9.2.14.3.2 Rest of Africa
10 Competitive Landscape (Page No. - 135)
10.1 Overview
10.2 Market Share Analysis, By Key Players
10.3 Competitive Situation & Trends
10.4 Joint Ventures
10.5 New Product/Technology Developments
10.6 Expansions
10.7 Mergers & Acquisitions
10.8 Contracts & Agreements
11 Company Profiles (Page No. - 145)
11.1 Introduction
11.2 General Electric
11.2.1 Business Overview
11.2.2 Products Offered
11.2.3 Recent Developments, 2014
11.2.4 SWOT Analysis
11.2.5 MnM View
11.3 Itron Inc.
11.3.1 Business Overview
11.3.2 Products/Services Offered
11.3.3 Recent Developments, 2012-2015
11.3.4 SWOT Analysis
11.3.5 MnM View
11.4 Melrose PLC.
11.4.1 Business Overview
11.4.2 Products Offered
11.4.3 Recent Developments, 2012-2015
11.4.4 SWOT Analysis
11.4.5 MnM View
11.5 Toshiba Corporation
11.5.1 Business Overview
11.5.2 Products Offered
11.5.3 Recent Developments, 2012-2015
11.5.4 SWOT Analysis
11.5.5 MnM View
11.6 Wasion Group Holdings Limited
11.6.1 Business Overview
11.6.2 Products/Services Offered
11.7 Recent Developments, 2012-2015
11.8 Source: Company Website, Sec Filings, and Marketsandmarkets Analysisswot Analysis
11.9 MnM View
11.10 ABB Limited
11.10.1 Business Overview
11.10.2 Products Offered
11.10.3 Recent Developments, 2012
11.11 Eaton Corporation
11.11.1 Business Overview
11.11.2 Products Offered
11.11.3 Source: Company Website and Sec Filingsrecent Developments, 2012-2015
11.12 Holley Metering Limited.
11.12.1 Business Overview
11.12.2 Products/Services Offered
11.12.3 Recent Developments, 2012-2014
11.13 Honeywell International Inc.
11.13.1 Business Overview
11.13.2 Products Offered
11.13.3 Recent Developments,
11.14 Jiangsu Linyang Electronics Co., Ltd.
11.14.1 Business Overview
11.14.2 Products Offered
11.14.3 Recent Developments, 2012-2014
11.15 Ningbo Sanxing Electric Co., Ltd.
11.15.1 Business Overview
11.15.2 Products Offered
11.15.3 Source: Company Website and Sec Filingsrecent Developments,
11.16 Schneider Electric
11.16.1 Business Overview
11.16.2 Products Offered
11.16.3 Recent Developments, 2013-2015
11.17 Sensus
11.17.1 Business Overview
11.17.2 Products Offered
11.17.3 Recent Developments
11.18 Siemens AG.
11.18.1 Business Overview
11.18.2 Products/Services Offered
11.18.3 Recent Developments, 2012-2014
12 Appendix (Page No. - 203)
12.1 Insights of Industry Experts
12.2 Discussion Guide
12.3 Available Customizations
12.4 Introducing RT: Real Time Market Intelligence
12.5 Related Reports
List of Tables (96 Tables)
Table 1 Impact of Market Dynamics
Table 2 Power Metering Market Size, By Application, 2013-2020 (USD Million)
Table 3 Residential Market Size, By Region, 2013-2020 (USD Million)
Table 4 Commercial Market Size, By Region, 2013-2020 (USD Million)
Table 5 Industrial Market Size, By Region, 2013-2020 (USD Million)
Table 6 Power Metering Market Size, By Meter Type, 2013-2020 (USD Million)
Table 7 Power Metering Market Size, By Type, 2013-2020 (Million Units)
Table 8 Smart Market Size, By Region, 2013-2020 (USD Million)
Table 9 Smart Market Size, By Region, 2013-2020 (Million Units)
Table 10 Digital Market Size, By Region, 2013-2020 (USD Million)
Table 11 Digital Market Size, By Region, 2013-2020 (Million Units)
Table 12 Analog Market Size, By Region, 2013-2020 (USD Million)
Table 13 Analog Market Size, By Region, 2013-2020 (Million Units)
Table 14 Others Market Size, By Region, 2013-2020 (USD Million)
Table 15 Others Market Size, By Region, 2013-2020 (Million Units)
Table 16 Power Metering Market Size, By Phase, 2013-2020 (USD Million)
Table 17 Single Phase Market Size, By Region, 2013-2020 (USD Million)
Table 18 Three Phase Market Size, By Region, 2013-2020 (USD Million)
Table 19 Power Metering Market Size, By Region, 2013-2020 (USD Million)
Table 20 North America: Market Size, By Country, 2013-2020 (USD Million)
Table 21 North America: Market Size, By Type, 2013-2020 (Million Units)
Table 22 North America: Market Size, By Type, 2013-2020 (USD Million)
Table 23 North America: Market Size, By Application, 2013-2020 (USD Million)
Table 24 North America: Residential Power Metering Market Size, By Application, 2013-2020 (USD Million)
Table 25 North America: Market Size, By Phase, 2013-2020 (USD Million)
Table 26 U.S.: Market Size, By Application, 2013-2020 (USD Million)
Table 27 U.S.: Residential Market Size, By Application, 2013-2020 (USD Million)
Table 28 Canada: Market Size, By Application, 2013-2020 (USD Million)
Table 29 Canada: Residential Market Size, By Application, 2013-2020 (USD Million)
Table 30 Mexico: Market Size, By Application, 2013-2020 (USD Million)
Table 31 Mexico: Residential Market Size, By Application, 2013-2020 (USD Million)
Table 32 South America: Market Size, By Country, 2013-2020 (USD Million)
Table 33 South America: Market Size, By Type, 2013-2020 (Million Units)
Table 34 South America: Market Size, By Type, 2013-2020 (USD Million)
Table 35 South America: Market Size, By Application, 2013-2020 (USD Million)
Table 36 South America: Residential Power Metering Market Size, By Application, 2013-2020 (USD Million)
Table 37 South America: Market Size, By Phase, 2013-2020 (USD Million)
Table 38 Brazil: Power Metering Market Size, By Application, 2013-2020 (USD Million)
Table 39 Brazil: Residential Market Size, By Application, 2013-2020 (USD Million)
Table 40 Rest of South America: Market Size, By Application, 2013-2020 (USD Million)
Table 41 Rest of South America: Residential Power Metering Market Size, By Application, 2013-2020 (USD Million)
Table 42 Asia-Pacific: Market Size, By Country, 2013-2020 (USD Million)
Table 43 Asia-Pacific: Market Size, By Type, 2013-2020 (Million Units)
Table 44 Asia-Pacific: Market Size, By Type, 2013-2020 (USD Million)
Table 45 Asia-Pacific: Market Size, By Application, 2013-2020 (USD Million)
Table 46 Asia-Pacific: Residential Power Metering Market Size, By Application, 2013-2020 (USD Million)
Table 47 Asia-Pacific: Market Size, By Phase, 2013-2020 (USD Million)
Table 48 China: Market Size, By Application, 2013-2020 (USD Million)
Table 49 China: Residential Power Metering Market Size, By Application, 2013-2020 (USD Million)
Table 50 India: Market Size, By Application, 2013-2020 (USD Million)
Table 51 India: Residential Power Metering Market Size, By Application, 2013-2020 (USD Million)
Table 52 Japan: Market Size, By Application, 2013-2020 (USD Million)
Table 53 Japan: Residential Power Metering Market Size, By Application, 2013-2020 (USD Million)
Table 54 Rest of Asia-Pacific: Market Size, By Application, 2013-2020 (USD Million)
Table 55 Rest of Asia-Pacific: Residential Power Metering Market Size, By Application, 2013-2020 (USD Million)
Table 56 Europe: Power Metering Market Size, By Country, 2013-2020 (USD Million)
Table 57 Europe: Market Size, By Type, 2013-2020 (Million Units)
Table 58 Europe: Market Size, By Type, 2013-2020 (USD Million)
Table 59 Europe: Market Size, By Application, 2013-2020 (USD Million)
Table 60 Europe: Residential Power Metering Market Size, By Application, 2013-2020 (USD Million)
Table 61 Europe: Power Metering Market Size, By Phase, 2013-2020 (USD Million)
Table 62 Germany: Power Metering Market Size, By Application, 2013-2020 (USD Million)
Table 63 Germany: Residential Power Metering Market Size, By Application, 2013-2020 (USD Million)
Table 64 U.K.: Power Metering Market Size, By Application, 2013-2020 (USD Million)
Table 65 U.K.: Residential Power Metering Market Size, By Application, 2013-2020 (USD Million)
Table 66 France: Power Metering Market Size, By Application, 2013-2020 (USD Million)
Table 67 France: Residential Power Metering Market Size, By Application, 2013-2020 (USD Million)
Table 68 Rest of Europe: Power Metering Market Size, By Application, 2013-2020 (USD Million)
Table 69 Rest of Europe: Residential Power Metering Market Size, By Application, 2013-2020 (USD Million)
Table 70 Middle East: Power Metering Market Size, By Country, 2013-2020 (USD Million)
Table 71 Middle East: Market Size, By Type, 2013-2020 (Million Units)
Table 72 Middle East: Market Size, By Type, 2013-2020 (USD Million)
Table 73 Middle East: Market Size, By Application, 2013-2020 (USD Million)
Table 74 Middle East: Residential Power Metering Market Size, By Application, 2013-2020 (USD Million)
Table 75 Middle East: Market Size, By Phase, 2013-2020 (USD Million)
Table 76 Saudi Arabia: Power Metering Market Size, By Application, 2013-2020 (USD Million)
Table 77 Saudi Arabia: Residential Power Metering Market Size, By Application, 2013-2020 (USD Million)
Table 78 Kuwait: Power Metering Market Size, By Application, 2013-2020 (USD Million)
Table 79 Kuwait: Residential Power Metering Market Size, By Application, 2013-2020 (USD Million)
Table 80 Rest of Middle East: Power Metering Market Size, By Application, 2013-2020 (USD Million)
Table 81 Rest of Middle East: Residential Power Metering Market Size, By Application, 2013-2020 (USD Million)
Table 82 Africa: Power Metering Market Size, By Country, 2013-2020 (USD Million)
Table 83 Africa: Market Size, By Type, 2013-2020 (Million Units)
Table 84 Africa: Market Size, By Type, 2013-2020 (USD Million)
Table 85 Middle East: Power Metering Market Size, By Application, 2013-2020 (USD Million)
Table 86 Africa: Residential Power Metering Market Size, By Application, 2013-2020 (USD Million)
Table 87 Africa: Market Size, By Phase, 2013-2020 (USD Million)
Table 88 South Africa: Market Size, By Application, 2013-2020, (USD Million)
Table 89 South Africa: Residential Power Metering Market Size, By Application, 2013-2020, (USD Million)
Table 90 Rest of Africa: Market Size, By Application, 2013-2020 (USD Million)
Table 91 Rest of Africa: Residential Power Metering Market Size, By Application, 2013-2020 (USD Million)
Table 92 Joint Ventures, 2012-2015
Table 93 New Product/Technology Launches, 2015
Table 94 Expansions, 2015
Table 95 Mergers & Acquisitions, 2012-2014
Table 96 Contracts & Agreements, 2015
List of Figures (52 Figures)
Figure 1 Markets Covered: Power Metering Market
Figure 2 Power Metering Market: Research Design
Figure 3 Market Size Estimation Methodology: Bottom-Up Approach
Figure 4 Market Size Estimation Methodology: Top-Down Approach
Figure 5 Market Breakdown & Data Triangulation
Figure 6 Limitations of Research Study
Figure 7 Asia-Pacific Occupied the Largest Market Share in 2014
Figure 8 Power Metering Market Snapshot (2015 vs 2020): Europe is Expected to Exhibit the Highest Growth Rate in the Next Five Years
Figure 9 Power Metering Market Share (Value), By Meter Type, 2014
Figure 10 The Residential Application Would Continue to Dominate in this Market in the Next Five Years
Figure 11 Market Size, 2015 & 2020 (USD Million)
Figure 12 Rise in Government Regulations & Construction of New Households Would Boost the Power Metering Market
Figure 13 Smart Meter is Expected to Lead the Demand for Power Metering in the Next Five Years
Figure 14 Residential Applications Accounted for the Maximum Share in this Market
Figure 15 Asia-Pacific Commanded Around Half of the Market Share in 2014
Figure 16 Power Metering Market: Value Chain (2014)
Figure 17 Porter�s Five Force Analysis: Power Metering Market
Figure 18 Market Share (Value), By Application, 2014
Figure 19 Market Size, By Application, 2014
Figure 20 Europe is Expected to Be the Fastest Growing Region in the Residential Market During the Forecast Period
Figure 21 Commercial Power Metering Market Share (Value), By Region, 2014
Figure 22 Power Metering Market Share (Value), By Type, 2014
Figure 23 Smart Meters Market Share (Value), By Region, 2014
Figure 24 Asia-Pacific is Driving the Growth of the Digital Power Metering Market
Figure 25 Power Metering Market Share (Value), By Phase, 2014
Figure 26 Europe is the Fastest Growing Region in the Single Phase Power Metering Market
Figure 27 Regional Snapshot �Developing Economies are Emerging as New Hot Spots
Figure 28 China & U.K. - an Attractive Destination for Commercial & Industrial Applications
Figure 29 Companies Adopted Contracts & Agreements and Joint Ventures as Key Growth Strategies in the Past Four Years
Figure 30 Toshiba (Landis+Gyr) Held the Largest Share in this Market, 2014
Figure 31 Market Evaluation Framework
Figure 32 Battle for Market Share: Contracts & Agreements Was the Key Strategy
Figure 33 Geographic Revenue Mix of the Top Market Players
Figure 34 General Electric.: Company Snapshot
Figure 35 GE.: SWOT Analysis
Figure 36 Itron Inc.: Company Snapshot
Figure 37 Itron Inc.: SWOT Analysis
Figure 38 Melrose PLC.: Company Snapshot
Figure 39 Melrose PLC.: SWOT Analysis
Figure 40 Toshiba Corporation: Company Snapshot
Figure 41 Toshiba.: SWOT Analysis
Figure 42 Wasion Group Holdings Limited.: Business Overview
Figure 43 Wasion Group Holdings Limited: SWOT Analysis
Figure 44 ABB Limited: Company Snapshot
Figure 45 Eaton Corporation: Company Snapshot
Figure 46 Holley Metering: Company Snapshot
Figure 47 Honeywell International Inc.: Company Snapshot
Figure 48 Jiangsu Linyang Electronics Co., Ltd.: Company Snapshot
Figure 49 Ningbo Sanxing Electric Co., Ltd.: Company Snapshot
Figure 50 Schneider Electric: Company Snapshot
Figure 51 Sensus: Company Snapshot
Figure 52 Siemens AG: Company Snapshot


Growth opportunities and latent adjacency in Power Metering Market