
Smart Meter Market

Smart Meter Market by Type (Electric, Gas, Water), Component (Hardware, Software), Technology (AMI, AMR), Communication Technology (RF, PLC, Cellular), End User (Residential, Commercial, Industrial), and Region - Global Forecast to 2030


OVERVIEW
Source: Secondary Research, Interviews with Experts, MarketsandMarkets Analysis
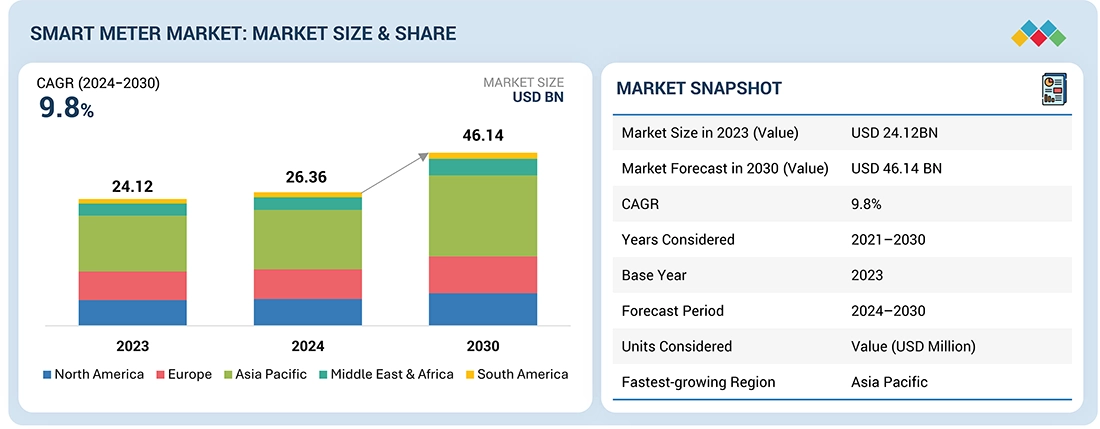
The global smart meter market is expected to grow at a CAGR of 9.8% during the forecast period, from an estimated USD 26.36 Billion in 2024 to USD 46.14 Billion in 2030. Major factors that would further drive the adoption of smart meters include stringent government policies, increased awareness of the disadvantages of carbon footprint, contactless billing, improved grid reliability and efficient outage response, and the strong need for data analytics in the electric power industry. The market exhibits promising growth, given the increasing demand for infrastructure modernization, and digitalization of utilities.
KEY TAKEAWAYS
-
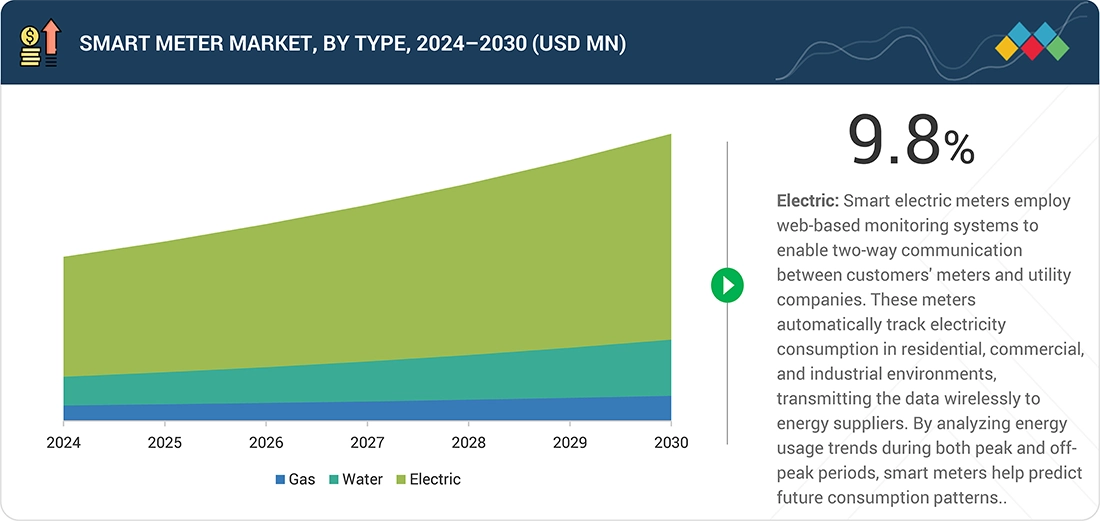
BY TYPEElectric meters will experience important growth because of their accurate monitoring capabilities. The meters deliver accurate real-time electricity usage information which helps make billing more accurate while improving energy preservation performance. Electric smart meters use IoT technology coupled with AI-powered analytics to find inconsistencies while optimizing how electricity is distributed and operating demand response systems. The combination of two-way communication lets utilities conduct remote monitoring and energy usage control which helps minimize power losses during operation. Smart grids coupled with renewable energy integration creates an enhanced need for electric smart meters. Market expansion receives a boost from government programs which support the uptake of smart infrastructure
-
BY TECHNOLOGYThe largest share of the global smart meter market by technology was held by AMI, which is made of automated small devices to collect data on water usage and allows two-way communication between the metering devices and the utility personnel, either on demand or on a set schedule. This smooths remote communication through an electronic interface that includes hardware and software to perform its solutions. AMI is well-positioned to utilize ultrasonic and electromagnetic water meters because these meters are outfitted with encoders, registers, and transmitters for effective monitoring of units consumed. The collected data can be transferred through one of the readily available fixed networks, such as BPL, PLC, fixed RF networks, and public networks (e.g., landline, cellular, and paging networks). As for the growing per-unit cost comparison between advanced meters and one-way meters, there is growing acceptance from different water utilities to deploy this generation of technology. AMI, along with other advanced utility technologies, reduces the need for manual intervention by automatically performing certain tasks.
-
Communication TechnologySmart meters with RF-based communication technology include two operational modules which support mesh technology and point-to-point technology. These meters establish a LAN connection to cloud collectors before using WAN methods to transfer data to utility central locations. The combining features of this technology provide extensive bandwidth and low-latency benefits while facing problems with distant and rough land in rural areas. The smart meters of point-to-point technology make direct connections with the collector through a primary tower function.
-
BY COMPONENTBased on components, the smart meter market has been split into hardware and software. The customer information system (CIS), meter data management system (MDMS), and metering and billing software are critical software components of smart meters. The software helps manage the operations of smart meters once deployed by the utilities. Smart meter software aids in the detection of abnormal utility consumption patterns and the accurate billing of consumers.
-
BY END USERSmart meter market expansion in the commercial sector mainly stems from commercial facilities growth and development initiatives. Businesses can use real-time energy usage details acquired from Smart meters to monitor consumption habits and notice usage patterns that need improvement. The improved utility of monitoring and managing energy activity delivers savings in energy costs that directly strengthen business profitability. Businesses can achieve maximum energy optimization with Smart meters because these devices provide them access to data that enables waste reduction and consumption optimization.
-
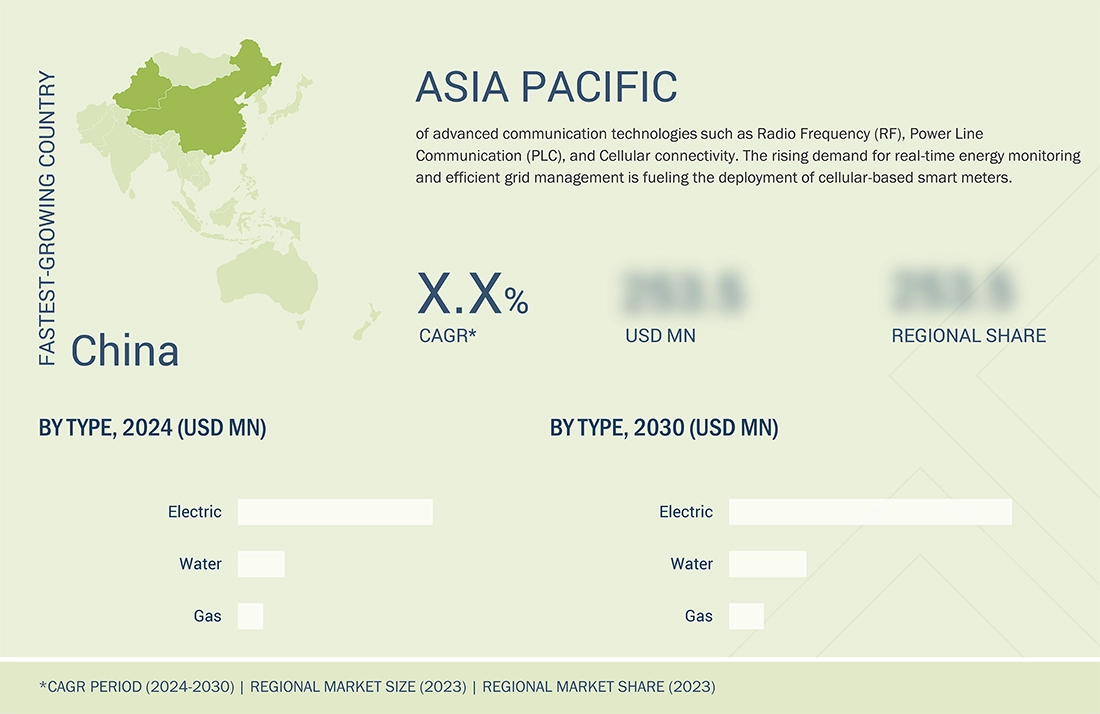
BY REGIONThe Smart meter market expansion will show its most rapid growth within the Asia Pacific region. The Asia Pacific region demonstrates high demand for smart meters because governments have imposed new rules and companies invest more in transforming grid systems to handle elevated electricity consumption. The three nations of China, Japan, and India spend money on grid development activities to enhance distribution systems credibility.
-
COMPETITIVE LANDSCAPEThe major market players have adopted both organic and inorganic strategies, including expansions, sales contracts, acquisitions, agreements, investments, product launches, partnerships, and collaborations. For instance, Landis+Gyr signed a comprehensive 15-year agreement with TREFOR Infrastruktur A/S to deliver, implement, and support a new generation of smart meters and digital infrastructure across TREFOR’s service areas.
Security providers now use smart meter solutions to track power operations and achieve better quality control through real-time data monitoring and control functions. The rising demand for smart meters systems will surge worldwide because these technology solutions deliver current consumption information needed to manage operations involved with power transmission distribution and generation. Smart meter development faces obstacles as a challenge for governments when building sustainable infrastructure. Increased investing in smart meter infrastructure arises from rising access breaches of water supply and sanitation systems as well as water-intensive development patterns combined with expanding populations and water contamination.
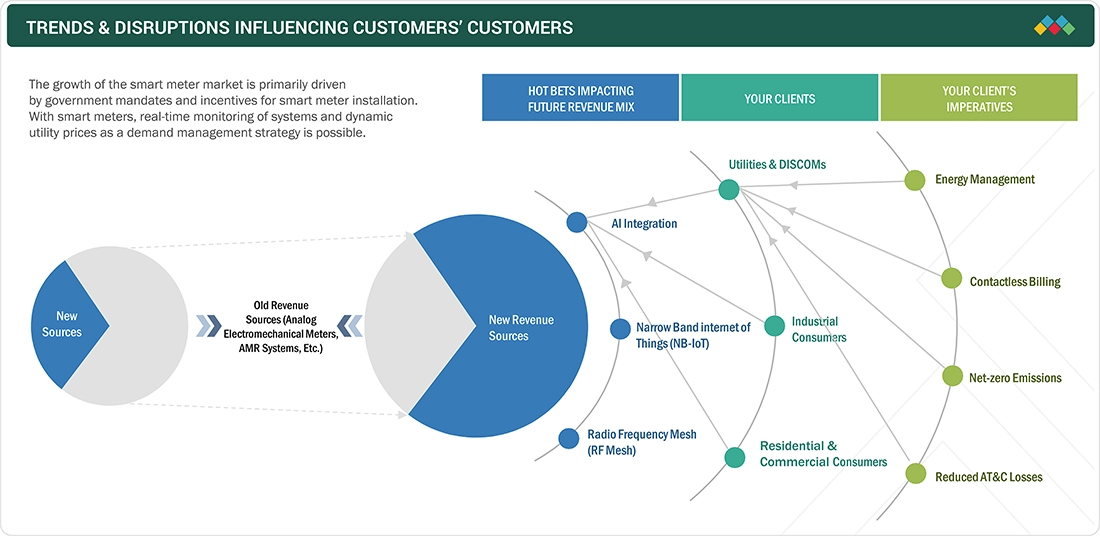
TRENDS & DISRUPTIONS IMPACTING CUSTOMERS' CUSTOMERS
The smart meter market is growing rapidly due to government efforts for energy conservation and carbon emission reduction, alongside the integration of IoT and advanced analytics. These technologies allow real-time data collection, helping utilities and consumers optimize energy use, support predictive maintenance, and improve operational efficiency. AI is transforming smart metering with enhanced data analytics and security, detecting irregularities and enabling real-time decision making. RF mesh networks create self-healing, scalable infrastructures by allowing meters to relay data and maintain communication, even if some nodes fail. These networks facilitate two-way communication, remote data collection, and device management, which lowers maintenance costs and boosts efficiency. While technological innovation and regulatory support propel industry expansion, successful implementation depends on overcoming challenges related to technical standards, interoperability, security, privacy, and consumer acceptance to achieve smart metering’s full benefits.
Source: Secondary Research, Interviews with Experts, MarketsandMarkets Analysis
MARKET DYNAMICS
Level
-
Driver: High adoption of preventive measures against grid blackouts and utility system failures

-
Government focus on modernizing grid infrastructure

Level
-
Restraints: High setup and operational costs, coupled with interoperability issues

-
Concerns related to consumer acceptance and ROI delays

Level
-
Opportunities: Pressing need to reduce non-revenue water losses

-
Focus of governments worldwide on reducing aggregate technical and commercial losses in power grids

Level
-
Challenges: Requirement for highly skilled professionals, coupled with data privacy and security concerns

-
Complexities in building reliable connections between smart meters and smart grid devices

Source: Secondary Research, Interviews with Experts, MarketsandMarkets Analysis
Driver: High adoption of preventive measures against grid blackouts and utility system failures
Smart meters serve as a robust solution for managing utility supply, monitoring consumption in real time, and logging outage events along with their duration. The integrated sensors and communication systems of smart meters facilitate rapid detection and resolution of blackout incidents. They also provide critical data for mapping outage occurrences, enabling utilities to implement preventive measures against future disruptions. The data collected from smart meter communication systems allows utilities to effectively visualize, analyse, and manage repairs, thereby minimizing downtime and operational costs while expediting service restoration. For example, smart meters can generate and transmit outage alerts to utility operators and enable close monitoring of high-priority energy users such as hospitals, fire stations, critical industrial facilities, and military installations. Furthermore, during natural disasters, smart meters contribute to mitigating grid blackouts by providing real-time notifications to utilities regarding prolonged outages at end-use facilities. This data is instrumental for utilities to assess whether an outage originates from their infrastructure, allowing for swift identification and resolution of utility-side issues. Overall, this data-driven approach reduces operational and maintenance expenses while enhancing service reliability during power interruptions.
Restraints: High setup and operational costs, coupled with interoperability issues
The initial investment involved in setting up smart meter infrastructure is very high compared to traditional meters, and it takes a longer time to achieve high returns on investment (RoI). Consequently, utility providers have a tough time reaching breakeven. The requirement for huge capital also poses a big challenge to both energy consumers and utility providers. In most countries, the state does not provide subsidies, and there are no binding targets or mandates for smart gas and smart water meter installations. Utilities have been relying on a combination of standard and non-standard proprietary technologies to implement smart water metering systems. The incompatibility makes it challenging to interconnect different systems or upgrade the existing networks based on proprietary technologies. There is also the risk of vendor lock-in, expensive upgrades, and a lack of flexibility. The lack of widely accepted open communications standards is another critical issue. Plenty of meters use NB-IoT, LoRa, and other standard protocols. The transition to electric smart water meters presents significant financial implications and logistical hindrances, particularly when considering replacing millions of legacy devices. Instead of installing costly digital models, utilities can add digital technologies to existing conventional meters. Some popular upgrade methods include adding an optical character recognition (OCR) camera and attaching a pulse logger. Utilities can add the RS485 Mbus or Modbus interfaces or modules to transmit consumption data from the water meter to a logging platform. The entire project depends on the utility planning to undertake the rollout; hence, funding is a serious concern. Interoperability issues in smart metering devices and components from different OEMs, the requirement to integrate and upgrade software solutions for better output, and the complexity in maintenance and repair of smart meters also increase the operational expenditure. The outdated regulatory framework and the promise of better technology in the future at a reduced cost could hinder market growth.
Opportunities: Pressing need to reduce non-revenue water losses
Water utilities, consisting of domestic companies, are responsible for the safe and efficient distribution of water and related services. These companies operate under federal, state, and municipal jurisdiction and are subject to strict regulations. Furthermore, they frequently encounter limited operational budgets that restrict their capacity to make substantial upfront capital investments. Managing water usage has become increasingly complex due to factors such as stringent regulations, rising water costs, aging infrastructure, and financial constraints. One of the biggest challenges these utilities face is non-revenue water (NRW) losses—the gap between the volume of water supplied and the amount ultimately billed. Several factors contribute to NRW losses, including inaccurate mechanical meters, manual meter readings, and unmetered consumption. Water loss primarily occurs due to leaks, theft, storage tank overflows, unauthorized usage, and the provision of free water to some consumers. According to the International Water Association, NRW accounts for an average of 30–35% of the total water available for consumption globally each year. Utilities must cover the energy costs of pumping non-revenue water and repairing leaks, leading to higher operational expenses and decreased efficiency. The World Bank’s Energy and Water Department estimates that global NRW losses amount to approximately USD 14 billion annually. The World Bank further estimates that water utilities worldwide incur losses of approximately USD 141 billion annually due to NRW, with one-third of these losses occurring in developing economies. This presents a substantial opportunity for the smart water meters market. By improving operational efficiencies, enhancing billing accuracy, engaging consumers in conservation efforts, and driving technological advancements, the smart water meters market stands to gain significantly from the ongoing challenges faced by water utilities worldwide.
Challenges: Requirement for highly skilled professionals, coupled with data privacy and security concerns
The designs of smart meters are evolving in complexity, resulting in challenges during installation and maintenance. This intricacy necessitates the involvement of highly trained technicians, even for troubleshooting minor issues. Additionally, smart meters are frequently dispatched to service centers for necessary maintenance and repairs. Smart meters may encounter technical issues, such as software glitches, connectivity problems, or hardware malfunctions, necessitating professional intervention. Further, the need for regular maintenance increases the total cost of ownership for utility providers. This includes both direct costs (repair and replacement) and indirect costs (downtime and labor). Smart meters empower utility providers with a vast network of electronic devices and large volumes of consumer data. As the smart meter collects and transmits large data volumes to utility providers, system integrators, and service providers, protecting this data from antisocial elements becomes imperative. Connected smart meters pose a risk of cyber threats, as hackers, attackers, terrorists, and dissatisfied customers could gain access to critical information, posing a danger to society and businesses. Hence, maintaining integrity and reliability for the entire lifecycle of devices is crucial to ensuring the effective working of smart water management. This can be done by conducting proper risk assessment analysis and cybersecurity programs. Smart meters are an integral part of any smart grid operations, and their physical security is also a major concern to solution providers. Cybersecurity in smart grid systems is becoming a major concern throughout the grid communication networks and software platforms that operate and manage the entire grid.
Smart Meter Market: COMMERCIAL USE CASES ACROSS INDUSTRIES
| COMPANY | USE CASE DESCRIPTION | BENEFITS |
|---|---|---|
 |
In South Africa, widespread energy theft adversely impacts an electricity supplier’s revenue and affects electricity production planning. Average household electricity consumption is expected to grow as the country’s economy grows. Hence, proper grid management and fair billing are necessary parameters for any operator. | The smart metering project in the city of Potchefstroom helped local resellers turn a budget deficit of ZAR 40,000 into a surplus of ZAR 15,000 because smart metering can draw a detailed consumption map, which makes it possible to estimate consumption accurately and determine appropriate tariffs. In the town of Lephalale, with a population of about 18,000, the residents will soon get the chance to bring down their electricity costs more smartly and comfortably. The management believes that residents will use electricity sparingly by knowing how much is spent on electricity daily. Also, illegal connections will instantly be picked up on the system. |
 |
Yorkshire Water, a prominent UK water utility serving 5.5 million customers, faced significant challenges in water resource management and infrastructure efficiency. The primary problem was the substantial water loss through undetected leaks, inefficient consumption tracking, and limited real-time insights into water distribution networks. To address these critical issues, the company strategically awarded a USD 58.46 million smart metering contract to Netmore Group, targeting comprehensive digital transformation of its water management infrastructure. | The solution involved deploying 1.3 million LoRaWAN-enabled smart meters across the Yorkshire region, designed to provide hourly consumption data, enable immediate leak detection, and offer granular insights into water usage patterns. By implementing this advanced metering infrastructure, Yorkshire Water aims to dramatically reduce non-revenue water losses, enhance operational efficiency, and support its ambitious sustainability goals of halving network leakage by 2050. The smart metering initiative represents a significant technological leap, transforming traditional water management approaches through real-time data analytics, network monitoring, and proactive infrastructure maintenance. |
 |
Western Municipal Water District (US) sought to upgrade its meter reading infrastructure and enhance operational efficiency for its 24,000 retail customer accounts, which previously depended on manual drive-by meter reading methods. | The district launched a pilot study utilizing Neptune's LoRaWAN-equipped technology to evaluate remote meter reading capabilities by deploying 100 smart meters. The pilot achieved an impressive reading success rate exceeding 99%, setting the stage for future automated metering infrastructure (AMI) implementation. This initiative supported Western Water's objective of enhancing operational efficiency and providing customers with near real-time water usage insights through technological innovation. |
Logos and trademarks shown above are the property of their respective owners. Their use here is for informational and illustrative purposes only.
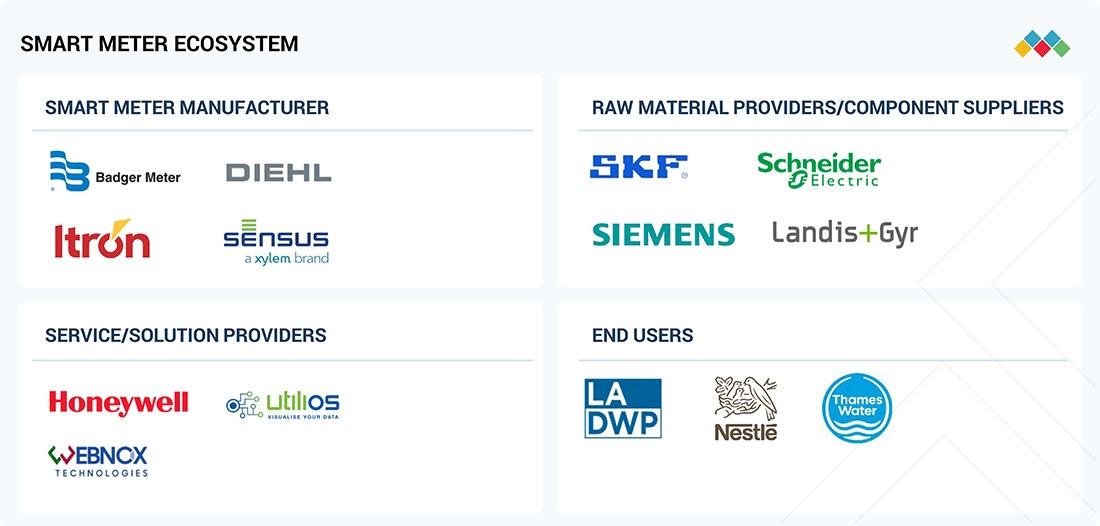
MARKET ECOSYSTEM
The smart meter market ecosystem is changing rapidly as part of the broader transition to smart technologies and digital infrastructure. Key stakeholders in this ecosystem include component suppliers, smart meter manufacturers, service/solution providers, and end users.
Logos and trademarks shown above are the property of their respective owners. Their use here is for informational and illustrative purposes only.
MARKET SEGMENTS
Source: Secondary Research, Interviews with Experts, MarketsandMarkets Analysis
Smart Meter Market, By Type
A web-based monitoring system from smart electric meters maintains two-way communication between utility companies and their customers' meters. The automatic usage data collected by a smart electric meter wirelessly transmits residential commercial and industrial power consumption information to the energy provider. Some electric meters use their analysis capability to examine energy consumption patterns across peak and off-peak hours which helps foresee future consumption patterns to decrease electricity costs.
Smart Meter Market, By Component
In the global smart meter market, by component, the hardware segment accounted for a major share in 2023. Power sources, microcontroller units, and communication modules are components of smart meter hardware. Power sources are critical to the continued operation of smart meters. For operations, the power source hardware component must be connected to an internal battery or powered by electricity lines.
Smart Meter Market, By Technology
By technology, the smart meter market has been segmented into AMI & AMR. AMI enables the meters to collect and transmit data on utility and energy use in real-time. The foundation of smart grid projects is smart meters employing AMI technology, and rising investment in such projects serves as a major growth driver for the market for AMI smart meters
Smart Meter Market, By Communication Technology
Smart meters typically transmit data to a local smart meter gateway, aggregating data from all meters in an area and then forwarding it to the cloud, where providers and customers can access it through a platform. This study segments smart meter communication technology into three major categories: radiofrequency (RF), power line communication (PLC), and cellular technology.. The cellular communication technology segment held a significant market share in 2023 and is projected to dominate the overall market during the forecast period. Cellular technology is leading the expansion due to its scalability, reliability, and integration with modern IoT and 5G advancements. PLC and RF technologies continue to grow steadily, benefiting from established infrastructure and cost-effectiveness. Government regulations, smart grid initiatives, and the need for real-time energy monitoring accelerate the adoption across all technologies. With utilities investing heavily in digital transformation and advanced metering infrastructure, smart meters are becoming essential for optimizing energy distribution and consumption on a global scale.
Smart Meter Market, By End User
Smart meters are advanced versions of traditional utility meters that can automatically transmit usage data to the utility company, allowing more accurate and efficient billing and better energy consumption tracking. Some potential applications are automated billing, real-time energy monitoring, time-of-use pricing, demand response, grid management, and fraud detection. Based on end user, the smart meter market has been segmented into residential, commercial, and industrial.
REGION
Asia Pacific to be fastest region in global smart meter market during forecast period
Asia Pacific segment is expected to be the fastest-growing region in the smart meter market. The Smart meter market expansion will show its most rapid growth within the Asia Pacific region. The Asia Pacific region demonstrates high demand for smart meters because governments have imposed new rules and companies invest more in transforming grid systems to handle elevated electricity consumption. The three nations of China, Japan, and India spend money on grid development activities to enhance distribution systems credibility. Some of the major players in the smart meter market are Landis+Gyr (Switzerland), Itron Inc. (US), Sagemcom (France), OSAKI ELECTRIC CO., LTD. (EDMI) (Singapore), Siemens (Germany), and Sensus (Xylem) (US). The major strategies adopted by these players include acquisitions, sales contracts, product launches, agreements, alliances, partnerships, and expansions
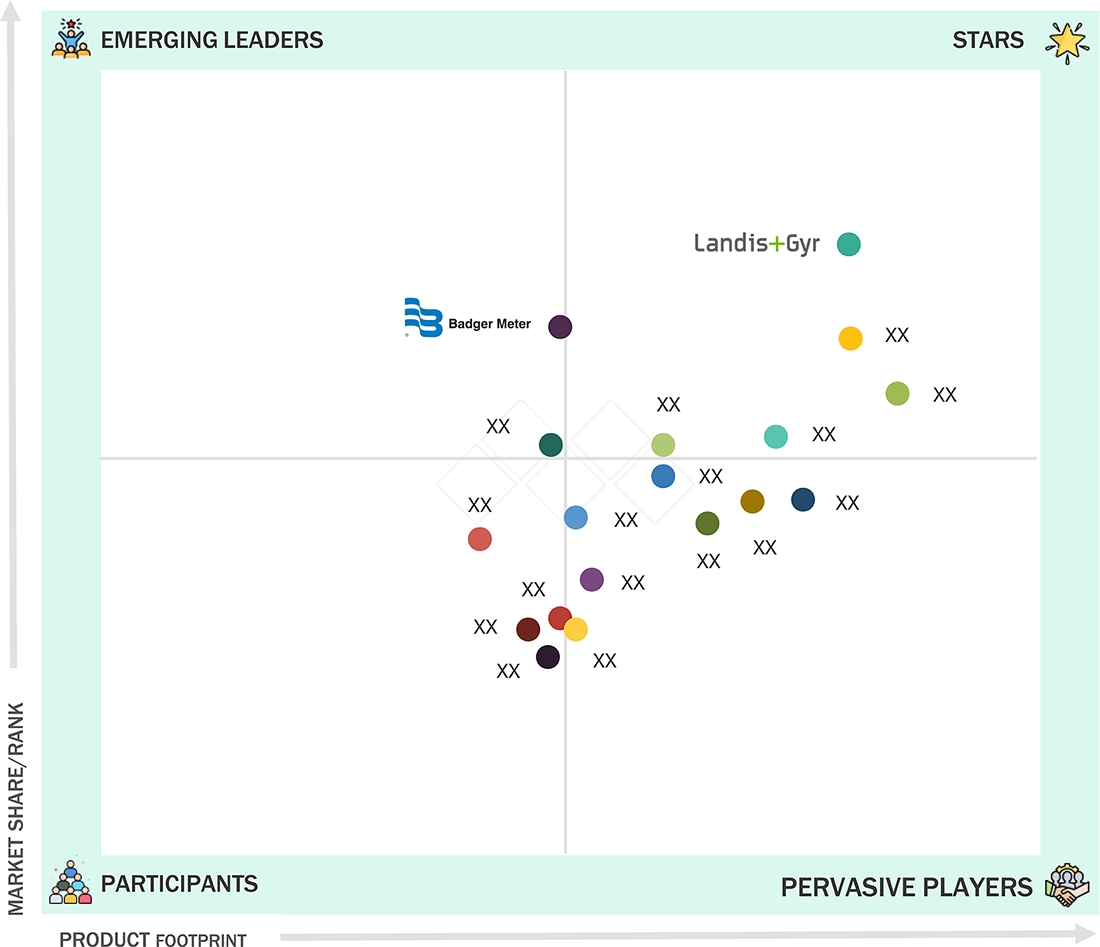
Smart Meter Market: COMPANY EVALUATION MATRIX
Landis+Gyr (Star) in the smart meter market, with high market share/rank and a strong product footprint. With extensive product offerings and significant influence across global smart metering solutions. In contrast, Badger Meter Inc. (Emerging Leader) with strong market share or rank, and more focused or narrower product footprint compared to pervasive players. Badger Meter Inc. is recognized for its consistent growth and market presence, steadily expanding its smart metering solutions and strengthening its position within the industry.?
Source: Secondary Research, Interviews with Experts, MarketsandMarkets Analysis
KEY MARKET PLAYERS
MARKET SCOPE
| REPORT METRIC | DETAILS |
|---|---|
| Market Size in 2023 (Value) | USD 24.12 BN |
| Market Forecast in 2030 (Value) | USD 46.14 BN |
| Growth Rate | 9.8% |
| Years Considered | 2021–2030 |
| Base Year | 2023 |
| Forecast Period | 2024–2030 |
| Units Considered | Value (USD Million) |
| Report Coverage | Revenue forecast, company ranking, competitive landscape, growth factors, and trends |
| Segments Covered |
|
| Regions Covered | North America, Asia Pacific, Europe, Middle East & Africa and South America |
WHAT IS IN IT FOR YOU: Smart Meter Market REPORT CONTENT GUIDE
DELIVERED CUSTOMIZATIONS
We have successfully delivered the following deep-dive customizations:
| CLIENT REQUEST | CUSTOMIZATION DELIVERED | VALUE ADDS |
|---|---|---|
| NA |
RECENT DEVELOPMENTS
- November 2024 : Landis+Gyr signed a comprehensive 15-year agreement with TREFOR Infrastruktur A/S to deliver, implement, and support a new generation of smart meters and digital infrastructure across TREFOR’s service areas.
- February 2024 : Itron Inc. debuted its Itron Enterprise Edition (IEE) Cloud, an enterprise-grade, cloud-exclusive Meter Data Management (MDM) platform that meets the dynamic needs of today’s utilities on their journey toward digitalization.
- March 2024 : Kamstrup set up its new North American headquarters and manufacturing facility in Forsyth County, Georgia.
- June 2023 : sensus (Xylem) introduced the Cordonel, a cutting-edge ultrasonic water meter designed to revolutionize water utility services for commercial and industrial customers.
- Jully 2022 : Wasion Group signed an agreement with Alsharif Holding Group to supply smart water and electricity meters in Saudi Arabia.
Table of Contents
 Exclusive indicates content/data unique to MarketsandMarkets and not available with any competitors.
Methodology
The study involved major activities in estimating the current size of the smart meter market. Exhaustive secondary research was done to collect information on the peer and parent markets. The next step was to validate these findings, assumptions, and sizing with industry experts across the value chain through primary research. Both top-down and bottom-up approaches were employed to estimate the complete market size. Thereafter, market breakdown and data triangulation were used to estimate the market size of the segments and subsegments.
Secondary Research
This research study on the smart meter market involved the use of extensive secondary sources, directories, and databases, such as Hoovers, Bloomberg, Businessweek, Factiva, International Energy Agency, and BP Statistical Review of World Energy, to identify and collect information useful for a technical, market-oriented, and commercial study of the global smart meter market. The other secondary sources included annual reports, press releases, and investor presentations of companies, white papers, certified publications, articles by recognized authors, manufacturer associations, trade directories, and databases.
Primary Research
The smart meter market comprises several stakeholders such as smart meter manufacturers, manufacturers of components of smart meter infrastructure, technology providers, and technology support providers in the supply chain. The demand side of this market is characterized by the rising demand for smart meter in the nations to reduce the non-revenue water losses and to improve the power infrastructure. The supply side is characterized by rising demand for contracts from the distribution utilities, and mergers and acquisitions among big players. Various primary sources from both the supply and demand sides of the market were interviewed to obtain qualitative and quantitative information.

Note 1: Others include sales managers, marketing managers, and product managers.
Note 2: Tier 1 companies’ revenues are more than USD 10 billion; tier 2 companies’ revenues range between USD 1 and 10 billion; and tier 3 companies’ revenues range between USD 500 million and USD 1 billion.
Source: Industry Experts
To know about the assumptions considered for the study, download the pdf brochure
Market Size Estimation
Both the top-down and bottom-up approaches were used to estimate and validate the size of the smart meters market and its dependent submarkets. The key players in the market were identified through secondary research, and their market share in the respective regions was obtained through primary and secondary research. The research methodology includes the study of the annual and financial reports of top market players and interviews with industry experts, such as chief executive officers, vice presidents, directors, sales managers, and marketing executives, for key quantitative and qualitative insights related to the smart meters market.
Smart Meter Market : Top-Down and Bottom-Up Approach

Data Triangulation
After arriving at the overall market size from the estimation process explained above, the total market has been split into several segments and subsegments. To complete the overall market engineering process and arrive at the exact statistics for all the segments and subsegments, the data triangulation and market breakdown processes have been employed, wherever applicable. The data has been triangulated by studying various factors and trends from both the demand- and supply sides. Along with this, the market has been validated using both the top-down and bottom-up approaches.
Market Definition
Smart meters are devices which measure and send instant utility consumption data for electricity, gas, and water service providers. Digital communication systems built into these meters allow automatic data sharing which results in improved billing procedures and improved grid efficiency and consumer demand control systems. Smart meters use wireless networks and sensors to measure power consumption patterns and detect unusual patterns to boost energy efficiency programs. Smart meters achieve remote monitoring and predictive maintenance of utilities through IoT and AI combined with cloud-based platforms while modern utility infrastructure benefits from their seamless connectivity.
Stakeholders
- Government and research organizations
- Institutional investors and investment banks
- Investors/shareholders
- Environmental research institutes
- Consulting companies in energy & power sector
- Raw materials and component manufacturers
- Manufacturers’ associations
- Manufacturing industry
- Energy efficiency consultancies
- Original equipment manufacturers (OEMs) and system integrators
- Engineering, procurement, and construction (EPC) contractors
- Standardization and testing firms
- Meter data management software providers
- Meter manufacturing companies
- Water utilities
Report Objectives
- To define, describe, analyze, and forecast the size of the smart meter market, by type, technology, communication technology, end user, and Component, in terms of value
- To forecast the market size for five major regions?North America, Europe, Asia Pacific, South America, Middle East & Africa?along with their key countries
- To forecast the smart meter market, by region, in terms of volume
- To provide detailed information about the major drivers, restraints, opportunities, and industry-specific challenges influencing the growth of the smart meter market
- To provide detailed information on the market map, value chain, case studies, technologies, market ecosystem, tariff & regulatory landscape, Porter’s Five Forces, and trends/disruptions impacting customers’ businesses that are specific to the smart meter market
- To analyze market opportunities for stakeholders in the smart meter market and draw a competitive landscape for market players
- To benchmark players within the market using the company evaluation matrix, which analyzes market players on various parameters within the broad categories of business excellence and strength of product portfolio
- To compare key market players with respect to market share, product specifications, and end users
- To strategically analyze micromarkets1 with regard to individual growth trends, prospects, and contributions to the total market
- To strategically profile the key players and comprehensively analyze their market share and core competencies2
- To analyze competitive developments in the smart meter market, such as expansions, product launches, and acquisitions
- To study the impact of AI/gen AI on the market under study, along with the macroeconomic outlook for each region.
Note: 1. Core competencies of companies are captured in terms of their key developments and product portfolios, as well as key strategies adopted to sustain their position in the smart meters market.
Available Customizations
MarketsandMarkets offers customizations according to the specific needs of the companies with the given market data.
The following customization options are available for the report:
Product Analysis
- Product matrix, which gives a detailed comparison of the product portfolio of each company
Geographic Analysis as per Feasibility
- Further breakdown of the smart meters market, by country
Company Information
- Detailed analysis and profiling of additional market players (up to five)
Key Questions Addressed by the Report
Need a Tailored Report?
Customize this report to your needs
Get 10% FREE Customization
Customize This ReportPersonalize This Research
- Triangulate with your Own Data
- Get Data as per your Format and Definition
- Gain a Deeper Dive on a Specific Application, Geography, Customer or Competitor
- Any level of Personalization
Let Us Help You
- What are the Known and Unknown Adjacencies Impacting the Smart Meter Market
- What will your New Revenue Sources be?
- Who will be your Top Customer; what will make them switch?
- Defend your Market Share or Win Competitors
- Get a Scorecard for Target Partners

Custom Market Research Services
We Will Customise The Research For You, In Case The Report Listed Above Does Not Meet With Your Requirements
Get 10% Free CustomisationGrowth opportunities and latent adjacency in Smart Meter Market


Daniel
May, 2022
We are interested in Smart Meters Market size for the North America region for the 2022 to 2026 forecast year..
Kathie
Jun, 2022
How do emerging markets offer revenue expansion opportunities and scope for the Smart Meters Market?.