Power Rental Global Contracts & Deals Analysis � 2011 to 2015, by Fuel (Diesel, Gas), By Application (Peak Shaving, Standby Power, Base Load), by End-Use (Utilities, Oil & Gas, Industrial, Construction, Mining, Events), by Power Rating & by Region


[164 Pages Report] The power rental market earns its revenue by renting generators, load banks, and pumps among others or from selling electricity generated from a temporary power plant. Factors such as increasing global electricity demand, especially in emerging economies such as Asia-Pacific and Africa, lack of power infrastructure, and extensive construction & development work in developing countries are the major reasons for large contracts and agreements taking place in the power rental market.
For company profiles in the report, 2014 has been considered. Where information is unavailable for the 2015, the prior year has been considered.
Research Methodology:
- Major regions contributing the maximum share have been identified
- Secondary research has been conducted to find the major applications of power rental in the regions and their impact
- Applications have been identified on the basis of usage in the region and the split has been calculated by conducting primaries with industry participants, subject matter experts, C-level executives of key market players, and industry consultants among other experts, which helped to obtain and verify critical qualitative & quantitative information as well as assess future market prospects
- Revenues of top companies (regional/global), regional energy demand, power capacity, type of fuel used, and MnM KNOW have been used to analyze the deals
- The market has been further broken down into several segments and subsegments on the basis of information gathered
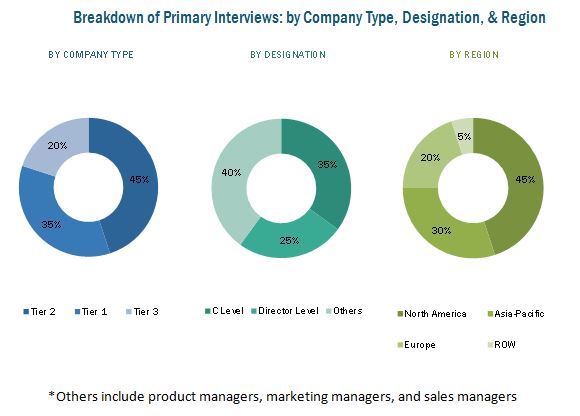
The figure below shows the breakdown of primaries on the basis of company type, designation, and region conducted during the research study.
Target Audience
- Engine/generator manufacturers, dealers, and suppliers
- Power rental companies
- Market research and consulting firms
- Government, investment banks, and research organizations
- IPPs, captive power, and standby power plants
- Renewable energy companies
- End-users that require temporary power regularly such as the construction industry, mining industry, and oil & gas companies
- Permanent power plant developers and power grid infrastructure companies
- Global and regional level energy and power associations
�Primarily, the report provides information about market segments and helps stakeholders to decide their focus areas for the next two to five years for prioritizing efforts and investments�.
Scope of the Report:
On the basis of Contracts & Agreements:
- New Contracts
- Capacity Addition
- Contract Extension
- Agreements
On the basis of Product Portfolio Expansion:
- Power Rating
- Fuel Type
On the basis of Region:
- Asia-Pacific
- North America
- South America
- Europe
- Middle East
- Africa
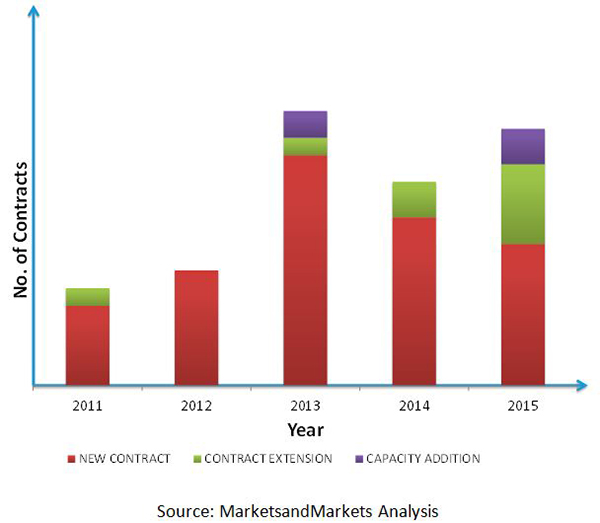
Global power rental contracts and agreements grew by 26% in 2015. This growth is attributed to continued growth of constructional & developmental activities and increasing demand-supply gap of electric power in emerging economies.
The report segments global power rental contracts and deals on the basis of its strategy, which include contracts and agreements, investments and expansions, mergers and acquisitions, strategic alliances & joint ventures, and product portfolio expansions. Contracts and agreements held the largest development share as they are the most sought after strategy among power rental companies. Contracts and agreements help companies in strengthening their financial position in the power rental market and increase brand value, thereby creating more opportunities to grow at the regional level.
Investments and expansions held the second largest development share as this strategy helps power rental companies to grab any immediate opportunities at local and regional levels. Such sudden opportunities include power cuts due to blackouts and power cuts due to natural disasters such as earthquakes, hurricanes, and tsunami. Expansions at local and regional levels also help rental companies to compete with regionally dominant players, in terms of immediate fleet availability and reliability. The investments and expansions strategy can be adopted to grab opportunities such as planned events and utility level contracts for backup, peak loading, and standby power applications. For instance, Aggreko Plc. (U.K.) opened its service center in Cape Town to support oil & gas industries located in the vicinity along with the businesses operating in and around Cape Town�s central business district.
Factors such as continued growth of constructional and developmental activities and increasing demand-supply gap of electric power in emerging economies are driving the growth of power rental contracts and deals for all global as well as regional level players. The main challenge is due to the increase in off grid renewable energy generation. Deals of global players are also affected due to intense competition from regional level players.
Major players in the power rental market, based on their developments, include Aggreko plc. (U.K.), Caterpillar Inc. (U.S.), APR Energy plc. (U.S.), Ashtead Group Plc. (U.K.), and Cummins Inc. (U.S.). These players are trying to penetrate into emerging economies through various strategies such as contracts and agreements, investments and expansions, and mergers & acquisitions to increase market shares in these regions.
 Exclusive indicates content/data unique to MarketsandMarkets and not available with any competitors.
Table of Contents
1 Introduction (Page No. - 15)
1.1 Objectives of the Study
1.2 Market Definition
1.3 Market Scope
1.3.1 Currency & Pricing
1.3.2 Limitations
1.3.3 Stakeholders
2 Research Methodology (Page No. - 18)
2.1 Research Data
2.1.1 Secondary Data
2.1.1.1 Key Data From Secondary Sources
2.1.2 Primary Data
2.1.2.1 Key Data From Primary Sources
2.1.2.2 Key Industry Insights
2.1.2.3 Breakdown of Primaries
2.2 Research Assumptions & Limitations
2.2.1 Assumptions
2.2.2 Limitations
3 Executive Summary (Page No. - 23)
3.1 Power Rental Market Outlook
3.2 Competitive Situation & Trends
3.3 Power Rental Demand Trends & Projections
4 Market Overview (Page No. - 27)
4.1 Introduction
4.2 Market Dynamics
4.2.1 Drivers
4.2.1.1 Continued Growth of Construction & Developmental Activities
4.2.1.2 Unmet Power Demands
4.2.1.3 Inaccessibility to the Electrical Grid in Sub-Saharan Africa & Developing Asia-Pacific Regions
4.2.1.4 End-Users Prefer to Rent
4.2.2 Restraints
4.2.2.1 Stringent Emission Regulations for Diesel Generators
4.2.2.2 Influence of Oil Price Fluctuations on Oil Dependent Sectors
4.2.3 Opportunities
4.2.3.1 Increase in Unforeseen & Planned Events
4.2.3.1.1 Unforeseen Events
4.2.3.1.2 Planned Events
4.2.3.2 Aging Power Infrastructure in North America
4.2.4 Challenges
4.2.4.1 Increase in Off-Grid Renewable Energy Generation
4.2.4.2 Intense Competition From Regional Players
5 Contracts & Deal Analysis (Page No. - 37)
5.1 Contracts & Agreements From 2011 to 2015 (By Quantity)
5.1.1 By Number of Deals
5.1.2 By End-Use Industry
5.1.3 By Fuel Type
5.1.4 By Power Rating (mW)
5.1.5 By Region
5.1.6 By Company
5.1.7 By Contract Tenure
5.1.8 By Disclosed Contracts (USD Million)
5.1.9 By Installation Time
5.1.10 By Strategy
5.1.11 By Approach
5.1.12 New Contracts vs Renewals
5.2 Expansions & Investmentss (Quantity)
5.2.1 By Number of Deals
5.2.2 By Region
5.2.3 By Company
5.2.4 By Deal Value (USD Million)
5.3 Mergers & Acquisitions (Quantity)
5.3.1 By Number of Mergers & Acquisions
5.3.2 By Region
5.3.3 By Company
5.3.4 By Deal Value (USD Million)
5.4 Strategic Alliances & Joint Ventures
5.5 New Product Development From 2011-2015 (By Quantity)
5.5.1 By Number of Deals
5.5.2 Product Enhancement vs Product Launch
5.5.3 By Fuel Type
5.5.4 By Power Rating
5.5.5 By Company
5.5.6 By Strategy
5.5.7 Product Developments During 2011-2015
6 Power Rental Market Size Estimates (Page No. - 65)
6.1 Introduction
6.2 Power Rental Market Size, By End-Use Industry
6.2.1 Utilities
6.2.2 Oil & Gas
6.2.3 Industrial
6.2.4 Construction
6.2.5 Quarrying & Mining
6.2.6 Events
6.2.7 Shipping
6.3 Power Rental Market, By Generator Type
6.3.1 Diesel Generator
6.3.2 Gas Generator
6.3.3 Other Generators
6.4 Power Rental Market, By Application
6.4.1 Peak Shaving
6.4.2 Standby Power
6.4.3 Base Load/Continuous Power
6.5 Power Rental Market, By Generator Power Rating (kW)
6.5.1 Up to 80 kW Rating
6.5.2 81�280 kW Rating
6.5.3 281�600 kW Rating
6.5.4 More Than 600 kW
7 Power Rental Market, By Region (Page No. - 85)
7.1 Introduction
7.2 North America
7.2.1 North America: Power Rental Market Size, By Country
7.3 The Middle East
7.3.1 The Middle East: Power Rental Market Size, By Country
7.4 Asia-Pacific
7.4.1 Asia-Pacific: Power Rental Market Size, By Country
7.5 Africa
7.5.1 Africa: Power Rental Market Size, By Country
7.6 Europe
7.6.1 Europe: Power Rental Market Size, By Country
7.7 South America
7.7.1 South America: Power Rental Market Size, By Country
8 Company Profiles (Page No. - 114)
(Company at A Glance, Recent Financials, Products & Services, Strategies & Insights, & Recent Developments)*
8.1 Introduction
8.2 Aggreko PLC.
8.3 APR Energy PLC.
8.4 Ashtead Group PLC.
8.5 Caterpillar Inc.
8.6 Cummins Inc.
8.7 Atlas Copco AB.
8.8 Generac Power Systems, LLC
8.9 Hertz Corporation
8.10 Speedy Hire PLC.
8.11 United Rentals Inc.
8.12 Wracker Neuson
8.13 Altaaqa Global
8.14 Kohler Co. Inc.
8.15 Multiquip Inc.
8.16 Soenergy International Inc.
8.17 Rental Solutions & Services LLC
8.18 Smart Energy Solutions.
8.19 Sakr Power Group
8.20 Jubaili Bros. LLC
8.21 Bredenoord Exploitatiemij B.V.
8.22 Bryne Equipment Rental LLC.
8.23 Arabian Equipment Rentals
8.24 Mohamed ABdulrahman Al-Bahar
8.25 Wajax Power Systems Ltd.
8.26 Americas Generators
8.27 Drumco Energy Inc.
8.28 Enerco-Tamimi Power & Industrial Group
8.29 GAL Power Systems Ltd.
8.30 Loue Froid Inc.
8.31 Nour Energy
8.32 Peax Equipment Rental
8.33 Power Electrics (Bristol) Limited
8.34 Simplex Equipment Rental Inc.
8.35 Taylor Power Systems Inc.
*Details on Company at A Glance, Recent Financials, Products & Services, Strategies & Insights, & Recent Developments Might Not Be Captured in Case of Unlisted Companies.
List of Tables (66 Tables)
Table 1 Power Consumption (Quadrillion Btu), By Region, 2010-2040
Table 2 Access to Electricity in 2013
Table 3 List of Major Global & Regional Players Per Region
Table 4 Contract Tenure: End-User Preference
Table 5 List of Contracts: By Value (USD Million)
Table 6 List of Contracts: By Installation Time
Table 7 List of Expansions & Investments: By Deal Value (USD Million) From 2011 to 2015
Table 8 List of Mergers & Acquisitions: By Value (USD Million)
Table 9 List of Strategic Alliances & Joint Ventures From 2011 to 2015
Table 10 New Product Development in 2015
Table 11 New Product Development in 2014
Table 12 New Product Development in 2013
Table 13 New Product Development in 2012
Table 14 New Product Development in 2011
Table 15 Power Rental Market Size, By End-Use Industry, 2013�2020 (USD Million)
Table 16 Average Retail Price of Electricity, By End-Use Sector, 2008-2014 (Cents Per Kilowatt-Hour)
Table 17 Utilities: Power Rental Market Size, By Region, 2013�2020 (USD Million)
Table 18 Oil Production, By Region, 2008-2013 (Thousand Barrels Daily)
Table 19 Oil & Gas: Power Rental Market Size, By Region, 2013-2020 (USD Million)
Table 20 Gross Domestic Product of Top 10 Countries, 2010�2013 (USD Million)
Table 21 Industrial: Power Rental Market Size, By Region, 2013-2020 (USD Million)
Table 22 Construction: Power Rental Market Size, By Region, 2013�2020 (USD Million)
Table 23 Quarrying & Mining: Power Rental Market, By Region, 2013�2020 (USD Million)
Table 24 List of Various Events Using Power Rental, 2014�2022
Table 25 Events: Power Rental Market Size, By Region, 2013�2020 (USD Million)
Table 26 Shipping: Power Rental Market Size, By Region, 2013�2020 (USD Million)
Table 27 Power Rental Market Size, By Generator Type, 2013�2020 (USD Million)
Table 28 Diesel Generator Market Size, By Region, 2013�2020 (USD Million)
Table 29 Gas Generator Market Size, By Region, 2013�2020 (USD Million)
Table 30 Other Generators Market Size, By Region, 2013�2020 (USD Million)
Table 31 Power Rental Market Size, By Application, 2013�2020 (USD Million)
Table 32 Peak Shaving Market Size, By Region, 2013�2020 (USD Million)
Table 33 Standby Power Market Size, By Region, 2013�2020 (USD Million)
Table 34 Base Load/Continuous Power Market Size, By Region, 2013�2020 (USD Million)
Table 35 Generator Power Rating Required By Different End-Use Industries
Table 36 Power Rental Market Size, By Generator kW Rating, 2013�2020 (USD Million)
Table 37 Up to 80 kW Rating Market Size, By Region, 2013�2020 (USD Million)
Table 38 81�280 kW Rating Market Size, By Region, 2013�2020 (USD Million)
Table 39 281�600 kW Rating Market Size, By Region, 2013�2020 (USD Million)
Table 40 More Than 600 kW Rating Market Size , By Region, 2013�2020 (USD Million)
Table 41 Power Rental Market Size, By Region, 2013�2020 (USD Million)
Table 42 North America: Power Rental Market Size, By Country, 2013�2020 (USD Million)
Table 43 North America: Power Rental Contracts & Agreements
Table 44 North America: Power Rental Expansions & Investments
Table 45 North America: Power Rental Mergers & Acquisitions
Table 46 North America: Power Rental Joint Venture/ Strategic Alliance/ Partnership
Table 47 Middle East: Power Rental Market Size, By End-Use Industry, 2013�2020 (USD Million)
Table 48 Middle East: Oil Reserves, 2009�2013 (Thousand Barrels Daily)
Table 49 Middle East: Power Rental Contracts & Agreements
Table 50 Middle East: Power Rental Expansions & Investments
Table 51 Middle East: Power Rental Joint Ventures/Strategic Alliances/ Partnerships
Table 52 Asia-Pacific: Power Rental Market Size, By Country, 2013�2020 (USD Million)
Table 53 Asia-Pacific: Power Rental Contracts & Agreements
Table 54 Asia-Pacific : Power Rental Expansions & Investments
Table 55 Asia-Pacific: Power Rental Mergers & Acquisitions
Table 56 Africa: Power Rental Market Size, By Country, 2013�2020 (USD Million)
Table 57 Africa: Power Rental Contracts & Agreements
Table 58 Africa: Power Rental Expansions & Investments
Table 59 Europe: Power Rental Market Size, By Country, 2013�2020 (USD Million)
Table 60 Europe: Power Rental Contracts & Agreements
Table 61 Europe: Power Rental Expansions & Investments
Table 62 Europe: Power Rental Mergers & Acquisitions
Table 63 South America: Power Rental Market Size, By Country, 2013�2020 (USD Million)
Table 64 South America: Power Rental Contracts & Agreements
Table 65 South America: Power Rental Investments & Expansions
Table 66 South America: Power Rental Mergers & Acquisitions
List of Figures (72 Figures)
Figure 1 Markets Covered
Figure 2 Research Design
Figure 3 Breakdown of Primary Interviews: By Company Type, Designation, & Region
Figure 4 Companies Adopted Various Growth Strategies From 2011 to 2015
Figure 5 Battle for Market Share: Contracts & Agreements Was the Key Strategy Adopted By the Top Players, 2011�2015
Figure 6 Market Evolution Framework: Contracts & Agreements Led to Market Growth, 2011�2015
Figure 7 Market Dynamics for Power Rental Market
Figure 8 Power Consumption in OECD & Non OECD Countries, 2010-2040
Figure 9 Volume Share of Contracts 2011-2015
Figure 10 Utilities: the Largest Market Share End-Use Industries
Figure 11 Diesel Generators Were the Most Preferred Power Rental Equipment From 2011 to 2015
Figure 12 Power Package Up to 50 mW Held the Highest Market Share (Volume) From 2011 to 2015
Figure 13 Power Rental Contracts, By End-Use Capacity (2011-2015)
Figure 14 Africa Held the Maximum Number of Contracts in the Power Rental Market
Figure 15 Regional Development Share of Contracts & Agreements From 2011 to 2015
Figure 16 Aggreko PLC. Held the Major Share of Contracts, By Volume
Figure 17 Company-Wise Contracts, By Region
Figure 18 Half-Yearly to Annual Contract Tenure: Most Preferred During 2011-2015
Figure 19 Brand Recognition: Dominant Strategy During 2011-2015
Figure 20 New Contracts Held the Maximum Development Share From 2011 to 2015
Figure 21 Less Renewals Than New Contracts During 2011 to 2015
Figure 22 Contract Extension vs Capacity Addition
Figure 23 Yearly Scenario of Contracts vs Renewals
Figure 24 Regional Scenario of Contracts vs Renewals
Figure 25 Volume Share of Expansions & Investments 2011-2015
Figure 26 North America Held the Maximum Number of Expansions & Investments From 2011 to 2015
Figure 27 Regional Development Share of Expansions & Investments From 2011 to 2015
Figure 28 Expansions & Investments Development Share, By Company, From 2011 to 2015
Figure 29 Investments & Expansions Development Share of Companies From 2011 to 2015
Figure 30 Expansions & Investments Development Share, By Purpose, From 2011 to 2015
Figure 31 Volume Share of Mergers & Acquisitions, 2011-2015
Figure 32 Mergers & Acquisitions Development Share, By Region, From 2011 to 2015
Figure 33 Hertz Equipment Rental (U.S.) Held the Major Share of Deals, By Volume
Figure 34 Mergers & Acquisitions Development Share, By Company (Quantity), From 2011 to 2015
Figure 35 Mergers & Acquisitions Development Share, By Purpose, From 2011 to 2015
Figure 36 Development Share of New Product Development Per Year
Figure 37 More New Product Launches Than Product Enhancements From 2011 to 2015
Figure 38 Diesel Generators Were the Most Preferred Equipment for Power Rental From 2011 to 2015
Figure 39 Products Less Than 50 kW Rating Held the Maximum Development Share From 2011 to 2015
Figure 40 Kohler Co. (U.S.) Held the Major Share of Product Developments, By Volume
Figure 41 Kohler Co. (U.S.) Held the Largest Share of New Product Launches From 2011 to 2015
Figure 42 Expansion of Existing Product Series is the Main Reason Behind Several New Product Launches
Figure 43 Power Rental Market Share (Value), By End-Use Industry, 2014
Figure 44 Power Rental Market Share (Value), By Generator Type, 2015
Figure 45 Power Rental Market Share (Value), By Application, 2015
Figure 46 Power Rental Market Share (Value), By kW Rating, 2015
Figure 47 Power Rental Market Share (Value), By Region, 2014
Figure 48 North America: Power Rental Market Snapshot, 2011�2015
Figure 49 Middle East: Power Rental Market Snapshot, 2011�2015
Figure 50 Asia-Pacific: Power Rental Market Snapshot, 2011�2015
Figure 51 Africa: Power Rental Market Snapshot, 2011�2015
Figure 52 Europe: Power Rental Market Snapshot, 2011�2015
Figure 53 South America: Power Rental Market Snapshot, 2011�2015
Figure 54 Region-Wise Revenue Mix of the Top Five Market Players
Figure 55 Aggreko PLC.: Company Snapshot
Figure 56 Aggreko PLC.: SWOT Analysis
Figure 57 APR Energy PLC: Company Snapshot
Figure 58 APR Energy PLC: SWOT Analysis
Figure 59 Ashtead Group PLC.: Company Snapshot
Figure 60 Ashtead Group PLC.: SWOT Analysis
Figure 61 Caterpillar Inc.: Company Snapshot
Figure 62 Caterpillar Inc.: SWOT Analysis
Figure 63 Cummins Inc.: Company Snapshot
Figure 64 Cummins Inc.: SWOT Analysis
Figure 65 Atlas Copco AB: Company Snapshot
Figure 66 Generac Power Systems: Company Snapshot
Figure 67 Hertz Corporation: Company Snapshot
Figure 68 Speedy Hire PLC: Company Snapshot
Figure 69 United Rentals Inc.: Company Snapshot
Figure 70 Wacker Neuson: Company Snapshot
Figure 71 Wajax Power Systems Ltd.: Company Snapshot
Figure 72 Wajax Power Systems Ltd.: an Overview of the Power Systems Segment


Growth opportunities and latent adjacency in Power Rental Global Contracts & Deals Analysis