Protective Fabrics Market by Raw Material (Aramid, PBI, Polyester, Cotton fiber, Polyolefin, Polyamide), by Type ( Fire & Heat-resistant fabric, Chemical resistant fabric, UV resistant fabric), by End-use Industry (Building & Construction, Oil & Gas, Firefighting, Healthcare, Law enforcement & military) - Global Trends & Forecasts to 2021


[153 Pages Report] The protective fabrics market size is estimated to have been USD 3.13 billion in 2015 and is projected to reach USD 4.0 billion by 2021, registering a CAGR of 4.2% between 2016 and 2021. In this study, 2014 has been considered as the historical year, 2015 as the base year, and 2016�2021 as the forecast period for estimating market size of protective fabrics. The global protective fabrics market has been segmented based on type, raw material, end-use industry, and region. Fire & heat-resistant fabric is expected to play a key role in fueling the growth of the overall protective fabrics market owing to its unique properties, which makes it suitable for use in a wide range of applications. The demand for protective fabrics in law enforcement & military and healthcare application is increasing rapidly, thereby, driving the protective fabrics market.
Market Dynamics
Drivers
- Stringent regulations pertaining to safety of the personnel in developed economies
- Requirement of security & protective measures
- Rising awareness about the safety of workers
Restraints
- High pricing of specialized fabrics
- Huge investments in R&D
Opportunities
- Rising demand from Asia-Pacific and Middle East & Africa
- Increasing demand for specialty fabrics
Stringent regulations pertaining to safety of the personnel in developed economies
Government authorities are increasingly concerned over the health and safety of workers at their work place. Many government regulations and standards compel the end-use industries to provide protective clothing to the workers working in hazardous environment. For instance, according to the 2010 memorandum of the U.S. Occupational Safety and Health Administration (OSHA), it is mandatory for the workers in the oil & gas industries to wear heat- and flame-resistant clothing. It also requires the workers at construction sites to wear high visibility safety apparels, as they are exposed to either traffic or moving machinery. The increased demand for protective clothing drives the market for advanced protective fabrics.
Objectives of the study:
- To analyze and forecast the market size of protective fabrics, in terms value
- To define, describe, and segment the global protective fabrics market by raw material, type and end-use industry
- To forecast the sizes of the market segments based on regions such as Asia-Pacific, North America, Europe, the Middle East & Africa, and Latin America
- To provide detailed information regarding the important factors influencing the growth of the market (drivers, restraints, and opportunities)
- To strategically analyze the segmented markets with respect to individual growth trends, prospects, and contribution to the overall market
- To identify and analyze opportunities for stakeholders in the market
- To analyze competitive developments such as expansion, collaboration, acquisition, agreement and new product developments in the global protective fabrics market
- To strategically profile key players and comprehensively analyze their core competencies
Research Methodology:
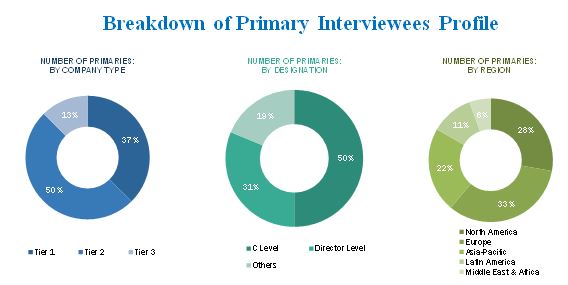
In this report, market sizes have been derived using both bottom-up and top-down approaches. First, the market size for each raw material type (aramid, PBI, polyamide, cotton fibers, polyolefin, polyester, and others); product type (fire & heat-resistance, chemical-resistance, UV-resistance fabrics, and others); end-use industry (building & construction, oil & gas, firefighting, healthcare, law enforcement & military, and others) and for various regions (Asia-Pacific, North America, Europe, Latin America, and the Middle East & Africa) is identified through both secondary and primary research. The overall protective fabrics market sizes for various regions and countries have been calculated by adding these individual markets. The protective fabrics market has been further segmented based on end-use industry, using percentage split gathered during the research. For future growth (CAGRs) trends of the protective fabrics, the end-use industries � building & construction, oil & gas, firefighting, healthcare, law enforcement & military, and others have been analyzed. Findings of this study were verified through primary research by conducting extensive interviews with key officials such as CEOs, VPs, directors, and other executives. The breakdown of profiles of the primary interviewees is illustrated in the below figure:
To know about the assumptions considered for the study, download the pdf brochure
The value chain of the protective fabrics market starts from raw material suppliers. The key components of protective fabrics depend on the type of raw material used such as aramid, PBI, polyamide, cotton fibers, polyolefin, polyesters, and others. The raw materials are synthesized to form a protective and comfort fabric, which is then processed by protective fabrics producers. Using fabric as raw material, protective fabric manufacturers cut and sew the fabric for end users.
The manufacturing process transforms the raw material into useful fabrics such as fire & heat-resistant fabric, chemical-resistant fabric, UV-resistant fabric, and others. In order to provide innovative fabrics, the fabrics used are chosen based on their properties such as high temperatures, resistance to abrasion, and non-conductive properties. After manufacturing, the process is taken for distribution and then retailing of the protective fabrics.
The end-use industries using protective equipment made of protective fabrics are building & construction, oil & gas, firefighting, healthcare, law enforcement & military, and others. Some of the major players involved in manufacturing protective fabrics include E. I. Du Pont de Nemours and Company (U.S.), 3M Company (U.S.), Koninklijke Ten Cate NV (Netherlands), and Teijin Limited (Japan) among others.
Major Market Developments
- In April 2016, 3M company has developed a 3M Scotchlite Reflective Material-series 5600 fire coat comfort trim, used to make turnout gears. This new design makes the turnout gears more comfortable for firefighters.
- In February 2016, Teijin Limited (Japan) developed two new fabrics of Twaron and Technora para-aramid fibers. These fabrics are used to protect facilities from airborne volcanic fragments up to 10 cm.
- In March 2016, 3M company expanded its USD 150 million R&D facility at Carlton, Australia. The facility was built to develop innovative products across 46 technology platforms to generate solutions for customers.
- In June 2015, Lorica International (U.S.) signed a distribution agreement with Fuji Electric Industries Co. Ltd. (Japan) for selling and distributing Lorica products in Japan, Southeast Asia, and China.
- In September 2015, Milliken & Company (U.S.) acquired Springfield LLC (U.S.), a producer of FR fabrics. This acquisition helped the company to improve their grade of protective apparels used by for military, first responders and industry workers.
Target Audiences
- Protective fabrics manufacturers
- Distributors
- Chemical suppliers
- Industry associations
- End-use industries
- Government and research organizations
�Thisstudy answers several questions for the stakeholders, primarily, which market segments to focus in the next two to five years for prioritizing efforts and investments�.
Scope of the Report
This report categorizes the global protective fabrics market based on type, application, and region.Market Segmentation, by Raw material:
The protective fabrics market has been segmented based on raw material:
- Aramid
- PBI
- Polyamide
- Cotton fibers
- Polyolefin
- Polyesters
- Others
Market Segmentation, by Type:
The protective fabrics market has been segmented based on type:
- Fire & heat-resistant fabric
- Chemical-resistant fabric
- UV resistant fabric
- Others
Market Segmentation, by End-use Industry
The protective fabrics market has been segmented based on End-use Industry:
- Building & construction
- Oil & gas
- Firefighting
- Healthcare
- Law enforcement & military
- Others
Market Segmentation,by Region
The region analysis covers the following:
- Asia-Pacific
- North America
- Europe
- Latin America
- Middle East & Africa
Critical questions which the report answers
- What are new product protective fabrics companies are exploring?
- Which are the key players in the market and how intense is the competition?
Available Customizations:
With the given market data, MarketsandMarkets offers customizations according to the company�s specific needs. The following customization options are available for the report:
Regional Analysis
- Further breakdown of a region with respect to a particular country, additional application, and/or type
Company Information
- Detailed analysis and profiling of additional market players (Up to 5)
The global protective fabrics market projected to reach USD 4.0 billion by 2021, registering a CAGR of 4.2% between 2016 and 2021. The market is driven by increased demand from end-use industries such as building & construction, oil & gas, firefighting, healthcare, law enforcement & military, and others. The increasing concern for the safety of military personnel is also a key factor supporting the growth of the protective fabrics market.
Protective fabrics are textile related products that offers the wearer protection from hostile elements, objects, or environments and prevents the risk of injuries. They are developed as per the requirement of a specific application. There are various protective fabrics based on their properties such as fire-resistance, chemical-resistance, antistatic, abrasion-resistance, and UV-resistance. They are used in the production of bulletproof vests, fireproof clothing, chemical protective clothing, and many other protective clothing & equipment. The end-use industries for protective fabrics include oil & gas, building & construction, military & law enforcements, mining, and firefighters.
On the basis of type, fire & heat-resistant fabrics is the fastest-growing type of protective fabrics. The rising demand from end-use industries is driving the market for fire & heat-resistant fabrics. The demand for fire & heat-resistant fabrics is expected to increase as these fibers are preferred for their ultra-high strength and high thermal- and fire- resistance. Due to their properties, they are highly preferred in security & protection applications. The increased demand for protective apparels such as helmets, jackets, fire resistant clothing, firefighting gears, and equipment are driving the fire & heat-resistant fabrics market.
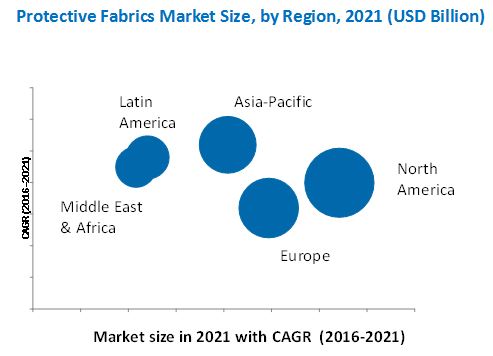
On the basis of region, North America is the largest protective fabrics market and is expected to witness moderate growth during the forecast period. Various safety regulations in the region mandate the use of protective clothing in various end-use industries. Asia-Pacific is the fastest-growing market for protective fabrics, in terms of value. Growing industrialization and infrastructure development in the region offer enormous opportunities for the growth of the protective fabrics market in the region. China is the largest market in the region. The growth in personal protection equipment and protective clothing industries is projected to increase the demand for protective fabrics in the region.
Building & construction, oil & gas, and firefighting applications to drive the growth of protective fabrics market
Building & Construction
The workers in the construction industry are often exposed to risks during welding, cutting, nailing, and others. Safety glasses are required to prevent the entry of foreign objects in the eye during work operations. Moreover, the protective clothing is required for the protection of foot, hand, head, and hearing. The clothing is made of fabrics that offer the advantage of lightweight, chemical resistance, and thermal resistance. The trend toward lightweight and durable clothing has led to the increased demand for nylon scrim, which is coated with polyvinyl chloride. These materials offer resistance to water and moisture. These waterproof materials resist the attack of chemicals, fungus, mold, and mildew.
Oil & Gas
Majority of the frontline authorities in the oil & gas industry are exposed to life-threatening chemical hazards. The danger arises from building well foundations and establishing tanks to hydraulically fracturing wells. Moreover, in offshore drilling there is an increased risk of blowouts, release of hydrogen sulfide, and formaldehyde that pose threat to the professionals working in such locations. Thus, in refineries, hazard assessment is carried out to procure personal protective equipment. The protective equipment made up of specialized fabrics is used to prevent the workers from various physical hazards.
The major hazards in the oil & gas industry include fire & explosion, hand & eye injuries, hearing loss, and others. Depending on which worker is exposed to which hazard, the selection of protective clothing is done. The regulations pertaining to the use of protective clothing are driving the market for personal protective equipment, which is turn drives the protective fabrics market. For instance, the personal protective equipment standards are defined in Occupational Safety and Health Administration (OSHA), which states that the employer is responsible for training and providing protective equipment to the workers.
Firefighting
The firefighters largely depend on the protective apparel to meet the requirements of their challenging job. Firefighting suits are designed to protect the firefighters against the chemical exposure and risk of being injured during extreme environment. The fabrics are largely used to produce clothing, as they are lightweight and comfortable. The protective clothing made of fibers is used to offer fire resistance, strength, durability, and other advantages. The fiber on exposure to heat thickens, thus increasing the protective barrier between the user and the source of heat. This in turn, helps in reducing injuries and provides greater time to escape during an emergency. The firefighters are not only exposed to chemicals but also to toxic industrial chemicals. Thus, different types of protective fabrics are used to develop clothing for different types of exposures. For instance, high volume fire suits are used during water-based emergencies and technical rescue suits are deployed in non-structural firefighting situation.
The specialty fabrics that are used to produce protective clothing include FR fabrics, chemical-resistant fabrics, and antistatic fabrics.
Critical questions the report answers:
- Where will all these developments take the industry in the mid to long term?
- What are the upcoming product type of Protective Fabrics?
Furthermore, since concrete construction now takes place in almost all weather conditions, the need for clothing that offer protection from extreme temperatures is required. The fabrics used to produce clothing for various applications are chosen according to their end-use requirements. The protective fabrics mostly used in building and constructions offer visibility and arc protection.
Higher pricing of specialized fabrics and the requirement of huge investments for R&D acts as a restraint for the protective fabrics market.
The competitiveness of the protective fabrics market is continuously increasing with innovative and new product launches. Strategic developments are mostly undertaken by major players such as Teijin Limited (Japan), Koninklijke Ten Cate NV (Netherlands), W. L. Gore & Associates, Inc. (U.S.), E. I. du Pont de Nemours and Company (U.S.), and 3M Company (U.S).
To speak to our analyst for a discussion on the above findings, click Speak to Analyst
 Exclusive indicates content/data unique to MarketsandMarkets and not available with any competitors.
Table of Contents
1 Introduction (Page No. - 14)
1.1 Objectives of the Study
1.2 Market Definition
1.3 Scope of the Study
1.3.1 Markets Covered
1.3.2 Years Considered for the Study
1.4 Currency
1.5 Limitations
1.6 Stakeholders
2 Research Methodology (Page No. - 17)
2.1 Research Data
2.1.1 Secondary Data
2.1.1.1 Key Data From Secondary Sources
2.1.2 Primary Data
2.1.2.1 Key Data From Primary Sources
2.1.2.2 Key Industry Insights
2.1.2.3 Breakdown of Primary Interviews
2.2 Market Size Estimation
2.2.1 Bottom-Up Approach
2.2.2 Top-Down Approach
2.3 Data Triangulation
2.4 Research Assumptions
2.4.1 Assumptions
3 Executive Summary (Page No. - 25)
4 Premium Insights (Page No. - 30)
4.1 Significant Opportunities for Protective Fabrics
4.2 Protective Fabrics Market Growth, By Region (2016�2021)
4.3 Protective Fabrics Market in Asia-Pacific
4.4 Protective Fabrics Market Attractiveness
4.5 Protective Fabrics Market, By End-Use Industry
4.6 Lifecycle Analysis, By Region
5 Market Overview (Page No. - 34)
5.1 Introduction
5.2 Market Segmentation
5.2.1 By Raw Material
5.2.2 By Type
5.2.3 By End-Use Industry
5.2.4 By Region
5.3 Market Dynamics
5.3.1 Drivers
5.3.1.1 Stringent Regulations Pertaining to Safety of the Personnel in Developed Economies
5.3.1.2 Requirement for Security & Protective Measures
5.3.1.3 Rising Awareness About the Safety of Workers
5.3.2 Restraints
5.3.2.1 High Pricing of Specialized Fabrics
5.3.2.2 Huge Investments in R&D
5.3.3 Opportunities
5.3.3.1 Rising Demand From Asia-Pacific and Middle East & Africa
5.3.3.2 Increasing Demand for Specialty Fabrics
5.4 Revenue Pocket Matrix
6 Industry Trends (Page No. - 40)
6.1 Value Chain Analysis
6.2 Porter�s Five Forces Analysis
6.2.1 Threat of New Entrants
6.2.2 Threat of Substitutes
6.2.3 Bargaining Power of Suppliers
6.2.4 Bargaining Power of Buyers
6.2.5 Intensity of Competitive Rivalry
6.3 Industry Outlook
6.3.1 Healthcare
6.3.2 Construction
7 Protective Fabrics Market, By Raw Material (Page No. - 46)
7.1 Introduction
7.2 Market Size and Projection
7.2.1 Aramid
7.2.2 Polyamide
7.2.3 Polyolefin
7.2.4 PBI
7.2.5 Cotton Fibers
7.2.6 Polyesters
7.2.7 Others
8 Protective Fabrics Market, By Type (Page No. - 58)
8.1 Introduction
8.2 Market Size and Projection
8.2.1 Fire- & Heat-Resistant Fabrics
8.2.2 Chemical-Resistant Fabrics
8.2.3 UV-Resistant Fabrics
8.2.4 Others
9 Protective Fabrics Market, By End-Use Industry (Page No. - 67)
9.1 Introduction
9.2 Building & Construction
9.2.1 Visibility
9.2.2 ARC Protection
9.3 Oil & Gas
9.4 Firefighting
9.5 Healthcare
9.5.1 Cleaning Room Protection
9.5.2 Bio-Hazard Protection
9.6 Law Enforcement & Military
9.6.1 Tactical Vest
9.6.2 Helmets
9.6.3 Body Armor
9.6.4 Head Gear
9.6.5 Vehicles
9.7 Others
9.7.1 Thermal Resistance
9.7.2 Cut & Abrasion Resistance
9.7.3 Protection From Non-Hazardous Exposure
9.7.4 General Industrial Purpose
10 Protective Fabrics Market, By Region (Page No. - 77)
10.1 Introduction
10.2 North America
10.2.1 U.S.
10.2.2 Canada
10.2.3 Mexico
10.3 Europe
10.3.1 Germany
10.3.2 France
10.3.3 Italy
10.3.4 U.K.
10.3.5 Spain
10.3.6 Russia
10.3.7 Rest of Europe
10.4 Asia-Pacific
10.4.1 China
10.4.2 India
10.4.3 Japan
10.4.4 South Korea
10.4.5 Indonesia
10.4.6 Australia & New Zealand
10.4.7 Rest of Asia-Pacific
10.5 Latin America
10.5.1 Brazil
10.5.2 Argentina
10.5.3 Rest of Latin America
10.6 Middle East and Africa
10.6.1 Saudi Arabia
10.6.2 Iran
10.6.3 South Africa
10.6.4 Rest of Middle East & Africa
11 Competitive Landscape (Page No. - 115)
11.1 Overview
11.2 Competitive Benchmarking
11.3 Market Share Analysis
11.4 Competitive Situations and Trends
11.4.1 New Product Launches
11.4.2 Expansions
11.4.3 Agreements
11.4.4 Partnerships
11.4.5 Acquisitions
11.4.6 Collaborations
12 Company Profiles (Page No. - 122)
(Company at A Glance, Recent Financials, Products & Services, Strategies & Insights, & Recent Developments)*
12.1 3M Company
12.2 Koninklijke Ten Cate NV
12.3 Teijin Limited
12.4 E. I. Du Pont De Nemours and Company
12.5 Lakeland Industries, Inc.
12.6 Cetriko, SL
12.7 Glen Raven, Inc.
12.8 Klopman International
12.9 Kolon Industries, Inc.
12.10 Lorica International
12.11 Milliken & Company
12.12 W. L. Gore & Associates, Inc.
12.13 Other Players
*Details on Company at A Glance, Recent Financials, Products & Services, Strategies & Insights, & Recent Developments Might Not Be Captured in Case of Unlisted Companies.
13 Appendix (Page No. - 146)
13.1 Insights From Industry Experts
13.2 Discussion Guide
13.3 Knowledge Store: Marketsandmarkets� Subscription Portal
13.4 Introducing RT: Real-Time Market Intelligence
13.5 Available Customizations
13.6 Related Reports
List of Tables (76 Tables)
Table 1 Total Healthcare Expenditure (% of Gdp), By Country, 2010�2014
Table 2 Protective Fabrics Market Size, By Raw Material, 2014�2021 (USD Million)
Table 3 Aramid Market Size, By Region, 2014�2021 (USD Million)
Table 4 Polyamide Market Size, By Region, 2014�2021 (USD Million)
Table 5 Polyolefin Market Size, By Region, 2014�2021 (USD Million)
Table 6 PBI Market Size, By Region, 2014�2021 (USD Million)
Table 7 Cotton Fibers Market Size, By Region, 2014�2021 (USD Million)
Table 8 Polyesters Market Size, By Region, 2014�2021 (USD Million)
Table 9 Others Market Size, By Region, 2014�2021 (USD Million)
Table 10 Protective Fabrics Market Size, By Type, 2014�2021 (USD Million)
Table 11 Major Brands of Fire- & Heat-Resistant Fabrics in the Market
Table 12 Fire- & Heat-Resistant Fabrics Market Size, By Region, 2014�2021 (USD Million)
Table 13 Major Brands of Chemical-Resistant Fabrics in the Market
Table 14 Chemical-Resistant Fabrics Market Size, By Region, 2014�2021 (USD Million)
Table 15 UV-Resistant Fabrics Market Size, By Region, 2014�2021 (USD Million)
Table 16 Others Market Size, By Region, 2014�2021 (USD Million)
Table 17 Protective Fabrics: Breakdown of End-Use Industry
Table 18 Protective Fabrics Market Size, By End-Use Industry, 2014�2021 (USD Million)
Table 19 Protective Fabrics Market Size in Building & Construction, By Region, 2014�2021 (USD Million)
Table 20 Protective Fabrics Market Size in Oil & Gas, By Region, 2014�2021 (USD Million)
Table 21 Protective Fabrics Market Size in Firefighting, By Region, 2014�2021 (USD Million)
Table 22 Protective Fabrics Market Size in Healthcare, By Region, 2014�2021 (USD Million)
Table 23 Protective Fabrics Market Size in Law Enforcement & Military, By Region, 2014�2021 (USD Million)
Table 24 Protective Fabrics Market Size in Other End-Use Industries, By Region, 2014�2021 (USD Million)
Table 25 Protective Fabrics Market Size, By Region, 2014�2021 (USD Million)
Table 26 North America: Protective Fabrics Market Size, By Country, 2014�2021 (USD Million)
Table 27 North America: Protective Fabrics Market Size, By Raw Material, 2014�2021 (USD Million)
Table 28 North America: Protective Fabrics Market Size, By Type, 2014�2021 (USD Million)
Table 29 North America: Protective Fabrics Market Size, By End-Use Industry, 2014�2021 (USD Million)
Table 30 U.S.: Protective Fabrics Market Size, By End-Use Industry, 2014�2021 (USD Million)
Table 31 Canada: Protective Fabrics Market Size, By End-Use Industry, 2014�2021 (USD Million)
Table 32 Mexico: Protective Fabrics Market Size, By End-Use Industry, 2014�2021 (USD Million)
Table 33 Europe: Protective Fabrics Market Size, By Country, 2014�2021 (USD Million)
Table 34 Europe: Protective Fabrics Market Size, By Raw Material, 2014�2021 (USD Million)
Table 35 Europe: Protective Fabrics Market Size, By Type, 2014�2021 (USD Million)
Table 36 Europe: Protective Fabrics Market Size, By End-Use Industry, 2014�2021 (USD Million)
Table 37 Germany: Protective Fabrics Market Size, By End-Use Industry, 2014�2021 (USD Million)
Table 38 France: Protective Fabrics Market Size, By End-Use Industry, 2014�2021 (USD Million)
Table 39 Italy: Protective Fabrics Market Size, By End-Use Industry, 2014�2021 (USD Million)
Table 40 U.K.: Protective Fabrics Market Size, By End-Use Industry, 2014�2021 (USD Million)
Table 41 Spain: Protective Fabrics Market Size, By End-Use Industry, 2014�2021 (USD Million)
Table 42 Russia: Protective Fabrics Market Size, By End-Use Industry, 2014�2021 (USD Million)
Table 43 Rest of Europe: Protective Fabrics Market Size, By End-Use Industry, 2014�2021 (USD Million)
Table 44 Asia-Pacific: Protective Fabrics Market Size, By Country, 2014�2021 (USD Million)
Table 45 Asia-Pacific: Protective Fabrics Market Size, By Raw Material, 2014�2021 (USD Million)
Table 46 Asia-Pacific: Protective Fabrics Market Size, By Type, 2014�2021 (USD Million)
Table 47 Asia-Pacific: Protective Fabrics Market Size, By End-Use Industry, 2014�2021 (USD Million)
Table 48 China: Protective Fabrics Market Size, By End-Use Industry, 2014�2021 (USD Million)
Table 49 India: Protective Fabrics Market Size, By End-Use Industry, 2014�2021 (USD Million)
Table 50 Japan: Protective Fabrics Market Size, By End-Use Industry, 2014�2021 (USD Million)
Table 51 South Korea: Protective Fabrics Market Size, By End-Use Industry, 2014�2021 (USD Million)
Table 52 Indonesia: Protective Fabrics Market Size, By End-Use Industry, 2014�2021 (USD Million)
Table 53 Australia & New Zealand: Protective Fabrics Market Size, By End-Use Industry, 2014�2021 (USD Million)
Table 54 Rest of Asia-Pacific: Protective Fabrics Market Size, By End-Use Industry, 2014�2021 (USD Million)
Table 55 Latin America: Protective Fabrics Market Size, By Country, 2014�2021 (USD Million)
Table 56 Latin America: Protective Fabrics Market Size, By Raw Material, 2014�2021 (USD Million)
Table 57 Latin America: Protective Fabrics Market Size, By Type, 2014�2021 (USD Million)
Table 58 Latin America: Protective Fabrics Market Size, By End-Use Industry, 2014�2021 (USD Million)
Table 59 Brazil: Protective Fabrics Market Size, By End-Use Industry, 2014�2021 (USD Million)
Table 60 Argentina: Protective Fabrics Market Size, By End-Use Industry, 2014�2021 (USD Million)
Table 61 Rest of Latin America: Protective Fabrics Market Size, By End-Use Industry, 2014�2021 (USD Million)
Table 62 Middle East & Africa: Protective Fabrics Market Size, By Country, 2014�2021 (USD Million)
Table 63 Middle East & Africa: Protective Fabrics Market Size, By Raw Material, 2014�2021 (USD Million)
Table 64 Middle East & Africa: Protective Fabrics Market Size, By Type, 2014�2021 (USD Million)
Table 65 Middle East & Africa: Protective Fabrics Market Size, By End-Use Industry, 2014�2021 (USD Million)
Table 66 Saudi Arabia: Protective Fabrics Market Size, By End-Use Industry, 2014�2021 (USD Million)
Table 67 Iran: Protective Fabrics Market Size, By End-Use Industry, 2014�2021 (USD Million)
Table 68 South Africa: Protective Fabrics Market Size, By End-Use Industry, 2014�2021 (USD Million)
Table 69 Rest of Mea: Protective Fabrics Market Size, By End-Use Industry, 2014�2021 (USD Million)
Table 70 Competitive Benchmarking of Players
Table 71 New Product Launches, 2012�2016
Table 72 Expansions, 2012�2016
Table 73 Agreements, 2012�2016
Table 74 Partnerships, 2012�2016
Table 75 Acquisitions, 20122016
Table 76 Collaborations, 20122016
List of Figures (51 Figures)
Figure 1 Protective Fabrics Market: Research Design
Figure 2 Market Size Estimation: Bottom-Up Approach
Figure 3 Market Size Estimation: Top-Down Approach
Figure 4 Protective Fabrics Market: Data Triangulation
Figure 5 Fire & Heat-Resistant Fabrics to Dominate the Protective Fabrics Market, 2016�2021
Figure 6 PBI to Register the Highest CAGR Between 2016 and 2021
Figure 7 Healthcare to Register the Highest CAGR Between 2016 and 2021
Figure 8 Asia-Pacific to Witness the Fastest Growth Rate During the Forecast Period
Figure 9 North America is Estimated to Be the Largest Market Between 2016 and 2021
Figure 10 Protective Fabrics Market to Witness Rapid Growth Between 2016 and 2021
Figure 11 Asia-Pacific to Witness the Highest Growth Rate Between 2016 and 2021
Figure 12 China Accounted for the Largest Share of the Market in Asia-Pacific, 2015
Figure 13 Asia-Pacific to Be the Fastest-Growing Protective Fabrics Market Between 2016 and 2021
Figure 14 Building & Construction Accounted for the Largest Market Share, 2015
Figure 15 Asia-Pacific Protective Fabrics Market is Projected to Register High Growth During the Forecast Period
Figure 16 Protective Fabrics Market, By Region
Figure 17 Overview of the Factors Governing the Protective Fabrics Market
Figure 18 Revenue Pocket Matrix, By Type
Figure 19 Value Chain Analysis for Protective Fabrics
Figure 20 Porter�s Five Forces Analysis
Figure 21 Growth Rate of Construction Industry, 2014
Figure 22 PBI to Witness Rapid Growth During the Forecast Period
Figure 23 Asia-Pacific to Register the Highest CAGR for Aramid During the Forecast Period
Figure 24 Polyamide to Witness Highest Growth Rate in Asia-Pacific Between 2016 and 2021
Figure 25 North America is Estimated to Be the Largest Market for Polyolefin During the Forecast Period
Figure 26 Asia-Pacific to Be the Fastest-Growing Market for PBI Between 2016 and 2021
Figure 27 Cotton Fibers to Witness the Highest CAGR in Asia-Pacific
Figure 28 Asia-Pacific to Be the Fastest-Growing Market for Polyesters During the Forecast Period
Figure 29 Asia-Pacific to Be the Fastest-Growing Market in Other Raw Material Segment
Figure 30 Fire- & Heat-Resistant Fabrics to Witness Rapid Growth
Figure 31 Fire- & Heat-Resistant Fabrics to Dominate the Protective Fabrics Market Between 2016 and 2021
Figure 32 Chemical-Resistant Fabrics Market in Asia-Pacific to Register the Highest Growth Rate Between 2016 and 2021
Figure 33 Asia-Pacific to Register the Highest Growth Rate for UV-Resistant Fabrics Between 2016 and 2021
Figure 34 Asia-Pacific to Register the Highest Growth Rate for Other Fabrics Between 2016 and 2021
Figure 35 Healthcare Industry to Witness the Highest Growth During the Forecast Period
Figure 36 Healthcare is Estimated to Register Highest Growth Rate Between 2016 and 2021
Figure 37 Regional Snapshot (2016�2021): China, India, and Indonesia are Emerging as New Hotspots
Figure 38 India to Be the Fastest-Growing Market for Protective Fabrics
Figure 39 North American Market Snapshot: U.S. to Continue Dominating the Protective Fabrics Market
Figure 40 European Market Snapshot: Germany to Register High Growth
Figure 41 Asia-Pacific Market Snapshot: Fire- & Heat-Resistant Fabrics to Dominate the Market
Figure 42 Latin America Market Snapshot: Argentina to Register High Growth
Figure 43 Middle East & Africa Market Snapshot: South Africa to Register High Growth
Figure 44 Companies Adopted New Product Launches as the Key Growth Strategy Between 2012 and 2016
Figure 45 Protective Fabrics Market Share, By Company, 2015
Figure 46 3M Company: Company Snapshot
Figure 47 Koninklijke Ten Cate N.V.: Company Snapshot
Figure 48 Teijin Limited: Company Snapshot
Figure 49 E. I. Du Pont De Nemours and Company: Company Snapshot
Figure 50 Lakeland Industries, Inc.: Company Snapshot
Figure 51 Kolon Industries, Inc.: Company Snapshot


Growth opportunities and latent adjacency in Protective Fabrics Market