Protein Engineering Market by Technology (Rational Design, Irrational Design), Product & Service (Instrument, Consumables), Protein Type (Monoclonal Antibodies, Insulin), End User (Academics Institutes, Biopharmaceuticals, CROs) & Region - Global Forecast to 2024


Market Growth Outlook Summary
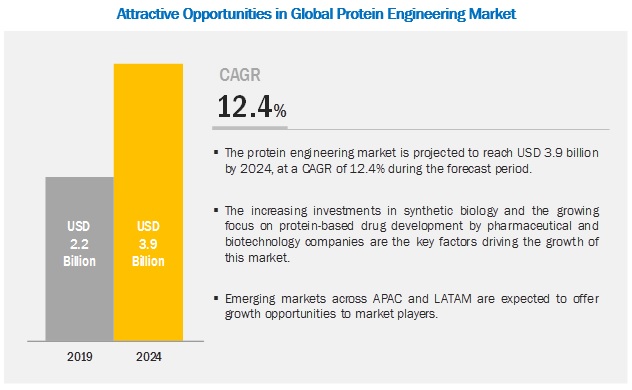
The global protein engineering market growth forecasted to transform from $2.2 billion in 2019 to $3.9 billion by 2024, driven by a CAGR of 12.4%. The growth of this market is majorly driven by factors such as the increasing investments in synthetic biology and the growing focus on protein-based drug development by pharmaceutical and biotechnology companies. However, factors such as the high cost of instruments and laboratory documentation systems are expected to restrain the growth of this market during the forecast period.
Instruments segment to account for the largest share of the industry, by product & service, in 2019
Based on product & service, the protein engineering market is segmented into instruments, consumables, and software & services. Instruments formed the largest product segment in this market owing to technological advancements and the high price of mass spectroscopy and crystallography instruments (as compared to consumables).
Monoclonal antibodies segment accounted for the largest share of the protein engineering industry, by protein type, in 2019
Based on protein type, the protein engineering market is segmented into monoclonal antibodies, insulin, erythropoietin, interferons, vaccines, colony-stimulating factors, growth hormones, coagulation factors, and other proteins. Monoclonal antibodies accounted for the largest share of the market in 2019. The large share of this segment can be attributed to the increasing demand for monoclonal antibodies for the treatment of cancer, neurological diseases, and infectious diseases.
Rational protein design is the largest technology segment in the protein engineering industry
Based on technology, the neering protein engineering market is segmented into rational and irrational protein design. The rational protein design segment accounted for the largest share of the market in 2019. The large share of this segment can be attributed to the increasing use and continuous upgrades of bioinformatics platforms and software for protein analysis.
Biopharmaceutical companies were the largest end users of protein engineering products and services in 2019
Based on end user, the market is segmented into biopharmaceutical companies, contract research organizations, and academic research institutes. The biopharmaceutical companies segment accounted for the largest share of the market in 2019. This is because protein engineering products are widely used for drug discovery and development by biopharmaceutical companies, as they help in designing models to develop a broad range of protein-based drugs.
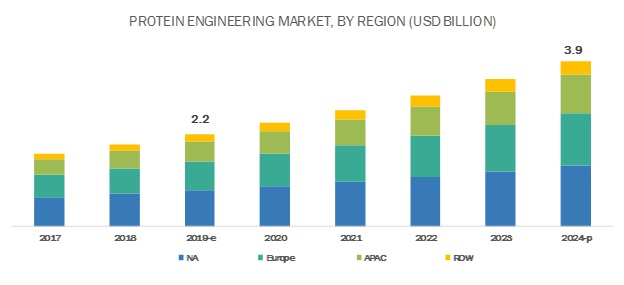
North America accounted for the largest share of the global protein engineering industry in 2019
The global protein engineering market is segmented into four major regions, namely, North America, Europe, the Asia Pacific, and the Rest of the World. In 2019, North America accounted for the largest share of the global market, closely followed by Europe. Factors such as the presence of well-established CROs, rising R&D expenditure, and the availability of the latest techniques and instruments for drug discovery research are responsible for the large share of the North American market. However, the Asia Pacific market is estimated to grow at the highest CAGR during the forecast period. This can majorly be attributed to the advancements in genomics and proteomics research and government initiatives and funding for protein-based drug research in several Asia Pacific countries.
The major companies operating in the protein engineering market include Thermo Fisher Scientific (US), Danaher Corporation (US), Agilent Technologies (US), and Bio-Rad Laboratories (US).
Thermo Fisher Scientific (US) held the leading position in this market primarily due to its strong portfolio of protein engineering consumables, instruments, and services. In addition, the company has strengthened its market position through the expansion of its product portfolio by launching new products every year.
Scope of the Protein Engineering Industry:
|
Report Metric |
Details |
|
Market Revenue Size in 2019 |
$2.2 billion |
|
Projected Revenue Size by 2024 |
$3.9 billion |
|
Industry Growth Rate |
Poised to grow at a CAGR of 12.4% |
|
Market Driver |
Increasing investment in synthetic biology |
|
Market Opportunity |
Emerging markets |
The study categorizes the Protein Engineering Market to forecast revenue and analyze trends in each of the following submarkets:
By Product & Service
- Instruments
- Consumables
- Software & Services
By Protein Type
- Monoclonal Antibodies
- Erythropoietin
- Interferons
- Vaccines
- Colony-stimulating Factors
- Growth Hormones
- Coagulation Factors
- Other Proteins (interleukins, transforming growth factors, epidermal growth factors, tumor necrosis factors, and stem cell factors)
By Technology
- Rational Protein Design
- Irrational Protein Design
By End User
- Biopharmaceutical Companies
- Contract Research Organizations
- Academic Research Institutes
By Region
-
North America
- US
- Canada
-
Europe
- Germany
- UK
- France
- RoE
-
Asia Pacific
- Japan
- China
- India
- RoAPAC
- RoW
Recent Developments of Protein Engineering Industry:
- In 2019, Creative Biolabs (US) launched the cd25 monoclonal antibody.
- In 2019, Waters Corporation (US) launched Vanguard FIT Cartridge Technology.
- In 2019, Agilent Technologies (US) acquired BioTek Instruments (US), which helped the company to expand its expertise in cell analysis and establish its position in the immuno-oncology and immunotherapy markets.
- In 2019, Merck KGaA signed a license agreement with Amunix Pharmaceuticals, Inc. (US). Under this agreement, Amunix will gain the rights to develop therapeutics using the protease-triggered immune activator (ProTIA) technology platform.
Frequently Asked Questions (FAQ):
What is the projected market revenue value of the global protein engineering market?
The global protein engineering market boasts a total revenue value of $3.9 billion by 2024.
What is the estimated growth rate (CAGR) of the global protein engineering market?
The global protein engineering market has an estimated compound annual growth rate (CAGR) of 12.4% and a revenue size in the region of $2.2 billion in 2019.
To speak to our analyst for a discussion on the above findings, click Speak to Analyst
 Exclusive indicates content/data unique to MarketsandMarkets and not available with any competitors.
Table of Contents
1 Introduction (Page No. - 17)
1.1 Objectives of the Study
1.2 Market Definition
1.3 Markets Covered
1.4 Years Considered for the Study
1.5 Currency
1.6 Limitations
1.7 Stakeholders
2 Research Methodology (Page No. - 20)
2.1 Research Data
2.1.1 Secondary Data
2.1.1.1 Key Data From Secondary Sources
2.1.2 Primary Data
2.1.2.1 Key Data From Primary Sources
2.2 Market Size Estimation
2.3 Data Triangulation
2.3.1 Assumptions for the Study
2.3.2 Limitations
3 Executive Summary (Page No. - 28)
4 Premium Insights (Page No. - 31)
4.1 Protein Engineering Industry Overview
4.2 Asia Pacific: Protein Engineering Industry, By Product (2018)
4.3 Protein Engineering Industry, By End User (2018)
4.4 Protein Engineering Industry, By Region (2018)
5 Market Overview (Page No. - 34)
5.1 Introduction
5.2 Market Dynamics
5.2.1 Drivers
5.2.1.1 Increasing Investments in Synthetic Biology
5.2.1.2 Growing Focus on Protein-Based Drug Development By Pharmaceutical & Biotechnology Firms
5.2.2 Restraints
5.2.2.1 High Cost of Instruments
5.2.3 Opportunities
5.2.3.1 Emerging Markets
6 Protein Engineering Market, By Product & Service (Page No. - 37)
6.1 Introduction
6.2 Instruments
6.2.1 Instruments Will Continue to Dominate the Market in the Forecast Period
6.3 Consumables
6.3.1 Increasing Demand for Consumables in Proteomics Research is Supporting Market Growth
6.4 Software & Services
6.4.1 Software & Services Segment to Witness the Highest Growth Between 2019 and 2024
7 Protein Engineering Market, By Protein Type (Page No. - 43)
7.1 Introduction
7.2 Monoclonal Antibodies
7.2.1 Accurate Binding Capacity and Specificity Have Supported the use of MABs
7.3 Insulin
7.3.1 Increasing Burden of Diabetes has Driven the Demand for Insulin
7.4 Erythropoietins
7.4.1 Continuous Research and Funding to Promote the Growth of Erythropoietins
7.5 Interferons
7.5.1 Rising Anemia Incidence is a Key Driver of the Market for Interferons
7.6 Vaccines
7.6.1 High Incidence of Diseases Such as Hepatitis and Influenza Likely to Boost Market Growth
7.7 Colony-Stimulating Factors
7.7.1 Demand for CSF in Bone and Inflammation Treatment Likely to Boost the Market
7.8 Growth Hormones
7.8.1 Demand for Hormone Therapies Likely to Boost the Market
7.9 Coagulation Factors
7.9.1 The Need to Combat Hemophilia is Expected to be the Primary Growth Driver for This Market Segment
7.10 Other Proteins
8 Protein Engineering Market, By Technology (Page No. - 58)
8.1 Introduction
8.2 Rational Protein Design
8.2.1 Advancements in Bioinformatics Tools to Propel Market Growth
8.3 Irrational Protein Design/Directed Evolution
8.3.1 This Process Involves a Number of Uncertainties, Which May Limit Market Growth to a Certain Extent
9 Protein Engineering Market, By End User (Page No. - 63)
9.1 Introduction
9.2 Biopharmaceutical Companies
9.2.1 Biopharmaceutical Companies Dominate the Market
9.3 Contract Research Organizations
9.3.1 Increasing Need for Outsourcing Protein Engineering Activities to Cros to Support Market Growth
9.4 Academic Research Institutes
9.4.1 Need for Novel Proteins for the Production of Biotherapeutics to Boost Market Growth
10 Protein Engineering Market, By Region (Page No. - 70)
10.1 Introduction
10.2 North America
10.2.1 US
10.2.1.1 Patent Expiry and Increasing Research Funds
10.2.2 Canada
10.2.2.1 R&D Activities in Research Institutes and Universities to Drive Market Growth
10.3 Europe
10.3.1 Germany
10.3.1.1 Strong R&D Base and Presence of Research Centers to Drive Market Growth
10.3.2 UK
10.3.2.1 Strong Preclinical Pipeline to Support Market Growth
10.3.3 France
10.3.3.1 Conference and Events in France Likely to Create Awareness
10.3.4 Rest of Europe
10.4 Asia Pacific
10.4.1 Japan
10.4.1.1 Government Initiatives in Genomics and Proteomics are Likely to Support Market Growth in Japan
10.4.2 China
10.4.2.1 Presence of a Favorable Funding Scenario and Collaborations Will Drive Market Growth
10.4.3 India
10.4.3.1 Government Initiatives Will Propel Market Growth in India
10.4.4 Rest of Asia Pacific
10.5 Rest of the World
11 Competitive Landscape (Page No. - 97)
11.1 Introduction
11.2 Market Rank Analysis, 2018
11.3 Competitive Leadership Mapping (2019)
11.3.1 Vendor Inclusion Criteria
11.3.2 Visionary Leaders
11.3.3 Innovators
11.3.4 Dynamic Differentiators
11.3.5 Emerging Companies
11.4 Competitive Scenario
11.4.1 Partnerships, Agreements, and Collaborations (2016–2019)
11.4.2 Product Launches & Enhancements (2016–2019)
11.4.3 Expansions (2016–2019)
11.4.4 Acquisitions (2016–2019)
12 Company Profiles (Page No. - 103)
(Business Overview, Products Offered, Recent Developments, MnM View)*
12.1 Thermo Fisher Scientific, Inc.
12.2 Danaher Corporation
12.3 Agilent Technologies, Inc.
12.4 Bio-Rad Laboratories, Inc.
12.5 Bruker Corporation
12.6 Genscript Biotech Corporation
12.7 Codexis, Inc.
12.8 Waters Corporation
12.9 New England Biolabs, Inc.
12.10 Merck KGaA
12.11 Perkinelmer, Inc.
12.12 GE Healthcare
12.13 Creative Biolabs
12.14 Enantis S.R.O.
12.15 Promega Corporation
12.16 Abzena, Ltd.
12.17 Proteogenix
12.18 Innovagen AB
12.19 Phynexus, Inc. (A Part of Biotage)
12.20 Takara Bio, Inc.
*Business Overview, Products Offered, Recent Developments, MnM View Might Not be Captured in Case of Unlisted Companies.
13 Appendix (Page No. - 140)
13.1 Discussion Guide
13.2 Knowledge Store: Marketsandmarkets’ Subscription Portal
13.3 Available Customizations
13.4 Related Reports
13.5 Author Details
List of Tables (132 Tables)
Table 1 Protein Engineering Market, By Product & Service, 2017–2024 (USD Million)
Table 2 Protein Engineering Instruments Market, By Region, 2017–2024 (USD Million)
Table 3 North America: Protein Engineering Instruments Market, By Country, 2017–2024 (USD Million)
Table 4 Europe: Protein Engineering Instruments Market, By Country, 2017–2024 (USD Million)
Table 5 APAC: Protein Engineering Instruments Market, By Country, 2017–2024 (USD Million)
Table 6 Protein Engineering Consumables Market, By Region, 2017–2024 (USD Million)
Table 7 North America: Protein Engineering Consumables Market, By Country, 2017–2024 (USD Million)
Table 8 Europe: Protein Engineering Consumables Market, By Country, 2017–2024 (USD Million)
Table 9 APAC: Protein Engineering Consumables Market, By Country, 2017–2024 (USD Million)
Table 10 Protein Engineering Software & Services Market, By Region, 2017–2024 (USD Million)
Table 11 North America: Protein Engineering Software & Services Market, By Country, 2017–2024 (USD Million)
Table 12 Europe: Protein Engineering Software & Services Market, By Country, 2017–2024 (USD Million)
Table 13 APAC: Protein Engineering Software & Services Market, By Country, 2017–2024 (USD Million)
Table 14 Global Protein Engineering Industry, By Protein Type, 2017–2024 (USD Million)
Table 15 Protein Engineering Industry for Monoclonal Antibodies, By Region, 2017–2024 (USD Million)
Table 16 North America: Market for Monoclonal Antibodies, By Country, 2017–2024 (USD Million)
Table 17 Europe: Market for Monoclonal Antibodies, By Country, 2017–2024 (USD Million)
Table 18 APAC: Market for Monoclonal Antibodies, By Country, 2017–2024 (USD Million)
Table 19 Protein Engineering Industry for Insulin, By Region, 2017–2024 (USD Million)
Table 20 North America: gineering Market for Insulin, By Country, 2017–2024 (USD Million)
Table 21 Europe: Market for Insulin, By Country, 2017–2024 (USD Million)
Table 22 APAC: Market for Insulin, By Country, 2017–2024 (USD Million)
Table 23 Market for ErythropOIEtins, By Region, 2017–2024 (USD Million)
Table 24 North America: Market for ErythropOIEtins, By Country, 2017–2024 (USD Million)
Table 25 Europe: Protein Engineering Market for ErythropOIEtins, By Country, 2017–2024 (USD Million)
Table 26 APAC: Market for ErythropOIEtins, By Country, 2017–2024 (USD Million)
Table 27 Protein Engineering Industry for Interferons, By Region, 2017–2024 (USD Million)
Table 28 North America: Market for Interferons, By Country, 2017–2024 (USD Million)
Table 29 Europe: Market for Interferons, By Country, 2017–2024 (USD Million)
Table 30 APAC: Market for Interferons, By Country, 2017–2024 (USD Million)
Table 31 Protein Engineering Industry for Vaccines, By Region, 2017–2024 (USD Million)
Table 32 North America: Market for Vaccines, By Country, 2017–2024 (USD Million)
Table 33 Europe: Protein Engineering Industry for Vaccines By Country, 2017–2024 (USD Million)
Table 34 APAC: Market for Vaccines, By Country, 2017–2024 (USD Million)
Table 35 Protein Engineering Industry for Colony-Stimulating Factors, By Region, 2017–2024 (USD Million)
Table 36 North America: Market for Colony-Stimulating Factors, By Country, 2017–2024 (USD Million)
Table 37 Europe: Market for Colony-Stimulating Factors, By Country, 2017–2024 (USD Million)
Table 38 APAC: Market for Colony-Stimulating Factors, By Country, 2017–2024 (USD Million)
Table 39 Market for Growth Hormones, By Region, 2017–2024 (USD Million)
Table 40 North America: Protein Engineering Market for Growth Hormones, By Country, 2017–2024 (USD Million)
Table 41 Europe: Market for Growth Hormones, By Country, 2017–2024 (USD Million)
Table 42 APAC: Market for Growth Hormones, By Country, 2017–2024 (USD Million)
Table 43 Market for Coagulation Factors, By Region, 2017–2024 (USD Million)
Table 44 North America: Market for Coagulation Factors, By Country, 2017–2024 (USD Million)
Table 45 Europe: Market for Coagulation Factors, By Country, 2017–2024 (USD Million)
Table 46 APAC: Market for Coagulation Factors, By Country, 2017–2024 (USD Million)
Table 47 Market for Other Proteins, By Region, 2017–2024 (USD Million)
Table 48 North America: Market for Other Proteins, By Country, 2017–2024 (USD Million)
Table 49 Europe: Protein Engineering Market for Other Proteins, By Country, 2017–2024 (USD Million)
Table 50 APAC: Market for Other Proteins, By Country, 2017–2024 (USD Million)
Table 51 Market, By Technology, 2017–2024 (USD Million)
Table 52 Market for Rational Protein Design, By Region, 2017–2024 (USD Million)
Table 53 North America: Market for Rational Protein Design, By Country, 2017–2024 (USD Million)
Table 54 Europe: Market for Rational Protein Design, By Country, 2017–2024 (USD Million)
Table 55 APAC: Protein Engineering Market for Rational Protein Design, By Country, 2017–2024 (USD Million)
Table 56 Market for Irrational Protein Design, By Region, 2017–2024 (USD Million)
Table 57 North America: Market for Irrational Protein Design, By Country, 2017–2024 (USD Million)
Table 58 Europe: Market for Irrational Protein Design, By Country, 2017–2024 (USD Million)
Table 59 APAC: Market for Irrational Protein Design, By Country, 2017–2024 (USD Million)
Table 60 Protein Engineering Industry, By End User, 2017–2024 (USD Million)
Table 61 Protein Engineering Industry for Biopharmaceutical Companies, By Region, 2017–2024 (USD Million)
Table 62 North America: Market for Biopharmaceutical Companies, By Country, 2017–2024 (USD Million)
Table 63 Europe: Market for Biopharmaceutical Companies, By Country, 2017–2024 (USD Million)
Table 64 APAC: Protein Engineering Industry for Biopharmaceutical Companies, By Country, 2017–2024 (USD Million)
Table 65 Market for Contract Research Organizations, By Region, 2017–2024 (USD Million)
Table 66 North America: Market for Contract Research Organizations, By Country, 2017–2024 (USD Million)
Table 67 Europe: Market for Contract Research Organizations, By Country, 2017–2024 (USD Million)
Table 68 APAC: Market for Contract Research Organizations, By Country, 2017–2024 (USD Million)
Table 69 Market for Academic Research Institutes, By Region, 2017–2024 (USD Million)
Table 70 North America: Market for Academic Research Institutes, By Country, 2017–2024 (USD Million)
Table 71 Europe: Protein Engineering Market for Academic Research Institutes, By Country, 2017–2024 (USD Million)
Table 72 APAC: Market for Academic Research Institutes, By Country, 2017–2024 (USD Million)
Table 73 Protein Engineering Industry, By Region, 2017–2024 (USD Million)
Table 74 North America: Protein Engineering Industry, By Country, 2017–2024 (USD Million)
Table 75 North America: Market, By Product & Service, 2017–2024 (USD Million)
Table 76 North America: Market, By Technology, 2017–2024 (USD Million)
Table 77 North America: Market, By End User, 2017–2024 (USD Million)
Table 78 North America: Market, By Protein Type, 2017–2024 (USD Million)
Table 79 US: Market, By Product & Service, 2017–2024 (USD Million)
Table 80 US: Market, By Technology, 2017–2024 (USD Million)
Table 81 US: Market, By End User, 2017–2024 (USD Million)
Table 82 US: Market, By Protein Type, 2017–2024 (USD Million)
Table 83 Canada: Protein Engineering Market, By Product & Service, 2017–2024 (USD Million)
Table 84 Canada: Market, By Technology, 2017–2024 (USD Million)
Table 85 Canada: Market, By End User, 2017–2024 (USD Million)
Table 86 Canada: Market, By Protein Type, 2017–2024 (USD Million)
Table 87 Europe: Protein Engineering Industry, By Country, 2017–2024 (USD Million)
Table 88 Europe: Market, By Product & Service, 2017–2024 (USD Million)
Table 89 Europe: Market, By Technology, 2017–2024 (USD Million)
Table 90 Europe: Market, By End User, 2017–2024 (USD Million)
Table 91 Europe: Market, By Protein Type, 2017–2024 (USD Million)
Table 92 Germany: Protein Engineering Market, By Product & Service, 2017–2024 (USD Million)
Table 93 Germany: Market, By Technology, 2017–2024 (USD Million)
Table 94 Germany: Market, By End User, 2017–2024 (USD Million)
Table 95 Germany: Market, By Protein Type, 2017–2024 (USD Million)
Table 96 UK: Protein Engineering Industry, By Product & Service, 2017–2024 (USD Million)
Table 97 UK: Protein Engineering Industry, By Technology, 2017–2024 (USD Million)
Table 98 UK: Market, By End User, 2017–2024 (USD Million)
Table 99 UK: Market, By Protein Type, 2017–2024 (USD Million)
Table 100 France: Market, By Product & Service, 2017–2024 (USD Million)
Table 101 France: Market, By Technology, 2017–2024 (USD Million)
Table 102 France: Market, By End User, 2017–2024 (USD Million)
Table 103 France: Market, By Protein Type, 2017–2024 (USD Million)
Table 104 RoE: Protein Engineering Market, By Product & Service, 2017–2024 (USD Million)
Table 105 RoE: Market, By Technology, 2017–2024 (USD Million)
Table 106 RoE: Market, By End User, 2017–2024 (USD Million)
Table 107 RoE: Market, By Protein Type, 2017–2024 (USD Million)
Table 108 APAC: Protein Engineering Industry, By Country, 2017–2024 (USD Million)
Table 109 APAC: Market, By Product & Service, 2017–2024 (USD Million)
Table 110 APAC: Market, By Technology, 2017–2024 (USD Million)
Table 111 APAC: Market, By End User, 2017–2024 (USD Million)
Table 112 APAC: Market, By Protein Type, 2017–2024 (USD Million)
Table 113 Japan: Protein Engineering Market, By Product & Service, 2017–2024 (USD Million)
Table 114 Japan: Market, By Technology, 2017–2024 (USD Million)
Table 115 Japan: Market, By End User, 2017–2024 (USD Million)
Table 116 Japan: Market, By Protein Type, 2017–2024 (USD Million)
Table 117 China: Protein Engineering Industry, By Product & Service, 2017–2024 (USD Million)
Table 118 China: Protein Engineering Industry, By Technology, 2017–2024 (USD Million)
Table 119 China: Market, By End User, 2017–2024 (USD Million)
Table 120 China: Market, By Protein Type, 2017–2024 (USD Million)
Table 121 India: Market, By Product & Service, 2017–2024 (USD Million)
Table 122 India: Market, By Technology, 2017–2024 (USD Million)
Table 123 India: Protein Engineering Market, By End User, 2017–2024 (USD Million)
Table 124 India: Market, By Protein Type, 2017–2024 (USD Million)
Table 125 RoAPAC: Protein Engineering Industry, By Product & Service, 2017–2024 (USD Million)
Table 126 RoAPAC: Market, By Technology, 2017–2024 (USD Million)
Table 127 RoAPAC: Market, By End User, 2017–2024 (USD Million)
Table 128 RoAPAC: Protein Engineering Industry, By Protein Type, 2017–2024 (USD Million)
Table 129 RoW: Protein Engineering Industry, By Product & Service, 2017–2024 (USD Million)
Table 130 RoW: Market, By Technology, 2017–2024 (USD Million)
Table 131 RoW: Protein Engineering Industry, By End User, 2017–2024 (USD Million)
Table 132 RoW: Protein Engineering Industry, By Protein Type, 2017–2024 (USD Million)
List of Figures (32 Figures)
Figure 1 Research Design
Figure 2 Breakdown of Primary Interviews: By Company Type, Designation, and Region
Figure 3 Research Methodology: Hypothesis Building
Figure 4 Market Size Estimation: Protein Engineering Market
Figure 5 Market Data Triangulation Methodology
Figure 6 Protein Engineering Industry, By Product & Service, 2019 Vs. 2024 (USD Million)
Figure 7 Market, By Protein Type, 2019 Vs. 2024
Figure 8 Protein Engineering Industry Share, By Technology, 2018
Figure 9 Geographical Snapshot of the Market
Figure 10 Increasing Investments in Synthetic Biology to Drive Market Growth
Figure 11 Instruments Held the Largest Share of the Protein Engineering Market in the Asia Pacific
Figure 12 Biopharmaceutical Companies Dominated the Market in 2018
Figure 13 APAC to Witness the Highest Growth in the Market During the Forecast Period
Figure 14 Protein Engineering Industry: Drivers, Restraints, and Opportunities
Figure 15 Protein Engineering Industry: Geographic Growth Opportunities
Figure 16 North America: Market Snapshot
Figure 17 Asia Pacific: Market Snapshot
Figure 18 Rank of Companies in the Protein Engineering Market, 2018
Figure 19 Vendor Comparison Matrix: Market (2018)
Figure 20 Company Snapshot: Thermo Fisher Scientific, Inc. (2018)
Figure 21 Company Snapshot: Danaher Corporation (2018)
Figure 22 Company Snapshot: Agilent Technologies, Inc. (2019)
Figure 23 Company Snapshot: Bio-Rad Laboratories, Inc. (2018)
Figure 24 Company Snapshot: Bruker Corporation (2018)
Figure 25 Company Snapshot: Genscript Biotech Corporation (2018)
Figure 26 Company Snapshot: Codexis, Inc. (2018)
Figure 27 Company Snapshot: Waters Corporation (2018)
Figure 28 Company Snapshot: Merck KGaA (2018)
Figure 29 Company Snapshot: Perkinelmer, Inc. (2018)
Figure 30 Company Snapshot: GE Healthcare (2018)
Figure 31 Company Snapshot: Abzena, Ltd. (2018)
Figure 32 Company Snapshot: Takara Bio, Inc. (2019)
The study involved two major activities in estimating the current size of the protein engineering market. Exhaustive research was conducted to collect information on the market as well as its peer and parent markets. The next step was to validate these findings, assumptions, and sizing with industry experts across the value chain through primary research. Both top-down and bottom-up approaches were employed to estimate the complete market size. After that, market breakdown and data triangulation were used to estimate the size of segments and sub-segments.
Secondary Research
In the secondary research process, various sources, such as Hoovers, Bloomberg BusinessWeek, Forbes, and Dun & Bradstreet, were referred to for identifying and collecting information useful for this study. Some of the secondary sources used for this study include annual reports, press releases, investor presentations of companies, WHO, OECD, CDC, NHS, NIH, World Bank, European Heart Rhythm Association, Japan Healthcare Info, World Cancer Research Fund International, and National Center for Biotechnology Information. Secondary research was mainly used to obtain vital information about the industry’s supply chain, the total pool of key players, and market classification and segmentation according to industry trends to the bottom-most level. It was also used to obtain information about the key developments from a market-oriented perspective.
Primary Research
The protein engineering market comprises several stakeholders, such as raw material suppliers; manufacturers of protein engineering instruments, consumables, and software & services; and regulatory organizations in the supply chain. Various primary sources from both the supply and demand sides of the market were interviewed to obtain qualitative and quantitative information. The primary respondents from the demand side included research personnel in laboratories and academic & research institutes and purchase managers in biotechnology & pharmaceutical companies, among other end users. The primary sources from the supply side included industry experts such as CEOs, vice presidents, marketing directors, technology and innovation directors, and related key executives from various key companies and organizations operating in the market. Following is the profile breakup of primary respondents:
To know about the assumptions considered for the study, download the pdf brochure
Market Size Estimation
- For the calculation of the global market value, the segmental revenue was arrived at based on the revenue mapping of major players active in the market. This process involved the following steps:
- Generating a list of the major global players operating in the market
- Mapping the annual revenue generated by major global players from their protein engineering business (or the nearest reported business unit/product category)
- Mapping the revenue of major players to cover 50–60% of the global market as of 2018
- Extrapolating the value to 100% to arrive at the global market size
Data Triangulation
After arriving at the overall market size—using the market size estimation process explained above—the market was split into several segments and subsegments. To complete the overall market engineering process and arrive at the exact statistics of each market segment and subsegment, data triangulation and market breakdown procedures were employed, wherever applicable. The data was triangulated by studying various factors and trends from both the demand and supply sides of the protein engineering market.
Report Objectives
- To define, describe, and forecast the global market, by product & service, protein type, technology, end user, and region
- To provide detailed information regarding the major factors influencing the growth of the protein engineering market (drivers, restraints, and opportunities)
- To analyze micromarkets with respect to individual growth trends, prospects, and contributions to the overall market
- To analyze opportunities in the market for stakeholders and provide details of a competitive landscape for market leaders
- To forecast the size (by value) of market segments with respect to four major regions (along with countries)—North America, Europe, the Asia Pacific, and the Rest of the World
- To profile key players and comprehensively analyze their core competencies in terms of key market developments and growth strategies
- To track and analyze competitive developments such as product launches, acquisitions, agreements, and expansions in the protein engineering market
Available Customizations
With the given market data, MarketsandMarkets offers customizations as per the client’s specific needs. The following customization options are available for the report:
Product Analysis
- Product matrix, which gives a detailed comparison of the product portfolios of the top five companies
Geographic Analysis
- Further breakdown of the RoW market into Latin America and the Middle East & Africa
- Further breakdown of the RoE market into Spain and Italy
Company Information
- Detailed analysis and profiling of additional market players (up to 5)

 Generating Response ...


Growth opportunities and latent adjacency in Protein Engineering Market