Rapid Application Development Market by Type (Low-code and No-code), Tool (Mobile-based, Web-based, Desktop-based, and Server-based), Business Function, Deployment Model, Organization Size, Industry Vertical, and Region - Global Forecast to 2023


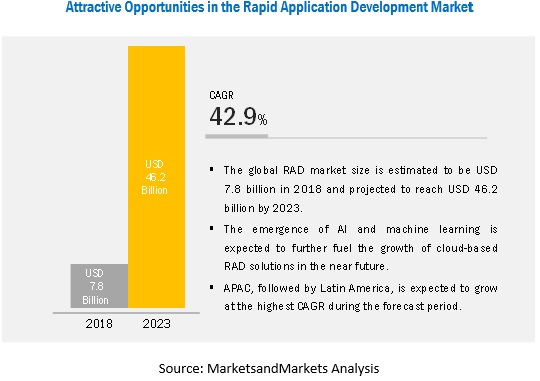
[137 Pages Report] The rapid application development market size is expected to grow from USD 7.8 billion in 2018 to USD 46.2 billion by 2023, at a Compound Annual Growth Rate (CAGR) of 42.9% during the forecast period. The demand for faster software programming is expected to rise over the next 5 years owing to various factors, including need for customized and scalable software. The need for business varies with the total number of workforce and the nature of business. The companies at times to cater their customers� needs rapid delivery and deployment of business related application, the customized apps help in saving time with maximum business orientation. These platforms help developers create customized applications without coding or with minimum hand coding, which help in expediting a high-quality software development process when compared to the traditional Software Development Life Cycle (SDLC). The rise in digital transformation has led organizations to meet the need of clients instantly. The RAD environment enables a technical as well as a non-technical user to develop a customized software application using RAD�s unique underlying characteristics. This is one of the major factors leading to the growing adoption of RAD tools. With RAD tools, an organization can build any application faster, thereby eliminating the time taken for vendor-supplied customization. Another factor accelerating the RAD market is the minimal training to non-developers to enable them to learn more about the software development process.
No-code development platforms are based on the visual development approach, which makes the platforms both scalable and accessible to tech-savvy individuals working across various business lines
No-code development platforms provide software components that help in developing applications using the drag-and-drop method. These tools develop small applications that are usually adopted by small departments or particular business functions to solve basic use cases. No-code development platforms are based on the visual development approach, which makes the platforms both scalable and accessible to tech-savvy individuals working across various business lines. These platforms are gaining traction across various industries and among individual developers, due to its ease of use, ease of deployment, the capability of integration with existing infrastructures, and the advantage that it needs no expertise in JavaScript, Python, or any other programming languages.
Rising web and mobile application users, organizations are utilizing actionable software development solutions to offer customer-centric products, fueling the growth of the overall RAD market
The SMEs are mainly adopting RAD platforms to develop business applications and improve their productivity rapidly. One of the prime motives of the SMEs is to develop customer-centric applications at lower costs. Moreover, the SMEs are looking for cloud-based RAD platforms to save money, time, and resources. Another reason for the SMEs to prefer cloud-based solutions is their financial constraints. Such features are compelling the SMEs to adopt cloud-based RAD platforms, which is expected to be driving the overall growth of the RAD market.
Cloud deployment model to grow at the highest CAGR during the forecast period
The demand for the cloud-based deployment model is expected to be increasing rapidly. These days, more applications are being deployed over the cloud, and the large enterprises and SMEs have been making a shift from the traditional on-premises deployment model to the cloud-based deployment model. SMEs, in particular, implement RAD platforms using the cloud deployment model, as it enables them to focus on their core competencies rather than investing more capital on their IT infrastructure.
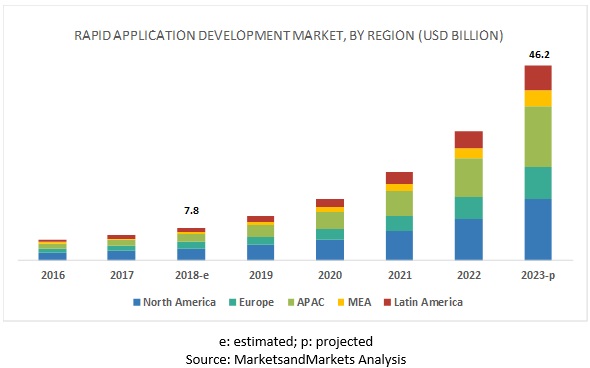
North America to account for the largest market size during the forecast period.
The global rapid application development market by region covers 5 major geographic regions: North America, Asia Pacific (APAC), Europe, the Middle East and Africa (MEA), and Latin America. North America constitutes the highest market share, owing to the early adoption of rapid application development, as well as prominent initiatives taken by the industry players in the form of partnerships with different technology players in the region. The US and Canada are 2 two prominent markets in North America that are witnessing healthy adoption of advanced technologies, such as cloud data warehouse solutions.
Key Players Rapid Application Development Market
The rapid application development market comprises major providers, such as IBM (US), AWS (US), Google (US), Microsoft (US), Oracle (US), Salesforce (US), Appian (US), Mendix (US), Zoho Corporation (India), OutSystems (US), LANSA (US), Ninox (US), Oro (US), Matsoft (UK), Kony (US), Pegasystems (US), ServiceNow (US), WaveMaker (US), KiSSFLOW (India), Radzen (Europe), AmpleLogic (India), FileMaker (US), QuickBase (US), AppSheet (US), and K2 (South Africa). The study includes in-depth competitive analysis of these key players in the global market with their company profiles, recent developments, and key market strategies.
Scope of the Report
|
Report Metrics |
Details |
|
Market size available for years |
2016�2023 |
|
Base year considered |
2017 |
|
Forecast period |
2018�2023 |
|
Forecast units |
Million (USD) |
|
Segments covered |
Type, Component, Business Functions, Deployment Model, Organization Size, Industry Vertical, and Region |
|
Regions covered |
North America, APAC, Europe, Latin America, and MEA |
|
Companies covered |
IBM (US), AWS (US), Google (US), Microsoft (US), Oracle (US), Salesforce (US), Appian (US), Mendix (US), Zoho Corporation (India), OutSystems (US), LANSA (US), Ninox (US), Oro (US), Matsoft (UK), Kony (US), Pegasystems (US), ServiceNow (US), WaveMaker (US), KiSSFLOW (India), Radzen (Europe), AmpleLogic (India), FileMaker (US), QuickBase (US), AppSheet (US), and K2 (South Africa). |
This research report categorizes the rapid application development market based on type, component, business functions, deployment model, organization size, industry vertical, and region.
Based on type, the rapid application development market has been segmented as follows:
- Low-code development platforms
- No-code development platforms
Based on component, the rapid application development market has been segmented as follows:
- Tools
- Mobile-based
- Web-based
- Desktop-based
- Server-based
- Services
- Managed Services
- Professional Services
- Support and maintenance
- Deployment and integration
- Consulting
Based on business functions, the rapid application development market has been segmented as follows:
- Sales and Marketing
- HR and Operations
- Finance
- IT
Based on deployment model, the rapid application development market has been segmented as follows
- On-premises
- Cloud
Based on organization size, the rapid application development market has been segmented as follows
- Small and Medium-sized Enterprises (SMEs)
- Large Enterprises
Based on industry verticals, the rapid application development market has been segmented as follows
- BFSI
- Telecommunications and IT
- Government
- Energy and Utilities
- Manufacturing and Automotive
- Healthcare
- Retail
- Media and Entertainment
- Education
- Others (Travel & Tourism, Transportation & Logistics)
Based on regions, the rapid application development market has been segmented as follows:
- North America
- Europe
- Asia Pacific (APAC)
- Latin America
- Middle East and Africa (MEA)
Key questions addressed by the Rapid Application Development Market report:
- What are the opportunities in the RAD market?
- What is the competitive landscape in the RAD market?
- What are the regulations that will impact the RAD market?
- How are mergers and acquisitions evolving the market?
- What are the dynamics of the RAD market?
Frequently Asked Questions (FAQ):
What is Rapid Application Development?
What are the top companies providing Rapid Application Development software and services?
What is the impact of RAD over the IT Industry?
What are various technologies driving Rapid Application Development?
To speak to our analyst for a discussion on the above findings, click Speak to Analyst
 Exclusive indicates content/data unique to MarketsandMarkets and not available with any competitors.
Table of Contents
1 Introduction (Page No. - 17)
1.1 Objectives of the Study
1.2 Market Definition
1.3 Market Scope
1.3.1 Market Segmentation
1.4 Years Considered for the Study
1.5 Currency Considered
1.6 Stakeholders
2 Research Methodology (Page No. - 20)
2.1 Research Data
2.1.1 Research Methodology
2.1.1.1 Key Industry Insights
2.1.1.2 Breakup of Primaries
2.2 Market Breakup and Data Triangulation
2.3 Market Size Estimation
2.4 Market Forecast
2.5 Assumptions for the Study
2.6 Limitations of the Study
3 Executive Summary (Page No. - 27)
4 Premium Insights (Page No. - 32)
4.1 Attractive Market Opportunities in the Rapid Application Development Market
4.2 Market By Deployment Model, 2018
4.3 North America Market, By Component and By Type
4.4 Market Share Across Regions
5 Market Overview and Industry Trends (Page No. - 35)
5.1 Introduction
5.2 Market Dynamics
5.2.1 Drivers
5.2.1.1 Increasing Need for Rapid Customization and Scalability
5.2.1.2 Enterprise Mobility to Drive the Adoption of Smartphones in Businesses
5.2.1.3 Elimination of Gaps in the Required IT Skills
5.2.2 Restraints
5.2.2.1 Dependency on Vendor-Supplied Customization
5.2.3 Opportunities
5.2.3.1 Growing Digital Transformation in the IT Industry
5.2.4 Challenges
5.2.4.1 Legacy Software in Need of Upgradation
5.3 Use Cases
5.3.1 Use Case # 1: Enhancing the Legacy System to Deliver Faster Business Transactions and Reduce Costs
5.3.2 Use Case # 2: Enhancing the Agile Approach for Higher Customer Satisfaction
5.3.3 Use Case # 3: Green-Screen Legacy System�s Transformation to Modern Web-Based Applications
5.4 Regulatory Implications
5.4.1 Payment Card Industry Data Security Standard
5.4.2 Health Insurance Portability and Accountability Act
5.5 Future Outlook
5.5.1 Application Development With Advanced AI, ML, and Automation
6 Rapid Application Development Market, By Type (Page No. - 41)
6.1 Introduction
6.2 Low-Code Development Platforms
6.2.1 Organizational Need to Develop Customer-Centric Applications
6.3 No-Code Development Platforms
6.3.1 No-Code Development Platforms to Benefit Non-Developers in Designing Applications Without Coding
7 Rapid Application Development Market, By Component (Page No. - 45)
7.1 Introduction
7.2 Tools
7.2.1 Mobile-Based
7.2.1.1 The Increase in the Number of Mobile Device Users Calls for More Mobile-Based Applications
7.2.2 Web-Based
7.2.2.1 Increasing Automation and Advancements in Technologies, Such as IoT, AI, and ML
7.2.3 Desktop-Based
7.2.3.1 Increasing Demand for Simplifying the Development Process to Streamline IT Operations
7.2.4 Server-Based
7.3 Services
7.3.1 Professional Services
7.3.1.1 Support and Maintenance
7.3.1.1.1 The Need for Technical Support and Assistance
7.3.1.2 Deployment and Integration
7.3.1.2.1 The Need to Integrate Vendors� Systems and Customers� Systems With Minimum Deviations to Meet the Requirements
7.3.1.3 Consulting
7.3.1.3.1 The Benefit of Improving the Performance of the Deployed RAD Platforms
8 Rapid Application Development Market, By Business Function (Page No. - 54)
8.1 Introduction
8.2 Sales and Marketing
8.2.1 Increasing Need to Build Applications
8.3 HR and Operations
8.3.1 The Need to Maintain A Record of Operational Activities, Employees� Attendance, and Their Involvement in Other Departments
8.4 Finance
8.4.1 The Need to Streamline Accounting Processes and Procedures, Payrolls, Travel and Reimbursements, Tax, and Budget, and Reporting Applications
8.5 IT
8.5.1 The Increasing Need for File Sharing, Data Security and Storage, Email and Collaboration, and Infrastructure and Network Management Applications
9 Rapid Application Development Market, By Deployment Model (Page No. - 58)
9.1 Introduction
9.2 Cloud
9.2.1 Scalability, Flexibility, and Reliability Benefits
9.3 On-Premises
9.3.1 Need for Highly Secure Operating Environment
10 Rapid Application Development Market, By Organization Size (Page No. - 62)
10.1 Introduction
10.2 Small and Medium-Sized Enterprises
10.2.1 The Need for Cost-Effective Solutions to Meet Budgets and Lead to Business Growth
10.3 Large Enterprises
10.3.1 The Need to Manage Huge Heaps of Accumulated Data Over A Public Or Private Cloud
11 Rapid Application Development Market, By Industry Vertical (Page No. - 66)
11.1 Introduction
11.2 Banking, Financial Services, and Insurance
11.2.1 The Need to Deliver Enriched Customer Experience Using New Financial Products and Services
11.3 Manufacturing and Automotive
11.3.1 The Need to Face Challenges in Quickly Delivering Goods
11.4 Retail and Consumer Goods
11.4.1 The Need to Understand Real-Time Customers� Behavior for Improving Decision-Making Skills
11.5 Telecommunications and IT
11.5.1 Organizations� Need for Many Application Development Solutions
11.6 Government and Public Sector
11.6.1 Rapidly Digitizing Governments and Increasing Need for Web- and Mobile-Based Applications
11.7 Healthcare
11.7.1 The Need for Applications That Monitor Patients� Condition and Related Critical Information
11.8 Media and Entertainment
11.8.1 The Need to Exponentially Increase the Popularity of Media and Entertainment Creates A Need for New Applications
11.9 Education
11.9.1 Increasing Adoption of Online Education Creates Opportunities for Mobile- and Web-Based RAD Platforms
11.9.2 Others
12 Rapid Application Development Market, By Region (Page No. - 75)
12.1 Introduction
12.2 North America
12.2.1 United States
12.2.1.1 The Presence of Leading Global Players and Early Adoption of Cloud Solutions
12.2.2 Canada
12.2.2.1 Growing Investments in Data Management Solutions for Making Better Decisions
12.3 Europe
12.3.1 United Kingdom
12.3.1.1 Strategic Partnerships and Supportive Government Mandates to Drive Business Models in Data-Driven Industries
12.3.2 Germany
12.3.2.1 Numerous Industry Sectors, Such as Pharmaceuticals and Healthcare, to Adopt IoT and Big Data
12.3.3 France
12.3.3.1 Significant Investments in AI and Big Data
12.3.4 Rest of Europe
12.4 Asia Pacific
12.4.1 Japan
12.4.1.1 Increasing Investments in New Technologies and Rising Demand to Deal With Huge Data Volumes
12.4.2 China
12.4.2.1 Increasing Digitalization and Regulatory Mandates at the Forefront
12.4.3 Singapore
12.4.3.1 Strategic Partnerships and Acquisitions By Companies
12.4.4 India
12.4.4.1 The Increasing Number of Collaborations Between Global and Local Players to Offer the Best-In-Class Customer Experience
12.4.5 Rest of Asia Pacific
12.5 Middle East and Africa
12.5.1 Middle East
12.5.1.1 United Arab Emirates, Qatar, and Saudi Arabia to Witness Higher Adoption of Cloud-Based IoT Solutions
12.5.2 Africa
12.5.2.1 Supportive Government Policies
12.6 Latin America
12.6.1 Brazil
12.6.1.1 The Increasing Government Regulations
12.6.2 Mexico
12.6.2.1 The Rapid Growth of Web and Mobile Applications
12.6.3 Rest of Latin America
13 Competitive Landscape (Page No. - 99)
13.1 Competitive Leadership Mapping
13.1.1 Visionaries
13.1.2 Innovators
13.1.3 Dynamic Differentiators
13.1.4 Emerging Companies
13.2 Strength of Product Portfolio
13.3 Business Strategy Excellence
14 Company Profiles (Page No. - 103)
(Business Overview, Products/Tools/Solutions/ Platforms Offered, Recent Developments, SWOT Analysis, and MnM View)*
14.1 Microsoft
14.2 AWS
14.3 Oracle
14.4 IBM
14.5 Google
14.6 Salesforce
14.7 Appian
14.8 Zoho Corporation
14.9 Kissflow
14.10 Outsystems
14.11 Mendix
14.12 Lansa
14.13 Kony
14.14 ORO
14.15 Matssoft
*Details on Business Overview, Products/Tools/Solutions/ Platforms Offered, Recent Developments, SWOT Analysis, and MnM View Might Not Be Captured in Case of Unlisted Companies.
15 Appendix (Page No. - 129)
15.1 Insights From Industry Experts
15.2 Discussion Guide
15.3 Knowledge Store: Marketsandmarkets� Subscription Portal
15.4 Available Customization
15.5 Related Reports
15.6 Author Details
List of Tables (66 Tables)
Table 1 Rapid Application Development Market Analysis
Table 2 Market Size and Growth Rate, 2016�2023 (USD Million, Y-O-Y %)
Table 3 Market Size By Type, 2016�2023 (USD Million)
Table 4 Low-Code Development Platforms: Market Size By Region, 2016�2023 (USD Million)
Table 5 No-Code Development Platforms: Market Size By Region, 2016�2023 (USD Million)
Table 6 Rapid Application Development Market Size, By Component, 2016�2023 (USD Million)
Table 7 Tools: Market Size By Type, 2016�2023 (USD Million)
Table 8 Mobile-Based Market Size, By Region, 2016�2023 (USD Million)
Table 9 Web-Based Market Size, By Region, 2016�2023 (USD Million)
Table 10 Desktop-Based Market Size, By Region, 2016�2023 (USD Million)
Table 11 Server-Based Market Size, By Region, 2016�2023 (USD Million)
Table 12 Services: Market Size By Type, 2016�2023 (USD Million)
Table 13 Professional Services: Market Size By Type, 2016�2023 (USD Million)
Table 14 Rapid Application Development Market Size, By Business Function, 2016�2023 (USD Million)
Table 15 Market Size By Deployment Model, 2016�2023 (USD Million)
Table 16 Cloud: Market Size By Region, 2016�2023 (USD Million)
Table 17 On-Premises: Market Size By Region, 2016�2023 (USD Million)
Table 18 Rapid Application Development Market Size, By Organization Size, 2016�2023 (USD Million)
Table 19 Small and Medium-Sized Enterprises: Market Size By Region, 2016�2023 (USD Million)
Table 20 Large Enterprises: Market Size By Region, 2016�2023 (USD Million)
Table 21 Rapid Application Development Market Size, By Industry Vertical, 2016�2023 (USD Million)
Table 22 Banking, Financial Services, and Insurance: Market Size, By Region, 2016�2023 (USD Million)
Table 23 Manufacturing and Automotive: Market Size By Region, 2016�2023 (USD Million)
Table 24 Retail and Consumer Goods: Market Size By Region, 2016�2023 (USD Million)
Table 25 Telecommunications and IT: Market Size By Region, 2016�2023 (USD Million)
Table 26 Government and Public Sector: Market Size By Region, 2016�2023 (USD Million)
Table 27 Healthcare: Market Size By Region, 2016�2023 (USD Million)
Table 28 Media and Entertainment: Market Size By Region, 2016�2023 (USD Million)
Table 29 Education: Market Size By Region, 2016�2023 (USD Million)
Table 30 Others: Market Size By Region, 2016�2023 (USD Million)
Table 31 Rapid Application Development Market Size, By Region, 2016�2023 (USD Million)
Table 32 North America: Market Size By Type, 2016�2023 (USD Million)
Table 33 North America: Market Size By Component, 2016�2023 (USD Million)
Table 34 North America: Market Size By Tool, 2016�2023 (USD Million)
Table 35 North America: Market Size By Deployment Model, 2016�2023 (USD Million)
Table 36 North America: Market Size By Organization Size, 2016�2023 (USD Million)
Table 37 North America: Market Size By Industry Vertical, 2016�2023 (USD Million)
Table 38 North America: Market Size By Country, 2016�2023 (USD Million)
Table 39 Europe: Rapid Application Development Market Size, By Type, 2016�2023 (USD Million)
Table 40 Europe: Market Size By Component, 2016�2023 (USD Million)
Table 41 Europe: Market Size By Tool, 2016�2023 (USD Million)
Table 42 Europe: Market Size By Deployment Model, 2016�2023 (USD Million)
Table 43 Europe: Market Size By Organization Size, 2016�2023 (USD Million)
Table 44 Europe: Market Size By Industry Vertical, 2016�2023 (USD Million)
Table 45 Europe: Market Size By Country, 2016�2023 (USD Million)
Table 46 Asia Pacific: Rapid Application Development Market Size, By Type, 2016�2023 (USD Million)
Table 47 Asia Pacific: Market Size By Component, 2016�2023 (USD Million)
Table 48 Asia Pacific: Market Size By Tool, 2016�2023 (USD Million)
Table 49 Asia Pacific: Market Size By Deployment Model, 2016�2023 (USD Million)
Table 50 Asia Pacific: Market Size By Organization Size, 2016�2023 (USD Million)
Table 51 Asia Pacific: Market Size By Industry Vertical, 2016�2023 (USD Million)
Table 52 Asia Pacific: Market Size By Country, 2016�2023 (USD Million)
Table 53 Middle East and Africa: Rapid Application Development Market Size, By Type, 2016�2023 (USD Million)
Table 54 Middle East and Africa: Market Size By Component, 2016�2023 (USD Million)
Table 55 Middle East and Africa: Market Size By Tool, 2016�2023 (USD Million)
Table 56 Middle East and Africa: Market Size By Deployment Model, 2016�2023 (USD Million)
Table 57 Middle East and Africa: Market Size By Organization Size, 2016�2023 (USD Million)
Table 58 Middle East and Africa: Market Size By Industry Vertical, 2016�2023 (USD Million)
Table 59 Middle East and Africa: Market Size By Country, 2016�2023 (USD Million)
Table 60 Latin America: Rapid Application Development Market Size, By Type, 2016�2023 (USD Million)
Table 61 Latin America: Market Size By Component, 2016�2023 (USD Million)
Table 62 Latin America: Market Size By Tool, 2016�2023 (USD Million)
Table 63 Latin America: Market Size By Deployment Model, 2016�2023 (USD Million)
Table 64 Latin America: Market Size By Organization Size, 2016�2023 (USD Million)
Table 65 Latin America: Market Size By Industry Vertical, 2016�2023 (USD Million)
Table 66 Latin America: Market Size By Country, 2016�2023 (USD Million)
List of Figures (40 Figures)
Figure 1 Rapid Application Development Market: Research Design
Figure 2 Market Bottom-Up and Top-Down Approaches
Figure 3 Market to Witness High Growth During the Forecast Period
Figure 4 Market By Component (2018�2023)
Figure 5 Market By Tool (2018-2023)
Figure 6 Market By Professional Service (2018�2023)
Figure 7 Market By Deployment Model (2018�2023)
Figure 8 Market By Industry Vertical (2018�2023)
Figure 9 Increasing Need for Rapid Application Customization, Coupled With Rising Business Mobility, is Expected to Be the Major Factor Contributing to the Growth of the Rapid Application Development Market
Figure 10 Cloud to Hold the Largest Market Share in 2018
Figure 11 Low-Code Development Platform in North America to Account for the Largest Market Share in 2018
Figure 12 North America to Hold the Highest Market Share in 2018
Figure 13 Drivers, Restraints, Opportunities, and Challenges: Rapid Application Development Market
Figure 14 No-Code Development Platforms Segment to Grow at A Higher CAGR During the Forecast Period
Figure 15 Services Segment to Grow at A Higher CAGR During the Forecast Period
Figure 16 Mobile-Based Segment to Grow at the Highest CAGR During the Forecast Period
Figure 17 Professional Services Segment to Grow at A Higher CAGR During the Forecast Period
Figure 18 Consulting Segment to Grow at the Highest CAGR During the Forecast Period
Figure 19 Sales and Marketing Segment to Grow at the Highest CAGR During the Forecast Period
Figure 20 Cloud Deployment Model to Grow at A Higher CAGR During the Forecast Period
Figure 21 Small and Medium-Sized Enterprises Segment to Grow at A Higher CAGR During the Forecast Period
Figure 22 Telecommunications and IT Industry Vertical to Grow at the Highest CAGR During the Forecast Period
Figure 23 Asia Pacific to Grow at the Highest CAGR During the Forecast Period
Figure 24 North America: Market Snapshot
Figure 25 Asia Pacific: Market Snapshot
Figure 26 Rapid Application Development Market (Global) Competitive Leadership Mapping, 2018
Figure 27 Microsoft: Company Snapshot
Figure 28 SWOT Analysis: Microsoft
Figure 29 AWS: Company Snapshot
Figure 30 SWOT Analysis: AWS
Figure 31 Oracle: Company Snapshot
Figure 32 SWOT Analysis: Oracle
Figure 33 IBM: Company Snapshot
Figure 34 SWOT Analysis: IBM
Figure 35 Google: Company Snapshot
Figure 36 SWOT Analysis: Google
Figure 37 Salesforce: Company Snapshot
Figure 38 SWOT Analysis: Salesforce
Figure 39 Appian: Company Snapshot
Figure 40 SWOT Analysis: Appian
The study involved 4 major activities to estimate the current market size for the rapid application development market. An exhaustive secondary research was done to collect information on the market, the peer market, and the parent market. The next step was to validate these findings, assumptions, and sizing with industry experts across the value chain through primary research. Both top-down and bottom-up approaches were employed to estimate the complete market size. Thereafter, the market breakdown and data triangulation procedures were used to estimate the market size of the segments and subsegments.
Secondary Research
In the secondary research process, various secondary sources, such as Hoovers, Bloomberg Businessweek, and Dun & Bradstreet, have been referred to identify and collect information for this study. These secondary sources included annual reports; press releases and investor presentations of companies; whitepapers, certified publications and articles by recognized authors; gold standard and silver standard websites; rapid application development technology Research and Development (R&D) organizations; regulatory bodies; and databases.
Primary Research
Various primary sources from both supply and demand sides of the rapid application development market ecosystem were interviewed to obtain qualitative and quantitative information for this study. The primary sources from the supply-side included industry experts, such as Chief Executive Officers (CEOs), Vice Presidents (VPs), marketing directors, technology and innovation directors, and related key executives from various vendors who provide the rapid application development software, associated service providers, and system integrators operating in the targeted regions. All possible parameters that affect the market covered in this research study have been accounted for, viewed in extensive detail, verified through primary research, and analyzed to get the final quantitative and qualitative data.
Following is the breakdown of the primary respondents:
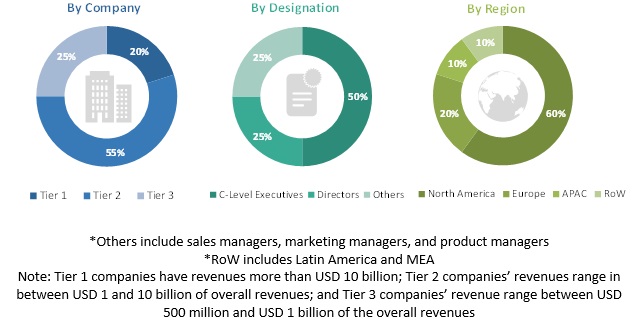
To know about the assumptions considered for the study, download the pdf brochure
Rapid Application Development Market Size Estimation
For making market estimates and forecasting the rapid application development market and other dependent submarkets, the top-down and bottom-up approaches were used. The bottom-up procedure was used to arrive at the overall market size of the global market using key companies� revenues and their offerings in the market. The research methodology used to estimate the market size includes the following:
- The key players in the market have been identified through extensive secondary research.
- The market size, in terms of value, has been determined with the help of the primary and secondary research processes.
- All percentage shares, splits, and breakups have been determined using secondary sources and verified through primary sources.
Data Triangulation
With data triangulation and validation through primary interviews, the exact value of the overall parent market size was determined and confirmed using this study. The overall market size was then used in the top-down procedure to estimate the size of other individual markets via percentage splits of the market segmentation.
Report Objectives
- To define, describe, and forecast the rapid application development market based on type, component, business functions, deployment model, organization size, industry vertical, and region
- To provide detailed information related to major factors, such as drivers, restraints, opportunities, and challenges, influencing the growth of the market
- To analyze the market subsegments with respect to individual growth trends, prospects, and contributions to the total market
- To analyze opportunities in the market for stakeholders and provide the competitive landscape of the market
- To forecast the revenue of the market segments with respect to 5 major regions, namely, North America, Europe, Asia Pacific (APAC), Middle East and Africa (MEA), and Latin America
- To profile the key players and comprehensively analyze their recent developments and positioning in the rapid application development market
- To analyze the competitive developments, such as mergers and acquisitions, new product developments, and R&D activities in the market
Available Customizations
With the given market data, MarketsandMarkets offers customizations as per the company�s specific needs. The following customization options are available for the report:
Product Analysis
- Product matrix gives a detailed comparison of the product portfolio of each company
Company Information
- Detailed analysis and profiling of additional market players up to 5


Growth opportunities and latent adjacency in Rapid Application Development Market