Rotogravure Printing Inks Market by Type (Nitrocellulose, Polyamide, Polyurethane, Acrylic, & Others), Technology (Solvent-Based, Water-Based, & Others), Application (Packaging, Publication, Product, & Promotion) - Global Forecast to 2021


[168 Pages Report] Rotogravure Printing Inks Market size is estimated to reach USD 4.30 Billion by 2021, registering a CAGR of 4.99% between 2016 and 2021. In this study, 2014 has been considered as the historical year and 2015 as the base year for estimating market size, while the forecast period is between 2016 and 2021.
This report aims to estimate the size and future growth potential of the rotogravure printing inks market across different segments such as resin type, technology, application, and region. The study also covers factors such as drivers, restraints, opportunities, and industry-specific challenges that are influencing the market growth and analyzes the opportunities for stakeholders in the market. It also presents the competitive landscape for the market leaders during the forecast period.
Both, top-down and bottom-up, approaches have been used to estimate and validate the size of the global market and the sizes of various other dependent submarkets in the market. The research study involved the use of extensive secondary sources, directories, and databases such as Hoovers, Bloomberg, Chemical Weekly, Factiva, National Association of Printing Ink Manufacturers (NAPIM), Canadian Printing Ink Manufacturers' Association (CPIMA), International Paint and Printing Ink Council (IPPIC), and other government and private & company websites to identify and collect information useful for the technical, market-oriented, and commercial study of the global rotogravure printing inks market.
To know about the assumptions considered for the study, download the pdf brochure
The rotogravure printing inks market has a diversified and established ecosystem of its upstream players such as the raw material suppliers and the downstream stakeholders such as the manufacturers, vendors, end users, and government organizations. Flint Group (Luxembourg), DIC Corporation (Japan), and Toyo Ink SC Holdings Co., Ltd. (Japan), are the manufacturers of rotogravure printing inks and also major raw material suppliers. The major industries where these manufacturers supply rotogravure printing inks include packaging, publication, product, and promotion.
Key Target Audience:
- Rotogravure printing inks manufacturers
- Raw material suppliers
- Traders, distributors, and suppliers of rotogravure printing inks
- Regional manufacturers� associations and general rotogravure printing inks associations
- Government and regional agencies and research organizations
- Investment research firms
Scope of the Report:
This research report categorizes the global rotogravure printing inks market on the basis of resin type, technology, application, and region.
On the basis of Resin Type:
- Nitrocellulose
- Polyamide
- Polyurethane
- Acrylic
- Others
On the basis of Technology:
- Solvent based
- Water based
- Others
On the basis of Application:
- Packaging
- Publication
- Product
- Promotion
On the basis of Region:
- North America
- Europe
- Asia-Pacific
- Middle East & Africa
- RoW
The market is further analyzed for the key countries in each of these regions.
Available Customizations:
With the given market data, MarketsandMarkets offers customizations according to the company�s specific needs. The following customization options are available for the report:
Regional Analysis:
- Country-level analysis of the rotogravure printing inks market by application.
Company Information:
- Detailed analysis and profiling of additional market players.
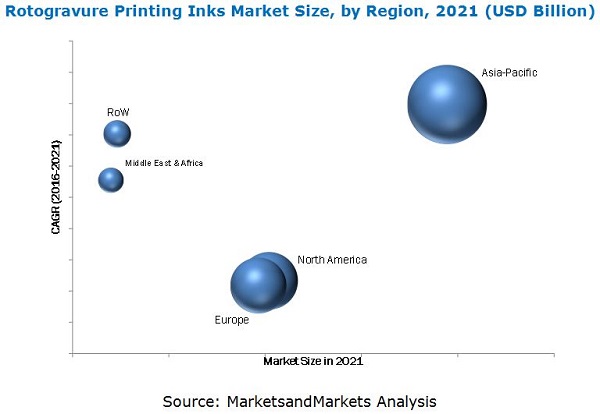
The global market size of rotogravure printing inks is projected to reach USD 4.30 Billion by 2021, registering a CAGR of 4.99% between 2016 and 2021. The growing manufacturing and end-use industries and the increasing flexible packaging application is driving the demand for rotogravure printing inks in the Asia-Pacific region and also the continuous product development, expansion, and merger & acquisition activities undertaken by companies are the key factors driving the global rotogravure printing inks market.
In 2015, the packaging segment accounted for the largest market share, in terms of value, followed by the publication and product segments. The market in the packaging segment is estimated to witness the highest CAGR between 2016 and 2021, in terms of value, because of the demand for online shopping is increasing in the emerging countries. Similarly, labels, plastic bags, and invoice are used for packaging which eventually drives the market.
Nitrocellulose is currently the dominant resin type in the rotogravure printing inks market, while polyamide resin type is estimated to witness the highest CAGR between 2016 and 2021. The rising demand for rotogravure printing inks is mainly driven by its increasing use in the packaging application and its rising demand from the developing countries such as India, China, and Brazil.
Asia-Pacific is also expected to witness the highest growth rate in the market, in terms of value and volume, between 2016 and 2021. Rising investments by foreign companies; growing production facilities; strong industrial base for the packaging, publication, and product sectors; and improvement in standard of living are the other major factors driving the rotogravure printing inks market in this region.
The steady rise of digital media has shrunken the print media market. Owing to this many players have shifted at least half of their marketing spending from traditional to digital advertising over the last few years. Printing ink consumption is declining due decreasing demand of published books, printed newspapers, and catalogues and increasing interest toward the internet, electronic publishing, more usage of mobile phones, and other electronic devices.
Companies such as Flint Group (Luxembourg), DIC Corporation (Japan), Toyo Ink SC Holdings Co., Ltd. (Japan), Dainichiseika Color & Chemicals Mfg. Co., Ltd. (Japan), Sakata Inx Corporation (Japan), T&K Toka Co., Ltd. (Japan), Tokyo Printing Ink Manufacturing Co., Ltd. (Japan), Siegwerk Druckfarben AG & Co. KGaA, (Germany), Hubergroup Deutschland GmbH (Germany), and Wikoff Color Corporation (U.S.) among others are the dominant market players in the global rotogravure printing inks market. The diverse product portfolio and strategically positioned R&D centers, continuous adoption of development strategies, and technological advancements are few factors that are responsible for strengthening position of these companies in the market. They have been adopting various organic and inorganic growth strategies to enhance the current market scenario of rotogravure printing inks.
To speak to our analyst for a discussion on the above findings, click Speak to Analyst
 Exclusive indicates content/data unique to MarketsandMarkets and not available with any competitors.
Table of Contents
1 Introduction (Page No. - 16)
1.1 Objectives of the Study
1.2 Market Definition
1.3 Market Scope
1.3.1 Markets Covered
1.3.2 Years Considered for the Study
1.4 Currency
1.5 Package Size
1.6 Stakeholders
2 Research Methodology (Page No. - 19)
2.1 Introduction
2.1.1 Secondary Data
2.1.2 Key Data From Secondary Sources
2.1.3 Primary Data
2.1.4 Key Data From Primary Sources
2.1.4.1 Key Industry Insights
2.2 Market Size Estimation
2.2.1 Bottom-Up Approach
2.2.2 Top-Down Approach
2.3 Market Breakdown and Data Triangulation
2.4 Assumptions and Limitations
2.4.1 Assumptions
2.4.2 Limitations
3 Executive Summary (Page No. - 28)
4 Premium Insights (Page No. - 33)
4.1 Attractive Opportunities for Market Players in Rotogravure Printing Inks Market
4.2 Rotogravure Printing Inks Market � Major Types
4.3 Rotogravure Printing Inks Market: Developed vs Developing Nations
4.4 Life Cycle Analysis, By Region
4.5 Rotogravure Printing Inks Market
4.6 U.S. and China Dominated the Global Rotogravure Printing Inks Market
5 Market Overview (Page No. - 39)
5.1 Introduction
5.2 Market Segmentation
5.2.1 By Composition Type
5.2.2 By Technology
5.2.3 By Application
5.2.4 By Region
5.3 Market Dynamics
5.3.1 Drivers
5.3.1.1 High Demand for Printing Inks From the Packaging Industry
5.3.1.2 Growth of the Packaging Industry
5.3.1.3 Rising Demand From Asian Countries, Especially in India and China
5.3.1.4 Improving Global Manufacturing Activities
5.3.2 Restraints
5.3.2.1 Shifting Market From Print to Digital Media
5.3.2.2 Need for Labeling of Printing Inks
5.3.3 Opportunities
5.3.3.1 Potential for Green Products
5.3.3.2 Flexible Packaging and Graphic Art Market � an Attractive Prospects for Rotogravure Printing Inks
5.3.4 Challenges
5.3.4.1 Packaging and Printing Regulations
5.3.4.2 Unstable Prices and Supply of Raw Materials
6 Industry Trends (Page No. - 47)
6.1 Introduction
6.2 Value-Chain Analysis
6.3 Porter�s Five Forces Analysis
6.3.1 Intensity of Competitive Rivalry
6.3.2 Bargaining Power of Buyers
6.3.3 Bargaining Power of Suppliers
6.3.4 Threat of Substitutes
6.3.5 Threat of New Entrants
6.4 Pricing and Cost Analysis
7 Rotogravure Printing Inks Market, By Technology (Page No. - 53)
7.1 Introduction
7.2 Solvent-Based
7.3 Water-Based
7.4 Others
8 Rotogravure Printing Inks Market, By Resin Type (Page No. - 62)
8.1 Introduction
8.2 Nitrocellulose
8.3 Polyamide
8.4 Polyurethane
8.5 Acrylic
8.6 Others
9 Rotogravure Printing Inks Market, By Application (Page No. - 74)
9.1 Introduction
9.2 Packaging
9.2.1 Stand-Up Pouches
9.2.2 Flat Pouches
9.2.3 Retort Pouches
9.2.4 Gusseted Bags
9.2.5 Wicketed Bags
9.2.6 Wraps
9.2.7 Others
9.3 Publication
9.4 Product
9.5 Promotion
10 Rotogravure Printing Inks Market, By Region (Page No. - 88)
10.1 Introduction
10.2 North America
10.2.1 U.S.
10.2.2 Canada
10.2.3 Mexico
10.3 Europe
10.3.1 Germany
10.3.2 U.K.
10.3.3 France
10.3.4 Italy
10.3.5 Turkey
10.3.6 Spain
10.3.7 Poland
10.3.8 The Netherlands
10.3.9 Rest of Europe
10.4 Asia-Pacific
10.4.1 China
10.4.2 Japan
10.4.3 India
10.4.4 South Korea
10.4.5 Taiwan
10.4.6 Indonesia
10.4.7 Rest of Asia-Pacific
10.5 The Middle East & Africa
10.5.1 The Middle East
10.5.2 Africa
10.6 Rest of the World (RoW)
10.6.1 Russia
10.6.2 Brazil
10.6.3 Rest of the Countries
11 Competitive Landscape (Page No. - 132)
11.1 Overview
11.2 Mergers & Acquisitions
11.3 New Product Launches
11.4 Investments & Expansions
12 Company Profiles (Page No. - 136)
12.1 Flint Group
12.1.1 Business Overview
12.1.2 Products Offered
12.1.3 Recent Developments
12.1.4 SWOT Analysis
12.1.5 MnM View
12.2 DIC Corporation
12.2.1 Business Overview
12.2.2 Products Offered
12.2.3 Recent Developments
12.2.4 SWOT Analysis
12.2.5 MnM View
12.3 Toyo Ink SC Holdings Co., Ltd.
12.3.1 Business Overview
12.3.2 Products Offered
12.3.3 Recent Developments
12.3.4 SWOT Analysis
12.3.5 MnM View
12.4 Dainichiseika Color & Chemicals MFG. Co., Ltd.
12.4.1 Business Overview
12.4.2 Products Offered
12.4.3 SWOT Analysis
12.4.4 MnM View
12.5 Sakata Inx Corporation
12.5.1 Business Overview
12.5.2 Products
12.5.3 SWOT Analysis
12.5.4 MnM View
12.6 T&K Toka Corporation
12.6.1 Business Overview
12.6.2 Products Offered
12.6.3 SWOT Analysis
12.7 Tokyo Printing Ink MFG. Co., Ltd.
12.7.1 Business Overview
12.7.2 Products Offered
12.7.3 SWOT Analysis
12.8 Siegwerk Druckfarben Ag & Co. KGAA
12.8.1 Business Overview
12.8.2 Products Offered
12.8.3 SWOT Analysis
12.9 Hubergroup Deutschland GmbH
12.9.1 Business Overview
12.9.2 Products Offered
12.9.3 SWOT Analysis
12.10 Wikoff Color Corporation
12.10.1 Business Overview
12.10.2 Products Offered
12.10.3 SWOT Analysis
13 Appendix (Page No. - 161)
13.1 Insights From Industry Experts
13.2 Discussion Guide
13.3 Introducing RT: Real Time Market Intelligence
13.4 Available Customizations
13.5 Related Reports
List of Tables (102 Tables)
Table 1 Rotogravure Printing Inks Market Snapshot (2016 vs 2021)
Table 2 Rotogravure Printing Inks Market Size, By Technology, 2014�2021 (USD Million)
Table 3 Rotogravure Printing Inks Market Size, By Technology, 2016�2021 (Kiloton)
Table 4 Solvent-Based Market Size, By Region, 2014�2021 (USD Million)
Table 5 Solvent-Based Market Size, By Region, 2014�2021 (Kiloton)
Table 6 Water-Based Market Size, By Region, 2014�2021 (USD Million)
Table 7 Water-Based Market Size, By Region, 2014�2021 (Kiloton)
Table 8 Others Market Size, By Region, 2014�2021 (USD Million)
Table 9 Others Market Size, By Region, 2014�2021 (Kiloton)
Table 10 Rotogravure Printing Inks Market Size, By Resin Type, 2014�2021 (USD Million)
Table 11 Rotogravure Printing Inks Market Size, By Resin Type, 2014�2021 (Kiloton)
Table 12 Nitrocellulose Market Size, By Region, 2014�2021 (USD Million)
Table 13 Nitrocellulose Market Size, By Region, 2014�2021 (Kiloton)
Table 14 Polyamide Market Size, By Region, 2014�2021 (USD Million)
Table 15 Polyamide Market Size, By Region, 2014�2021 (Kiloton)
Table 16 Polyurethane Market Size, By Region, 2014�2021 (USD Million)
Table 17 Polyurethane Market Size, By Region, 2014�2021 (Kiloton)
Table 18 Acrylic Market Size, By Region, 2014�2021 (USD Million)
Table 19 Acrylic Market Size, By Region, 2014�2021 (Kiloton)
Table 20 Others Market Size, By Region, 2014�2021 (USD Million)
Table 21 Others Market Size, By Region, 2014�2021 (Kiloton)
Table 22 Rotogravure Printing Inks Market Size, By Application, 2014�2021 (USD Million)
Table 23 Rotogravure Printing Inks Market Size, By Application, 2014�2021 (Kiloton)
Table 24 Packaging Market Size, By Region, 2014�2021 (USD Million)
Table 25 Packaging Market Size, By Region, 2014�2021 (Kiloton)
Table 26 Packaging Market Size, By Sub-Application, 2014�2021 (USD Million)
Table 27 Packaging Market Size, By Sub-Application, 2014�2021 (Kiloton)
Table 28 Stand-Up Pouches Market Size, By Region, 2014�2021 (USD Million)
Table 29 Stand-Up Pouches Market Size, By Region, 2014�2021 (Kiloton)
Table 30 Flat Pouches Market Size, By Region, 2014�2021 (USD Million)
Table 31 Flat Pouches Market Size, By Region, 2014�2021 (Kiloton)
Table 32 Retort Pouches Market Size, By Region, 2014�2021 (USD Million)
Table 33 Retort Pouches Market Size, By Region, 2014�2021 (Kiloton)
Table 34 Gusseted Bags Market Size, By Region, 2014�2021 (USD Million)
Table 35 Gusseted Bags Market Size, By Region, 2014�2021 (Kiloton)
Table 36 Wicketed Bags Market Size, By Region, 2014�2021 (USD Million)
Table 37 Wicketed Bags Market Size, By Region, 2014�2021 (Kiloton)
Table 38 Wraps Market Size, By Region, 2014�2021 (USD Million)
Table 39 Wraps Market Size, By Region, 2014�2021 (Kiloton)
Table 40 Others Market Size, By Region, 2014�2021 (USD Million)
Table 41 Others Market Size, By Region, 2014�2021 (Kiloton)
Table 42 Publication Market Size, By Region, 2014�2021 (USD Million)
Table 43 Publication Market Size, By Region, 2014�2021 (Kiloton)
Table 44 Product Market Size, By Region, 2014�2021 (USD Million)
Table 45 Product Market Size, By Region, 2014�2021 (Kiloton)
Table 46 Promotion Market Size, By Region, 2014�2021 (USD Million)
Table 47 Promotion Market Size, By Region, 2014�2021 (Kiloton)
Table 48 Rotogravure Printing Inks Market Size, By Region, 2014�2021 (USD Million)
Table 49 Rotogravure Printing Inks Market Size, By Region, 2014�2021 (Kiloton)
Table 50 North America: Rotogravure Printing Inks Market Size, By Country, 2014�2021 (USD Million)
Table 51 North America: Rotogravure Printing Inks Market Size, By Country, 2014�2021 (Kiloton)
Table 52 North America: Market Size, By Resin Type, 2014�2021 (USD Million)
Table 53 North America: Market Size, By Resin Type, 2014�2021 (Kiloton)
Table 54 North America: Market Size, By Technology, 2014�2021 (USD Million)
Table 55 North America: Market Size, By Technology, 2014�2021 (Kiloton)
Table 56 North America: Market Size, By Application, 2014�2021 (USD Million)
Table 57 North America: Rotogravure Printing Inks Market Size, By Application, 2014�2021 (Kiloton)
Table 58 Packaging Market Size, By Sub-Application, 2014�2021 (USD Million)
Table 59 Packaging Market Size, By Sub-Application, 2014�2021 (Kiloton)
Table 60 Europe: Market Size, By Country, 2014�2021 (USD Million)
Table 61 Europe: Market Size, By Country, 2014�2021 (Kiloton)
Table 62 Europe: Rotogravure Printing Inks Market Size, By Resin Type, 2014�2021 (USD Million)
Table 63 Europe: Market Size, By Resin Type, 2014�2021 (Kiloton)
Table 64 Europe: Market Size, By Technology, 2014�2021 (USD Million)
Table 65 Europe: Market Size, By Technology, 2014�2021 (Kiloton)
Table 66 Europe: Market Size, By Application, 2014�2021 (USD Million)
Table 67 Europe: Market Size, By Application, 2014�2021 (Kiloton)
Table 68 Packaging Market Size, By Sub-Application, 2014�2021 (USD Million)
Table 69 Packaging Market Size, By Sub-Application, 2014�2021 (Kiloton)
Table 70 Asia-Pacific Rotogravure Printing Inks Market Size, By Country, 2014�2021 (USD Million)
Table 71 Asia-Pacific Market Size, By Country, 2014�2021 (Kiloton)
Table 72 Asia-Pacific: Market Size, By Resin Type, 2014�2021 (USD Million)
Table 73 Asia-Pacific: Market Size, By Resin Type, 2014�2021 (Kiloton)
Table 74 Asia-Pacific: Market Size, By Technology, 2014�2021 (USD Million)
Table 75 Asia-Pacific: Market Size, By Technology, 2014�2021 (Kiloton)
Table 76 Asia-Pacific: Rotogravure Printing Inks Market Size, By Application, 2014�2021 (USD Million)
Table 77 Asia-Pacific: Market Size, By Application, 2014�2021 (Kiloton)
Table 78 Packaging Market Size, By Sub-Application, 2014�2021 (USD Million)
Table 79 Packaging Market Size, By Sub-Application, 2014�2021 (Kiloton)
Table 80 The Middle East & Africa: Market, By Country, 2014-2021 (USD Million)
Table 81 The Middle East & Africa: Market, By Country, 2014-2021 (Kiloton)
Table 82 The Middle East & Africa: Market Size, By Resin Type, 2014-2021 (USD Million)
Table 83 The Middle East & Africa: Rotogravure Printing Inks Market Size, By Resin Type, 2014-2021 (Kiloton)
Table 84 The Middle East & Africa: Market Size, By Technology, 2014�2021 (USD Million)
Table 85 The Middle East & Africa: Market Size, By Technology, 2014�2021 (Kiloton)
Table 86 The Middle East & Africa: Market Size, By Application, 2014-2021 (USD Million)
Table 87 The Middle East & Africa: Market Size, By Application, 2014-2021 (Kiloton)
Table 88 Packaging Market Size, By Sub-Application, 2014�2021 (USD Million)
Table 89 Packaging Market Size, By Sub-Application, 2014�2021 (Kiloton)
Table 90 RoW: Rotogravure Printing Inks Market Size, By Country, 2014�2021 (USD Million)
Table 91 RoW: Market Size, By Country, 2014�2021 (Kiloton)
Table 92 RoW: Market Size, By Resin Type, 2014�2021 (USD Million)
Table 93 RoW: Market Size, By Composition Type, 2014�2021 (Kiloton)
Table 94 RoW: Market Size, By Technology, 2014�2021 (USD Million)
Table 95 RoW: Market Size, By Technology, 2014�2021 (Kiloton)
Table 96 RoW: Rotogravure Printing Inks Market Size, By Application, 2014�2021 (USD Million)
Table 97 RoW: Rotogravure Printing Inks Market Size, By Application, 2014�2021 (Kiloton)
Table 98 Packaging Market Size, By Sub-Application, 2014�2021 (USD Million)
Table 99 Packaging Market Size, By Sub-Application, 2014�2021 (Kiloton)
Table 100 Mergers & Acquisitions, 2012�2016
Table 101 New Product Launches, 2012�2016
Table 102 Investments & Expansions, 2012�2016
List of Figures (66 Figures)
Figure 1 Rotogravure Printing Inks Market Segmentation
Figure 2 Rotogravure Printing Inks Market: Research Design
Figure 3 Data From Secondary Sources
Figure 4 Data From Primary Sources
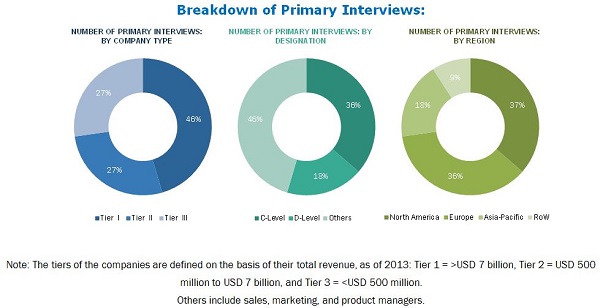
Figure 5 Breakdown of Primary Interviews: By Company Type, Designation, and Region
Figure 6 Market Size Estimation: Bottom-Up Approach
Figure 7 Market Size Estimation: Top-Down Approach
Figure 8 Market Breakdown and Data Triangulation
Figure 9 Assumptions in the Research Study
Figure 10 Limitations of the Research Study
Figure 11 Asia-Pacific to Dominate the Global Rotogravure Printing Inks Market By 2021
Figure 12 Nitrocellulose Segment Dominates Rotogravure Printing Inks Market in 2015
Figure 13 Packaging Application to Be Fastest-Growing Application Segment Between 2016 and 2021
Figure 14 Asia-Pacific is the Fastest-Growing Market for Rotogravure Printing Inks
Figure 15 Emerging Economies Will Offer Lucrative Growth Potential for Market Players
Figure 16 Polyamides Segment to Witness Highest CAGR in Rotogravure Printing Inks Market Between 2016 and 2021
Figure 17 Markets to Grow Faster in Developing Nations Than Developed Ones
Figure 18 Asia-Pacific Market Projected to Grow Rapidly During the Forecast Period
Figure 19 Packaging Segment Accounted for the Largest Share of the Rotogravure Printing Inks Market in 2015
Figure 20 India Projected to Witness Highest CAGR During Forecast Period
Figure 21 U.S. and China Accounted for the Largest Share of the Rotogravure Printing Inks Market in 2015
Figure 22 Rotogravure Printing Inks Market, By Region
Figure 23 Drivers, Restraints, Opportunities, and Challenges
Figure 24 Top Economies By GDP in PPP Terms: 2010 & 2020
Figure 25 Crude Oil Average Spot Prices, 2013-2020 (USD/Barrel)
Figure 26 Rotogravure Printing Inks Value-Chain Analysis
Figure 27 Porter�s Five Forces Analysis
Figure 28 Solvent-Based Segment of Rotogravure Printing Inks to Dominate the Market During the Forecast Period
Figure 29 Nitrocellulose Segment of Rotogravure Printing Inks to Dominate the Market During the Forecast Period
Figure 30 North America Dominated the Rotogravure Printing Inks Market in 2015
Figure 31 High Growth in Major Application Industries Will Continue to Drive the Market
Figure 32 Packaging is the Fastest-Growing Application Segment During the Forecast Period
Figure 33 India, and China are Emerging as Hotspots in the Global Rotogravure Printing Inks Market
Figure 34 Asia-Pacific, A Potential Market for Rotogravure Printing Inks Resin Type
Figure 35 Market for Rotogravure Printing Inks Technology Expected to Be Driven By Asia-Pacific
Figure 36 Future Growth for Rotogravure Printing Inks Applications Centered on Asia-Pacific, and RoW
Figure 37 Asia-Pacific: High Growth of Rotogravure Printing Inks Market in 2015
Figure 38 Asia-Pacific: the Largest Market for Rotogravure Printing Inks in 2015
Figure 39 Rotogravure Printing Inks Market in North America Snapshot
Figure 40 U.S.: Rise in Flexible Packaging to Drive the Rotogravure Printing Inks Market
Figure 41 Europe: Rise in the Demand for Packaging Products to Drive the Rotogravure Printing Inks Market
Figure 42 Turkey: High Growth Market in Europe
Figure 43 Attractiveness of Rotogravure Printing Inks Market in Asia-Pacific Market
Figure 44 Companies Adopted Mergers & Acquisitions as the Key Growth Strategy Between 2011 and 2016
Figure 45 Market Evaluation Framework: Significant Number of Mergers & Acquisitions and New Product Launches Fueled Growth and Innovation, 2012�2016
Figure 46 Battle for Market Share: Mergers & Acquisitions and New Product Launches Was the Key Strategy
Figure 47 Flint Group: Company Snapshot
Figure 48 Flint Group: SWOT Analysis
Figure 49 DIC Corporation: Company Snapshot
Figure 50 DIC Corporation: SWOT Analysis
Figure 51 Toyo Ink SC Holdings Co., Ltd.: Company Snapshot
Figure 52 Toyo Ink SC Holdings Co., Ltd.: SWOT Analysis
Figure 53 Dainichiseika Color & Chemicals MFG. Co., Ltd.: Company Snapshot
Figure 54 Dainichiseika Color & Chemicals MFG. Co., Ltd.: SWOT Analysis
Figure 55 Sakata Inx Corporation: Company Snapshot
Figure 56 Sakata Inx Corporation: SWOT Analysis
Figure 57 T&K Toka Corporation: Company Snapshot
Figure 58 T&K Toka Corporation: SWOT Analysis
Figure 59 Tokyo Printing Ink MFG. Co., Ltd.: Company Snapshot
Figure 60 Tokyo Printing Ink MFG. Co., Ltd.: SWOT Analysis
Figure 61 Siegwerk Druckfarben Ag & Co. KGAA: Company Snapshot
Figure 62 Siegwerk Druckfarben Ag & Co. KGAA: SWOT Analysis
Figure 63 Hubergroup Deutschland GmbH: Company Snapshot
Figure 64 Hubergroup Deutschland GmbH: SWOT Analysis
Figure 65 Wikoff Color Corporation: Company Snapshot
Figure 66 Wikoff Color Corporation: SWOT Analysis


Growth opportunities and latent adjacency in Rotogravure Printing Inks Market