Safety Valves Market by Size (Up to 1 inch, 1�6 inch, 6 � 25 inch, 25 � 50-inch, 50 inch, and Above), Material (Stainless Steel, Cast Iron, Alloy, Cryogenic), Industry (Oil & Gas, Energy & Power, Water & Wastewater), and Region - Global Forecast to 2025-2036


The global safety valve market was valued at USD 5.54 billion in 2024 and is estimated to reach USD 12.28 billion by 2036, at a CAGR of 6.9% between 2025 and 2036.
The global safety valve market is driven by rising industrial safety requirements, stringent regulatory frameworks, and increasing investments across various sectors, including oil & gas, energy & power, chemicals, phrmaceuticals, agriculture, and others. Technological advancements, including IoT-enabled monitoring, predictive maintenance capabilities, and the use of corrosion-resistant materials, are enhancing reliability, efficiency, and lifecycle performance. Ongoing infrastructure development and urban expansion in the Asia Pacific, particularly in China and India, are further accelerating demand, with key players focusing on product innovation, certification compliance, and regional expansion to meet evolving safety and performance standards worldwide.

Safety valves are pressure relief devices designed to automatically release excess pressure from boilers, pipelines, and other pressurized systems, thereby preventing equipment failure, explosions, or accidents. They play a crucial role in maintaining operational safety and protecting personnel, equipment, and the environment across various industries, including oil & gas, power generation, chemical processing, and manufacturing. Safety valves are available in various types, including spring-loaded, pilot-operated, and proportional valves, and are made from high-performance materials to withstand extreme temperatures and corrosive environments. Modern designs also incorporate smart monitoring and diagnostic features for improved reliability and predictive maintenance..
Market by Industry
Oil & Gas
The oil & gas industry is the largest segment in the safety valve market, driven by the sector’s critical need for pressure regulation, equipment protection, and adherence to strict safety and environmental regulations. Safety valves are extensively used in pipelines, compressors, storage tanks, and processing units to prevent overpressure, reduce operational risks, and ensure system reliability under extreme conditions. Growing investments in refinery modernization, LNG facilities, and offshore exploration are further boosting demand for advanced, high-performance valves. Additionally, the integration of smart sensors and IoT-enabled monitoring allows real-time pressure tracking and predictive maintenance, enhancing operational safety and efficiency across upstream, midstream, and downstream operations.
Agriculture
Agriculture is expected to emerge as one of the fast-growing application areas for safety valves, driven by the increasing adoption of automated irrigation systems, high-pressure spraying equipment, and modern fertilizer and pesticide distribution networks. Safety valves are being integrated into pumps, pipelines, and storage tanks to prevent overpressure, equipment damage, and leakages during fluid handling operations. The use of corrosion-resistant materials andrecision control mechanisms ensures reliable performance under varying pressure and temperature conditions. Additionally, the integration of smart sensors and IoT-based monitoring enables real-time pressure tracking, predictive maintenance, and improved operational safety across large-scale farming and agro-processing facilities.
Energy & Power
The energy & power industry is a major segment in the safety valve market, driven by the need to ensure safe and efficient operations across thermal, nuclear, and renewable power plants. Safety valves safeguard boilers, turbines, steam lines, and pressure vessels from overpressure, protecting equipment and ensuring compliance with strict safety regulations. Increasing investments in plant modernization, high-efficiency systems, and low-emission technologies are fueling demand for reliable, high-performance valves. The adoption of smart sensors, real-time monitoring, and predictive maintenance further enhances operational safety, minimizes downtime, and optimizes overall plant performance.
Market by Material
Cryogenic
Cryogenic materials are one of the rapidly growing segment in the safety valve market, driven by the need to safely manage extremely low-temperature fluids such as LNG, liquid nitrogen, and liquid oxygen. Safety valves made from cryogenic-grade materials are engineered to withcstand thermal stress, prevent leaks, and ensure reliable pressure relief under harsh, sub-zero conditions. They are widely used in industries such as energy, chemical processing, and aerospace, where precise and safe handling of liquefied gases is critical. With advanced material properties, precision manufacturing, and integration with smart monitoring systems, cryogenic safety valves deliver high performance, durability, and enhanced operational safety in demanding applications.
Steel
Steel is a dominant material segment in the safety valve market, valued for its strength, durability, and corrosion resistance in demanding industrial environments. Steel safety valves are designed to operate reliably under high pressure and temperature conditions, making them suitable for applications in oil & gas, power generation, chemical processing, and other heavy industries. They offer easy integration with pipelines, boilers, and pressure vessels, ensuring effective overpressure protection and compliance with safety regulations. With features such as precision engineering, high-temperature tolerance, and long service life, steel safety valves provide dependable and efficient solutions for critical industrial operations.
Market by Geography
Geographically, the safety valve market is witnessing widespread adoption across Asia Pacific, North America, Europe, and the Rest of the World (RoW), which includes the Middle East, Africa, and South America. Asia Pacific leads the market, driven by expanding oil & gas, power generation, and chemical projects, along with increasing investments in modern manufacturing infrastructure. The region’s competitive landscape and focus on safety standards are also fueling growth. North America follows closely, supported by stringent safety regulations, advanced industrial infrastructure, and the adoption of smart monitoring and predictive maintenance technologies. Europe is experiencing steady demand, driven by industrial modernization, regulatory compliance, and energy-efficient initiatives, while RoW is emerging as a promising market due to expanding infrastructure, energy projects, and growing emphasis on industrial safety.
Market Dynamics
Driver: Importance of Safety Valves in Industrial Processes
Industrial operations, particularly in the energy sector, are highly sensitive to extreme temperature, pressure, and other adverse conditions that can disrupt production, damage equipment, and affect supply chains. Safety valves play a critical role in mitigating these risks by ensuring controlled pressure relief, protecting equipment, and maintaining system stability during abnormal operating conditions. Incorporating safety valves is essential not only for operational reliability but also for broader climate resilience and risk management strategies in industrial infrastructure. For instance, nuclear power plants rely on safety valves as part of comprehensive emergency protection systems to safeguard fuel integrity and maintain safe operation under unforeseen or extreme scenarios. By enabling timely pressure regulation, safety valves ensure both equipment safety and continuous, efficient industrial performance.
Restraint: High Cost and Maintenance Requirements
The high initial cost of advanced safety valves, including high-pressure, cryogenic, and smart IoT-enabled models, remains the single largest restraint on market growth. These valves require precision engineering and specialized materials, making them expensive to manufacture and purchase. In addition, regular inspection, calibration, and maintenance are essential to ensure safe operation and compliance with strict industry standards. Small- and medium-sized industrial facilities, particularly in developing regions, often find it difficult to afford these upfront and recurring costs, limiting adoption. This cost barrier affects multiple industries, including oil & gas, energy, chemical processing, and manufacturing, slowing overall market expansion.
Opportunity: Growing Adoption of Smart and IoT-Enabled Safety Valves
The increasing demand for automation and digital monitoring in industrial processes presents a major opportunity for the safety valve market. Smart valves equipped with IoT sensors and real-time diagnostic capabilities enable predictive maintenance, reduce downtime, and enhance operational safety. Industries such as oil & gas, energy, chemical processing, and cryogenics are increasingly adopting these advanced solutions to improve efficiency, comply with safety regulations, and minimize operational risks, creating significant growth potential for valve manufacturers.
Challenge: Dependence on Skilled Workforce for Installation and Maintenance
The effectiveness of safety valves heavily depends on skilled personnel for proper installation, calibration, and maintenance. Advanced models, especially high-pressure and smart IoT-enabled valves, require precise handling to ensure safe operation and compliance with industry standards. In regions or sectors with a limited pool of trained engineers and technicians, improper installation or delayed maintenance can lead to operational risks, reduced valve lifespan, and system downtime, which can hinder overall market adoption and growth.
Future Outlook
Between 2025 and 2036, the safety valve market is expected to grow significantly as industrial safety and process reliability become increasingly critical across oil & gas, energy, chemical, and manufacturing sectors. Advances in IoT-enabled monitoring, smart diagnostics, and predictive maintenance will transform safety valves from passive pressure-relief devices into intelligent solutions capable of real-time performance monitoring and early fault detection. Rising investments in industrial automation, infrastructure expansion, and stringent safety regulations will further accelerate adoption. As the market evolves, safety valves will play a pivotal role in enhancing operational efficiency, minimizing downtime, and ensuring safer industrial environments worldwide.
Key Market Players
Top safety valve companies Emerson Electric Co. (US),.LESER GmbH & Co. KG (Germany), Forbes Marshall Pvt. Ltd. (India), IMI plc (UK), and SLB (US).
Key Questions addressed in this report:
- What are the global trends driving demand in the safety valve market?
- Which emerging technologies or advanced safety valve types will have a significant impact on the market in the coming years?
- Which industrial sectors and regions will offer the highest revenue opportunities for safety valve manufacturers over the next 6 years?
- What are the key strategies and initiatives being adopted by leading players in the safety valve market to maintain competitiveness and growth?
 Exclusive indicates content/data unique to MarketsandMarkets and not available with any competitors.
Table of Contents
1 Introduction (Page No. - 16)
1.1 Study Objectives
1.2 Definition
1.3 Study Scope
1.3.1 Markets Covered
1.3.2 Years Considered
1.4 Currency
1.5 Limitations
1.6 Stakeholders
2 Research Methodology (Page No. - 19)
2.1 Research Data
2.1.1 Secondary and Primary Research
2.1.1.1 Key Industry Insights
2.1.2 Secondary Data
2.1.2.1 Key Data From Secondary Sources
2.1.3 Primary Data
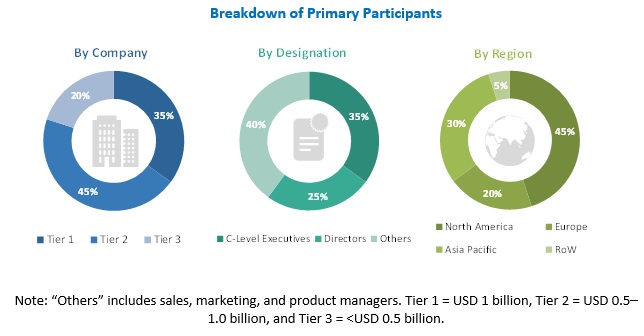
2.1.3.1 Breakdown of Primaries
2.1.3.2 Key Data From Primary Sources
2.2 Market Size Estimation
2.2.1 Bottom-Up Approach
2.2.2 Top-Down Approach
2.3 Market Breakdown and Data Triangulation
2.4 Research Assumptions
3 Executive Summary (Page No. - 28)
4 Premium Insights (Page No. - 32)
4.1 Attractive Growth Opportunities in Safety Valves Market
4.2 Market, By Material
4.3 Market in APAC, By Country and Industry
4.4 Market, By Country (2019)
5 Market Overview (Page No. - 34)
5.1 Introduction
5.2 Market Dynamics
5.2.1 Drivers
5.2.1.1 Importance of Safety Valves in Industrial Processes
5.2.1.2 Increased Need From Oil & Gas
5.2.1.3 Growth in Nuclear Energy Generation
5.2.2 Restraints
5.2.2.1 Decline in Oil and Gas Extraction
5.2.3 Opportunities
5.2.3.1 Constant Need for Safety Valve Replacement
5.2.3.2 Use of 3D Printers in Manufacturing Lines
5.2.4 Challenges
5.2.4.1 High Cost of Fabrication
5.3 Value Chain Analysis
6 Safety Valve Market, By Material (Page No. - 39)
6.1 Introduction
6.2 Steel
6.2.1 Steel to Dominate Safety Valve Market During Forecast Period
6.3 Cast Iron
6.3.1 Cast Iron for Safety Valves Gained Traction in Water & Wastewater Industry and Hydroelectric Power Plants
6.4 Alloy
6.4.1 Alloy-Based Safety Valves Play Significant Role in Overall Market
6.5 Cryogenic
6.5.1 Cryogenic Valves to Grow at Fastest Rate
6.6 Others
6.6.1 Brass
6.6.2 Bronze
6.6.3 Plastic
7 Safety Valves Market, By Size (Page No. - 44)
7.1 Introduction
7.2 Up to 1"
7.2.1 Up to 1" Safety Valves to Witness Significant Growth
7.3 1" to 6"
7.3.1 1" to 6" Safety Valves to Dominate the Market During Forecast Period
7.4 6" to 25"
7.4.1 6" to 25" Safety Valves to Drive the Market for High Pressure Applications
7.5 25" to 50"
7.5.1 Chemicals, Energy & Power, and Pharmaceutical Plants are Key Industries for 25" to 50" Safety Valves for High Temperature and Pressure Handling Applications
7.6 50" and Larger
7.6.1 50" and Larger Safety Valves to Drive Market for Oil & Gas, Power, and Petrochemicals
8 Safety Valve Market, By Industry (Page No. - 48)
8.1 Introduction
8.2 Oil & Gas
8.2.1 Oil & Gas Industry to Dominate the Safety Valves Market During the Forecast Period
8.3 Energy & Power
8.3.1 Energy & Power Industry to Witness Significant Growth in Market
8.4 Chemicals
8.4.1 APAC Dominates the Safety Valves Market for Chemical Industry
8.5 Water & Wastewater
8.5.1 Water & Wastewater is Expected to Be Fastest Growing Industry for Safety Valves Market Owing to Modernizing the Aging Water Infrastructure and Increased Investments in Smart Cities
8.6 Building & Construction
8.6.1 Building & Construction Industry is Expected to Witness Significant Growth Owing to Urbanization and Smart Infrastructure
8.7 Pharmaceuticals
8.7.1 APAC to Drive Market for Pharmaceuticals
8.8 Agriculture
8.8.1 Irrigation and Precision Farming are Key Application Areas of Safety Valves for Agriculture Industry
8.9 Metal & Mining
8.9.1 APAC to Drive Market for Metal & Mining
8.10 Paper & Pulp
8.10.1 APAC to Dominate the Safety Valves Market for Paper & Pulp Industry During the Forecast Period
8.11 Food & Beverages
8.11.1 Food & Beverage Industry to Witness Significant Growth in Market
8.12 Others
9 Geographic Analysis (Page No. - 78)
9.1 Introduction
9.2 North America
9.2.1 US
9.2.1.1 US is Fastest-Growing Country for Safety Valves in North America
9.2.2 Canada
9.2.2.1 Growth in Oil & Gas Drives Safety Valve Market in Canada
9.2.3 Mexico
9.2.3.1 Increased Spending in Energy Sector Drives Safety Valve Market in Mexico
9.3 Europe
9.3.1 Germany
9.3.1.1 Upcoming Water and Wastewater Treatment Projects Drive Market in Germany
9.3.2 UK
9.3.2.1 UK Held Largest Share of Market in Europe
9.3.3 France
9.3.3.1 Investment in Nuclear Power Generation to Boost Market Growth in France
9.3.4 Italy
9.3.4.1 Upgrades in Water and Wastewater Treatment Infrastructure to Boost Demand for Safety Valve in Italy
9.3.5 Rest of Europe
9.4 APAC
9.4.1 China
9.4.1.1 China Held Largest Share of Safety Valve Market in APAC in 2018
9.4.2 Japan
9.4.2.1 Increasing Investment in Renewable Energy and Power Generation in Japan Will Increase Demand for Safety Valves in Japan
9.4.3 India
9.4.3.1 India is Among Fastest-Growing Countries for Safety Valve Market
9.4.4 South Korea
9.4.4.1 Various Projects for Semiconductors and Chemicals to Boost Market in South Korea
9.4.5 Rest of APAC
9.5 RoW
9.5.1 South America
9.5.1.1 Growth in Oil & Gas Will Drive Safety Valve Market in South American Countries
9.5.2 Middle East
9.5.2.1 Middle East to Hold Largest Share of Market in RoW By 2024
9.5.3 Africa
9.5.3.1 Investment in Water & Wastewater Treatment and Energy & Power is Driving Safety Valve Market
10 Competitive Landscape (Page No. - 91)
10.1 Overview
10.2 Market Rank Analysis
10.3 Competitive Situations and Trends
10.3.1 Expansion
10.3.3 Others
10.4 Competitive Leadership Mapping
10.4.1 Visionary Leaders
10.4.2 Dynamic Differentiators
10.4.3 Innovators
10.4.4 Emerging Companies
10.5 Product Offering (For All 27 Players)
10.6 Business Strategy Excellence (For All 27 Players)
11 Company Profile (Page No. - 100)
(Business Overview, Products Offered, Recent Developments, MnM View)*
11.1 Key Players
11.1.1 Emerson
11.1.2 Weir Group
11.1.3 Forbes Marshall
11.1.4 Curtiss-Wright Corporation
11.1.5 Schlumberger
11.1.6 Bosch Rexroth
11.1.7 Baker Hughes (A GE Company)
11.1.8 IMI PLC
11.1.9 Alfa Laval
11.1.10 Leser
11.2 Other Ecosystem Players
11.2.1 Frese
11.2.2 ARI-Armaturen
11.2.3 Danfoss
11.2.4 Swagelok
11.2.5 Taylor Valve Technology
11.2.6 SMC Corporation
11.2.7 GEA Group
11.2.8 Aquatrol Valve Company
11.2.9 Parker-Hannifin
11.2.10 VYC Industrial
*Business Overview, Products Offered, Recent Developments, MnM View Might Not Be Captured in Case of Unlisted Companies.
12 Appendix (Page No. - 124)
12.1 Insights of Industry Experts
12.2 Discussion Guide
12.3 Knowledge Store: Marketsandmarkets’ Subscription Portal
12.4 Available Customizations
12.5 Related Reports
12.6 Author Details
List of Tables (65 Tables)
Table 1 Safety Valve Market, By Material, 2015–2024 (USD Billion)
Table 2 Market, By Size, 2015–2024 (USD Billion)
Table 3 Market, By Industry, 2015–2024 (USD Billion)
Table 4 Market for Oil & Gas, By Region, 2015–2024 (USD Million)
Table 5 Market in North America for Oil & Gas, By Country, 2015–2024 (USD Million)
Table 6 Market in Europe for Oil & Gas, By Country, 2015–2024 (USD Million)
Table 7 Market in APAC for Oil & Gas, By Country, 2015–2024 (USD Million)
Table 8 Market in RoW for Oil & Gas, By Country, 2015–2024 (USD Million)
Table 9 Safety Valve Market in Energy & Power, By Region, 2015–2024 (USD Million)
Table 10 Market in North America for Energy & Power, By Country, 2015–2024 (USD Million)
Table 11 Market in Europe for Energy & Power, By Country, 2015–2024 (USD Million)
Table 12 Market in APAC for Energy & Power, By Country, 2015–2024 (USD Million)
Table 13 Market in RoW for Energy & Power, By Country, 2015–2024 (USD Million)
Table 14 Market in Chemicals, By Region, 2015–2024 (USD Million)
Table 15 Market in North America for Chemicals, By Country, 2015–2024 (USD Million)
Table 16 Market in Europe for Chemicals, By Country, 2015–2024 (USD Million)
Table 17 Market in APAC for Chemicals, By Country, 2015–2024 (USD Million)
Table 18 Market in RoW for Chemicals, By Country, 2015–2024 (USD Million)
Table 19 Safety Valve Market for Water & Wastewater, By Region, 2015–2024 (USD Million)
Table 20 Market in North America for Water & Wastewater, By Country, 2015–2024 (USD Million)
Table 21 Market in Europe for Water & Wastewater, By Country, 2015–2024 (USD Million)
Table 22 Market in APAC for Water & Wastewater, By Country, 2015–2024 (USD Million)
Table 23 Market in RoW for Water & Wastewater, By Country, 2015–2024 (USD Million)
Table 24 Market for Building & Construction, By Region, 2015–2024 (USD Million)
Table 25 Market in North America for Building & Construction, By Country, 2015–2024 (USD Million)
Table 26 Safety Valve Market in Europe for Building & Construction, By Country, 2015–2024 (USD Million)
Table 27 Market in APAC for Building & Construction, By Country, 2015–2024 (USD Million)
Table 28 Market in RoW for Building & Construction, By Country, 2015–2024 (USD Million)
Table 29 Market in Pharmaceuticals, By Region, 2015–2024 (USD Million)
Table 30 Market in North America for Pharmaceuticals, By Country, 2015–2024 (USD Million)
Table 31 Market in Europe for Pharmaceuticals, By Country, 2015–2024 (USD Million)
Table 32 Market in APAC for Pharmaceuticals, By Country, 2015–2024 (USD Million)
Table 33 Market in RoW for Pharmaceuticals, By Country, 2015–2024 (USD Million)
Table 34 Market for Agriculture, By Region 2015–2024 (USD Million)
Table 35 Market in North America for Agriculture, By Country, 2015–2024 (USD Million)
Table 36 Safety Valve Market in Europe for Agriculture, By Country, 2015–2024 (USD Million)
Table 37 Market in APAC for Agriculture, By Country, 2015–2024 (USD Million)
Table 38 Market in RoW for Agriculture, By Country, 2015–2024 (USD Million)
Table 39 Market for Metal & Mining, By Region, 2015–2024 (USD Million)
Table 40 Market in North America for Metal & Mining, By Country, 2015–2024 (USD Million)
Table 41 Market in Europe for Metal & Mining, By Country, 2015–2024 (USD Million)
Table 42 Market in APAC for Metal & Mining, By Country, 2015–2024 (USD Million)
Table 43 Market in RoW for Metal & Mining, By Country, 2015–2024 (USD Million)
Table 44 Market in Paper & Pulp, By Region, 2015–2024 (USD Million)
Table 45 Market in North America for Paper & Pulp, By Country, 2015–2024 (USD Million)
Table 46 Market in Europe for Paper & Pulp, By Country, 2015–2024 (USD Million)
Table 47 Market in APAC for Paper & Pulp, By Country, 2015–2024 (USD Million)
Table 48 Market in RoW for Paper & Pulp, By Country, 2015–2024 (USD Million)
Table 49 Market for Food & Beverages, By Region, 2015–2024 (USD Million)
Table 50 Safety Valve Market in North America for Food & Beverages, By Country, 2015–2024 (USD Million)
Table 51 Market in Europe for Food & Beverages, By Country, 2015–2024 (USD Million)
Table 52 Market in APAC for Food & Beverages, By Country, 2015–2024 (USD Million)
Table 53 Market in RoW for Food & Beverages, By Country, 2015–2024 (USD Million)
Table 54 Safety Valves Market, By Region, 2015–2024 (USD Billion)
Table 55 Market in North America, By Country, 2015–2024 (USD Million)
Table 56 Market in North America, By Industry, 2015–2024 (USD Million)
Table 57 Market in Europe, By Country, 2015–2024 (USD Million)
Table 58 Safety Valves Market in Europe, By Industry, 2015–2024 (USD Million)
Table 59 Market in APAC, By Country, 2015–2024 (USD Million)
Table 60 Market in APAC, By Industry, 2015–2024 (USD Million)
Table 61 Market in RoW, By Country, 2015–2024 (USD Million)
Table 62 Market in RoW, By Industry, 2015–2024 (USD Million)
Table 63 Expansion (2013–2018)
Table 64 Top 5 Partnerships, Agreements, and Contracts (2013–2018)
Table 65 Top 5 Product Launch, Acquisition, and Others (2013–2018)
List of Figures (40 Figures)
Figure 1 Safety Valve Market: Research Design
Figure 2 Market Size Estimation Methodology: Bottom-Up Approach
Figure 3 Market Size Estimation Methodology: Top-Down Approach
Figure 4 Data Triangulation
Figure 5 Safety Valve Market Size (2015–2024)
Figure 6 1’’ to 6” to Hold Largest Size of Safety Valve Market By 2024
Figure 7 Safety Valve Market, By Material (2019 vs 2024): Steel Segment to Hold Largest Market in 2019 and 2024
Figure 8 Oil & Gas to Dominate Safety Valve Market During Forecast Period
Figure 9 APAC Held Largest Share of Safety Valve Market in 2018
Figure 10 Increasing Demand for Safety Valve in APAC Drives Market Growth
Figure 11 Cryogenic Safety Valve Market to Grow at Higher CAGR During Forecast Period
Figure 12 Energy & Power to Hold Largest Share of Saftey Valve Market in APAC in 2024
Figure 13 US to Hold Largest Share of Safety Valve Market in 2019
Figure 14 Market Dynamics of Safety Valve
Figure 15 Value Chain Analysis: Major Value Added During Raw Material and Component Suppliers, and Original Equipment Manufacturers Phases
Figure 16 Safety Valve Market, By Material
Figure 17 Steel to Hold Largest Size of Market By 2024
Figure 18 Safety Valve Market, By Size
Figure 19 1’’ to 6’’ Valves to Hold Largest Size of Market By 2024
Figure 20 Safety Valve Market, By Industry
Figure 21 Oil & Gas to Hold Largest Size of Market By 2024
Figure 22 APAC to Hold Largest Size of Market for Chemicals By 2024
Figure 23 APAC to Dominate Safety Valve Market for Building & Construction By 2024
Figure 24 APAC to Dominate Safety Valve Market for Metal & Mining By 2024
Figure 25 China to Hold Largest Size of Safety Valve Market in APAC for Metal & Mining By 2024
Figure 26 Geographic Snapshot (2019–2024): Safety Valve Market to Witness Significant Growth in APAC Countries During Forecast Period
Figure 27 North America: Safety Valve Market Snapshot
Figure 28 Europe: Safety Valve Market Snapshot
Figure 29 APAC: Safety Valve Market Snapshot
Figure 30 Organic and Inorganic Strategies Adopted By Companies Operating in Safety Valve Market
Figure 31 Major Safety Valve Manufacturers
Figure 32 Safety Valves Market (Global) Competitive Leadership Mapping, 2018
Figure 33 Emerson: Company Snapshot
Figure 34 Weir Group: Company Snapshot
Figure 35 Curtiss-Wright Corporation: Company Snapshot
Figure 36 Schlumberger: Company Snapshot
Figure 37 Robert Bosch GmbH: Company Snapshot
Figure 38 Baker Hughes: Company Snapshot
Figure 39 IMI PLC: Company Snapshot
Figure 40 Alfa Laval: Company Snapshot
The study involved 4 major activities to estimate the current market size for safety valve. Exhaustive secondary research was done to collect information on the market and its peer and parent markets. The next step was to validate these findings, assumptions, and sizing with industry experts across value chain through primary research. Both top-down and bottom-up approaches were employed to estimate the complete market size. Thereafter, market breakdown and data triangulation were employed to estimate the market size of segments and subsegments.
Secondary Research
In the secondary research process, various secondary sources have been referred to for identifying and collecting information important for this study. These secondary sources include valve magazines, valve association data, IEEE journals; annual reports, press releases, and investor presentations of companies; white papers; certified publications and articles from recognized authors; and directories and databases such as Factiva, Hoovers, and OneSource.
Primary Research
In the primary research process, various primary sources from both supply and demand sides have been interviewed to obtain qualitative and quantitative information important for this report. The primary sources from the supply side included industry experts such as CEOs, VPs, marketing directors, technology and innovation directors, and related executives from key companies and organizations operating in the safety valves market. After complete market engineering (including calculations regarding market statistics, market breakdown, market size estimations, market forecasting, and data triangulation), extensive primary research was conducted to gather information, as well as verify and validate the critical numbers arrived at.
To know about the assumptions considered for the study, download the pdf brochure
Market Size Estimation
In the complete market engineering process, both top-down and bottom-up approaches have been implemented, along with several data triangulation methods, to estimate and validate the size of the safety valves market and other dependent submarkets listed in this report.
- Key players in the industry and markets have been identified through extensive secondary research.
- In terms of value, the industry’s supply chain and market size have been determined through primary and secondary research processes.
- All percentage shares, splits, and breakdowns have been determined using secondary sources and verified through primary sources.
Data Triangulation
After arriving at the overall market size from the estimation process explained above, the overall market has been split into several segments and subsegments. To complete the overall market engineering process and arrive at the exact statistics for all segments and subsegments, market breakdown and data triangulation procedures have been employed wherever applicable. The data have been triangulated by studying various factors and trends identified from both demand and supply sides in industrial and nonindustrial verticals.
Report Objectives
The following are the major objectives of the study.
- To describe and forecast the overall safety valve market, in terms of value, by material, size, and industry
- To describe and forecast the market, in terms of value, by region—North America, Europe, Asia Pacific (APAC), and Rest of the World (RoW)
- To provide detailed information regarding major factors influencing market growth (drivers, restraints, opportunities, and challenges)
- To strategically analyze micromarkets1 with respect to individual growth trends, prospects, and contributions to the overall market
- To strategically profile key players and comprehensively analyze their market position in terms of ranking and core competencies,2 along with detailing competitive landscape for market leaders
- To benchmark players in the market using proprietary competitive leadership mapping, which analyzes market players on various parameters within broad categories of business and product strategies
- To analyze competitive developments such as joint ventures, mergers & acquisitions, and product launches, along with research and development (R&D) in the market
Available Customizations
With the given market data, MarketsandMarkets offers customizations according to a company’s specific needs. The following customization options are available for the report:
Company Information:
- Detailed analysis and profiling of additional market players (up to 5)


Growth opportunities and latent adjacency in Safety Valves Market