Service Delivery Platform (SDP) Market [Converged Services; Policy Management; Subscriber Data Management (SDM); Telecom Application Server; Service Creation Environment; Orchestration Environment] - Worldwide Forecasts and Analysis (2013 � 2018)


[189 Pages Report] The global Service Delivery Platforms market in 2013 is estimated to be worth $4.48 billion, and expected to grow to $6.94 billion by 2018, at a CAGR of 9.15% from 2013 to 2018. In the current telecom industry, stiff competition has resulted in a decrease in profit margins for service providers. To counter this, service providers are constantly developing innovative business models. Also, the immense popularity of web apps by web based application providers, such as Google and Yahoo, has fuelled the growth of SDP implementation by the MNO�s for rolling out their own app stores.
In the recent years, Service Delivery Platform have quickly gained popularity as a middle ground platform, which enables an optimized exchange of services between telecom network operators, service providers, content providers and users. SDP enables operators to rapidly develop personalized service offerings and launch them quickly in the market. Ease of delivery of such service offerings, across different network elements, reduction in complexity in the deployment of service offerings, simplification of services management and administration, and other such benefits are provided by SDP to telecom operators. SDP can also serve as a bridge between the current systems and next generation network frameworks, which include an IP multimedia sub-system.
The Service Delivery Platform market report provides a detailed insight into the regional and worldwide vendor market share for fixed and wireless service delivery platform software and services. This report also provides a comprehensive analysis of the leading suppliers and their strategic direction, spread across different geographical regions. LA and MEA regions are the emerging markets, while Asia Pacific is considered the high growth market. This report deals with the market trends in the Service Delivery Platform market and the growth associated with it. It analyzes various factors that will drive and restrain the market over the next five years.
Scope of the Report
This research report categorizes the global market for Service Delivery Platform for forecasting the revenues and analyzing the trends in each of the sub-markets as follows:
On the basis of Service Delivery platform by software and services:
- Software
- Services
The services segment is further classified by the types of services
- Consulting
- Integration
On the basis of Sub segments:
- Telecom application servers
- Mobile Content management and delivery
- Policy management
- Subscriber data management
On the basis of Telecom service sectors:
- Mobile
- PSTN
- Business Data Services
- Residential Broadband
On the basis of Geographies:
- North America (NA)
- Europe (EU)
- Asia-Pacific, incl. Japan (APAC)
- Latin America (LA)
- Middle-East Africa (MEA)
Each section provides market data, market dynamics (drivers, restraints, trends and opportunities), key players and competitive outlook.
Service Delivery Platforms have been in the market for a period of close to eight years and it is gaining popularity in the telecom industry. The concept was proven successful by the early implementers. Now, the focus is on consolidating the lessons learned from previous SDP implementations and benefits realization. The idea is to use this intelligence to gain an advantage in the industry, by early adoption of next generation SDP products. The next generation SDP products have become easier to plug and play, mainly because they use the concepts of web services interface and Service Oriented Architecture (SOA).
The service orchestration components are gaining limelight as key technology for coordinating and clustering components within the SDP, as well as the application services that lie in the application layer of the SDP. As the market enters a critical phase in its development, there has been a rising trend seen in SDP activities. IP multimedia system and IMS service convergence are going to be significant influencing factors on the next round of Service Delivery Platform implementations. The SDP vendors are reengineering their products to incorporate these features. In spite of all the momentum in the SDP market, still there are a few challenges that SDP has to overcome. There is a lack of clarity in translating the general concepts represented by SDP into real world deployments. The SDP vendors are not making an effort to bring in this clarity. There is an absence of a standard SDP reference model in the industry, which creates a fear of vendor lock-in among telecom operators.
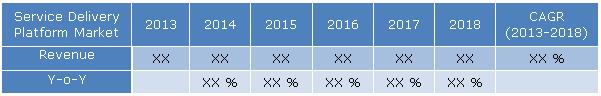
In this report, the global Service Delivery Platform market has been segmented to understand and estimate market opportunities in its sub segments, SDP software and service, Telecom service sectors, as well as its revenue across different regions. Among the telecom service sectors, mobile network services capture the major share followed by a Business Data Services segment from 2013 to 2018. Among the sub-segments, mobile data content captures a major share of the market. The policy management sub-segment of the SDP market is expected to grow quickly at a CAGR of 9.23%. Among the geographical markets, the Asia- Pacific market captures a significant portion and has attractive growth prospects, because of a huge number of potential users for diversified and personalized service offerings. These offerings are available in countries such as China, India, Japan and South Korea. MarketsandMarkets expects the global Service Delivery Platform market to grow from $4.48 billion in 2013 to $6.94 billion in 2018. This represents a compounded annual growth rate (CAGR) of 9.15% from 2013 to 2018. The table given below highlights the overall market opportunity, in terms of absolute dollar value and year-on-year (Y-O-Y) growth.
Global Service Delivery Paltform Market, By Revenue 2013 � 2018 ($Billion)
Source: MarketsandMarkets Analysis
 Exclusive indicates content/data unique to MarketsandMarkets and not available with any competitors.
Table Of Contents
1 Introduction (Page No. - 19)
1.1 Key Take-Aways
1.2 Report Description
1.3 Markets Covered
1.4 Stakeholders
1.5 Forecast Assumptions
1.6 Research Methodology
2 Executive Summary (Page No. - 24)
3 Service Delivery Platform Market Overview (Page No. - 26)
3.1 Market Definition
3.2 Evolution Of Sdp
3.3 Need And Benefits Of Sdp
3.4 Market Segmentation
3.5 Overall Market Size
3.6 Market Dynamics
3.6.1 Drivers
3.6.1.1 Intense Competition In The Telecom Industry
3.6.1.2 Growth In Demand For Data And Content Related Services
3.6.1.3 Increasing Complexity Of The Service Layer
3.6.1.4 Rapid Increase In Wireless Deployments And Convergence Of Wireless And Wire Line Services
3.6.1.5 Success Of Csp Application Stores
3.6.2 Restraints/Challenges
3.6.2.1 Lack Of A Standard Sdp Reference Model
3.6.2.2 High Initial Investment Cost
3.6.2.3 Challenges In Vendor Evaluation And Fear Of Vendor Lock In
3.6.2.4 Security And Performance Concerns
3.6.3 Opportunities
3.6.3.1 Reduction In Cost Of Services Development
3.6.3.2 Lesser Time To Market For New Service Offerings
3.6.3.3 Reduction In Risks Associated With Launching Unproven Service Offerings
3.6.4 Impact Analysis Of Dros
3.7 Sdp Architecture And Components
3.8 Service Delivery Platform Ecosystem
3.9 Trends In The Sdp Market Space
4 Service Delivery Platform Market Size And Forecast, By Software And Services (Page No. - 43)
4.1 Overview
4.2 By Software
4.2.1 Overview
4.2.2 Market Size And Forecast
4.3 By Services
4.3.1 Introduction
4.3.2 By Consulting
4.3.2.1 Overview
4.3.2.2 Market Size And Forecast
4.3.3 By Integration Services
4.3.3.1 Overview
4.3.3.2 Market Size And Forecast
5 Service Delivery Platform Market Size And Forecast, By Sub-Segments (Page No. - 62)
5.1 Overview
5.2 Telecom Applications Server
5.2.1 Overview
5.2.2 Market Size And Forecast
5.3 Mobile Content Management And Delivery
5.3.1 Overview
5.3.2 Market Size And Forecast
5.4 Policy Management
5.4.1 Overview
5.4.2 Market Size And Forecast
5.5 Subscriber Data Management (Sdm)
5.5.1 Overview
5.5.2 Market Size And Forecast
6 Service Delivery Platform Market Size And Forecast, By Telecom Service Sectors (Page No. - 85)
6.1 Overview
6.2 Mobile
6.2.1 Overview
6.2.2 Market Size And Forecast
6.3 Pstn
6.3.1 Overview
6.3.2 Market Size And Forecast
6.4 Business Data Services
6.4.1 Overview
6.4.2 Market Size And Forecast
6.5 Residential Broadband
6.5.1 Overview
6.5.2 Market Size And Forecast
7 SDP Market Size And Forecast, By Regions (Page No. - 106)
7.1 Overview
7.2 North America
7.2.1 Overview
7.2.2 Market Size And Forecast By Software And Services
7.2.3 Market Size And Forecast By Sub Segments
7.2.4 Market Size And Forecast By Telecom Service Sectors
7.3 Europe
7.3.1 Overview
7.3.2 Market Size And Forecast By Software And Services
7.3.3 Market Size And Forecast By Sub Segments
7.3.4 Market Size And Forecast By Telecom Service Sectors
7.4 Asia-Pacific Incl. Japan (Apac)
7.4.1 Overview
7.4.2 Market Size And Forecast By Software And Services
7.4.3 Market Size And Forecast By Sub Segments
7.4.4 Market Size And Forecast By Telecom Service Sectors
7.5 Middle East And Africa (Mea)
7.5.1 Overview
7.5.2 Market Size And Forecast By Software And Services
7.5.3 Market Size And Forecast By Sub Segments
7.5.4 Market Size And Forecast By Telecom Service Sectors
7.6 Latin America (La)
7.6.1 Overview
7.6.2 Market Size And Forecast By Software And Services
7.6.3 Market Size And Forecast By Sub Segments
7.6.4 Market Size And Forecast By Telecom Service Sectors
8 Competitive Landscape (Page No. - 159)
8.1 Introduction
8.2 Mergers And Acquisitions
8.3 Comparison Of Vendor Capabilities
9 Company Profiles (Overview, Products & Services, & Strategy And Analyst Insights)* (Page No. - 162)
9.1 Accenture
9.2 Aepona
9.3 Alcatel - Lucent
9.4 Amdocs
9.5 Ericsson
9.6 Hewlett - Packard
9.7 Huawei
9.8 Ibm
9.9 Microsoft
9.10 Nokia Siemens Network
9.11 Opencloud
9.12 Oracle
9.13 Telenity
*Details On Overview, Products & Services, Strategy And Analyst Insights Might Not Be Captured In Case Of Unlisted Companies.
List Of Tables (83 Tables)
Table 1 Forecast Assumptions
Table 2 Service Delivery Platform Market Revenue, 2013 � 2018 ($Billion)
Table 3 Service Delivery Platform Market Revenue, 2013 � 2018 ($Billion)
Table 4 Impact Analysis Of Dros
Table 5 Sdp Market Revenue By Software And Services, 2013 � 2018 ($Billion)
Table 6 Sdp Market Revenue By Software And Services, 2013 � 2018, Y-O-Y (%)
Table 7 Service Delivery Platform Market Revenue By Software, 2013 � 2018 ($Billion)
Table 8 Sdp Market Revenue, From Software, By Geographies, 2013 � 2018 ($Billion)
Table 9 Sdp Market Y-O-Y (%), From Software, By Geographies, 2013 � 2018
Table 10 Sdp Market Revenue By Services, 2013 � 2018 ($Billion)
Table 11 Sdp Market Revenue By Services, 2013 � 2018, Y-O-Y (%)
Table 12 Sdp Market Revenue, By Consulting, 2013 � 2018 ($Billion)
Table 13 Service Delivery Platform Market Revenue, From Consulting, By Geographies,2013 � 2018 ($Billion)
Table 14 Sdp Market Revenue From Consulting Market Y-O-Y (%), By Geographies, 2013 � 2018
Table 15 Sdp Market Revenue, By Integration, 2013 � 2018 ($Billion)
Table 16 Sdp Market Revenue, From Integration, By Geographies, 2013 � 2018 ($Billion)
Table 17 Sdp Market Y-O-Y (%), From Integration, By Geographies, 2013 � 2018
Table 18 Sdp Market Revenue By Sub Segments, 2013 � 2018 ($ Billion)
Table 19 Sdp Market Revenue By Sub Segments, 2013 � 2018, Y-O-Y (%)
Table 20 Sdp Market Revenue, By Telecom Applications Server, 2013 � 2018 ($Billion)
Table 21 Service Delivery Platform Market Revenue, From Telecom Application Server, By Geographies, 2013 � 2018 ($Billion)
Table 22 Sdp Market Y-O-Y (%), From Telecom Application Server, By Geographies, 2013 � 2018
Table 23 Sdp Market Revenue, By Mobile Content Management And Delivery, 2013 � 2018 ($Billion)
Table 24 Sdp Market Revenue, From Mobile Content Management And Delivery, By Geographies, 2013 � 2018 ($Billion)
Table 25 Sdp Market Y-O-Y (%), From Mobile Content Management And Delivery, By Geographies, 2013 � 2018
Table 26 Service Delivery Platform Market Revenue, By Policy Management, 2013 � 2018 ($Billion)
Table 27 Sdp Market Revenue, From Policy Management, By Geographies, 2013 � 2018 ($Billion)
Table 28 Service Delivery Platform Market Y-O-Y (%), From Policy Management, By Geographies, 2013 � 2018
Table 29 Sdp Market Revenue, By Subscriber Data Management, 2013 � 2018 ($Billion)
Table 30 Sdp Market Revenue, From Subscriber Data Management, By Geographies, 2013 � 2018 ($Billion)
Table 31 Sdp Market Y-O-Y (%), From Subscriber Data Management, By Geographies, 2013 � 2018
Table 32 Sdp Market Revenue By Telecom Service Providers, 2013 � 2018 ($Billion)
Table 33 Sdp Market Revenue By Telecom Service Providers, 2013 � 2018, Y-O-Y (%)
Table 34 Sdp Market Revenue, By Mobile, 2013 � 2018 ($Billion)
Table 35 Sdp Market Revenue, From Mobile, By Geographies, 2013 � 2018 ($Billion)
Table 36 Sdp Market Y-O-Y (%), From Mobile, By Geographies, 2013 � 2018
Table 37 Sdp Market Revenue, By Pstn, 2013 � 2018 ($Billion)
Table 38 Sdp Market Revenue, From Pstn, By Geographies, 2013 � 2018 ($Billion)
Table 39 Sdp Market Y-O-Y (%), From Pstn, By Geographies, 2013 � 2018
Table 40 Sdp Market Revenue, By Business Data Services, 2013 � 2018 ($Billion)
Table 41 Sdp Market Revenue, From Business Data Services, By Geographies, 2013 � 2018 ($Billion)
Table 42 Sdp Market Y-O-Y (%), From Business Data Services, By Geographies, 2013 � 2018
Table 43 Sdp Market Revenue, By Residential Broadband, 2013 � 2018 ($Billion)
Table 44 Sdp Market Revenue, From Residential Broadband, By Geographies, 2013 � 2018 ($Billion)
Table 45 Sdp Market Y-O-Y (%), From Residential Broadband, By Geographies, 2013 � 2018
Table 46 Sdp Market Revenues, By Geographies, 2013 � 2018 ($Billion)
Table 47 Sdp Market Revenues By Geographies, 2013 � 2018, Y-O-Y (%)
Table 48 Service Delivery Platform Market Revenue, By North America, 2013 � 2018 ($Billion)
Table 49 Sdp Market Revenue, By Software And Services, By North America, 2013 � 2018 ($Billion)
Table 50 Sdp Market Revenue, By Software And Services, By North America, 2013 � 2018, Y-O-Y (%)
Table 51 Sdp Market Revenue, By Sub Segments, By North America, 2013 � 2018 ($Billion)
Table 52 Sdp Market Revenue, By Sub Segments, By North America, 2013 � 2018, Y-O-Y (%)
Table 53 Sdp Market Revenue By Telecom Service Sectors, By North America, 2013 � 2018 ($Billion)
Table 54 Sdp Market Revenue, By Telecom Service Sectors, By North America, 2013 � 2018, Y-O-Y (%)
Table 55 Sdp Market Revenue, By North America, 2013 � 2018 ($Billion)
Table 56 Sdp Market Revenue, By Software And Services, Europe, 2013 � 2018 ($Billion)
Table 57 Sdp Market Revenue, By Software And Services, Europe, 2013 � 2018, Y-O-Y (%)
Table 58 Sdp Market Revenue, By Sub Segments, In Europe, 2013 � 2018 ($Billion)
Table 59 Service Delivery Platform Market Revenue, By Sub Segments, Europe, 2013 � 2018, Y-O-Y (%)
Table 60 Sdp Market Revenue, By Telecom Service Sectors, By Europe, 2013 � 2018 ($Billion)
Table 61 Sdp Market Revenue, By Telecom Service Sectors, Europe, 2013 � 2018, Y-O-Y (%)
Table 62 Sdp Market Revenue, By Apac, 2013 � 2018 ($Billion)
Table 63 Sdp Market Revenue, By Software And Services, By Apac, 2013 � 2018 ($Billion)
Table 64 Sdp Market Revenue, By Software And Services, By Apac, 2013 � 2018, Y-O-Y (%)
Table 65 Sdp Market Revenue, By Sub Segments, By Apac, 2013 � 2018 ($Billion)
Table 66 Service Delivery Platform Market Revenue, By Sub Segments, By Apac, 2013 � 2018, Y-O-Y (%)
Table 67 Sdp Market Revenue, By Telecom Service Sectors, By Apac, 2013 � 2018 ($Billion)
Table 68 Sdp Market Revenue, By Telecom Service Sectors, By Apac, 2013 � 2018, Y-O-Y (%)
Table 69 Sdp Market Revenue, By Mea, 2013 � 2018 ($Billion)
Table 70 Sdp Market Revenue, By Software And Services, By Mea, 2013 � 2018 ($Billion)
Table 71 Sdp Market Revenue, By Software And Services, By Mea, 2013 � 2018, Y-O-Y (%)
Table 72 Sdp Market Revenue, By Sub Segments, By Mea, 2013 � 2018 ($Billion)
Table 73 Service Delivery Platform Market Revenue, By Sub Segments, By Mea, 2013 � 2018, Y-O-Y (%)
Table 74 Sdp Market Revenue, By Telecom Service Sectors, By Mea, 2013 � 2018 ($Billion)
Table 75 Sdp Market Revenue, By Telecom Service Sectors, By Mea, 2013 � 2018, Y-O-Y (%)
Table 76 Sdp Market Revenue, By La, 2013 � 2018 ($Billion)
Table 77 Sdp Market Revenue By Software And Services, By La, 2013 � 2018 ($Billion)
Table 78 Sdp Market Revenue, By Software And Services, By La, 2013 � 2018, Y-O-Y (%)
Table 79 Sdp Market Revenue, By Sub Segments, By La, 2013 � 2018 ($Billion)
Table 80 Sdp Market Revenue, By Sub Segments, By La, 2013 � 2018, Y-O-Y (%)
Table 81 Sdp Market Revenue, By Telecom Service Sectors, By La, 2013 � 2018 ($Billion)
Table 82 Sdp Market Revenue, By Telecom Service Sectors, By La, 2013 � 2018, Y-O-Y (%)
Table 83 Mergers And Acquisitions
List Of Figures (84 Figures)
Figure 1 Services Delivered By Sdp
Figure 2 Market Segmentation
Figure 3 Service Delivery Platform Market Revenue Vs Y-O-Y, 2013 � 2018
Figure 4 Service Delivery Model Layers
Figure 5 Sdp Architecture And Components
Figure 6 Sdp Market Ecosystem
Figure 7 Sdp Market Revenue By Software And Services, 2013 � 2018 ($Billion)
Figure 8 Sdp Market By Software And Services, 2013 � 2018, Y-O-Y (%)
Figure 9 Sdp Market Revenue Vs Y-O-Y, By Software, 2013 � 2018
Figure 10 Sdp Market Revenue, From Software, By Geographies,2013 � 2018 ($Billion)
Figure 11 Sdp Market Y-O-Y (%), From Software, By Geographies, 2013 � 2018
Figure 12 Sdp Market Revenue Vs Y-O-Y, By Software, 2013 � 2018
Figure 13 Sdp Market Revenue Vs Y-O-Y, By Software, 2013 � 2018
Figure 14 Sdp Market Revenue Vs Y-O-Y, By Consulting, 2013 � 2018
Figure 15 Sdp Market Revenue, From Consulting, By Geographies,2013 � 2018 ($Billion)
Figure 16 Service Delivery Platform Market Revenue From Consulting Market Y-O-Y (%), By Geographies, 2013 � 2018
Figure 17 Sdp Market Revenue Vs Y-O-Y, By Integration, 2013 � 2018
Figure 18 Sdp Market Revenue, From Integration, By Geographies, 2013 � 2018 ($Billion)
Figure 19 Sdp Market Y-O-Y (%), From Integration, By Geographies,2013 � 2018
Figure 20 Sdp Market Revenue, By Sub Segments, 2013 � 2018 ($Billion)
Figure 21 Sdp Market By Sub Segments, 2013 � 2018 Y-O-Y (%)
Figure 22 Sdp Market Revenue Vs Y-O-Y, By Telecom Application Server, 2013 � 2018
Figure 23 Sdp Market Revenue, From Telecom Application Server, By Geographies, 2013 � 2018 ($Billion)
Figure 24 Sdp Market Y-O-Y (%), From Telecom Application Server, By Geographies, 2013 � 2018
Figure 25 Sdp Market Revenue Vs Y-O-Y, By Mobile Content Management And Delivery, 2013 � 2018
Figure 26 Sdp Market Revenue, From Mobile Content Management And Delivery, By Geographies, 2013 � 2018 ($Billion)
Figure 27 Sdp Market Y-O-Y (%), From Mobile Content Management And Delivery, By Geographies, 2013 � 2018
Figure 28 Service Delivery Platform Market Revenue Vs Y-O-Y, Policy Management, 2013 � 2018
Figure 29 Sdp Market Revenue, From Policy Management, By Geographies, 2013 � 2018 ($Billion)
Figure 30 Sdp Market Y-O-Y (%), From Policy Management, By Geographies, 2013 � 2018
Figure 31 Sdp Market Revenue Vs Y-O-Y, Subscriber Data Management, 2013 � 2018
Figure 32 Sdp Market Revenue, From Subscriber Data Management, By Geographies, 2013 � 2018 ($Billion)
Figure 33 Sdp Market Y-O-Y (%), From Subscriber Data Management, By Geographies, 2013 � 2018
Figure 34 Sdp Market Revenue, By Telecom Service Providers, 2013 � 2018 ($Billion)
Figure 35 Sdp Market, By Telecom Service Providers, 2013 � 2018, Y-O-Y (%)
Figure 36 Sdp Market Revenue Vs Y-O-Y, By Mobile, 2013 � 2018
Figure 37 Sdp Market Revenue, From Mobile, By Geographies, 2013 � 2018 ($Billion)
Figure 38 Sdp Market Y-O-Y (%), From Mobile, By Geographies, 2013 � 2018
Figure 39 Sdp Market Revenue Vs Y-O-Y, By Pstn, 2013 � 2018
Figure 40 Sdp Market Revenue, From Pstn, By Geographies, 2013 � 2018 ($Billion)
Figure 41 Sdp Market Y-O-Y (%), From Pstn, By Geographies, 2013 � 2018
Figure 42 Sdp Market Revenue Vs Y-O-Y, By Business Data Services, 2013 � 2018
Figure 43 Sdp Market Revenue, From Business Data Services, By Geographies, 2013 � 2018 ($Billion)
Figure 44 Sdp Market Y-O-Y (%), From Business Data Services, By Geographies, 2013 � 2018
Figure 45 Sdp Market Revenue Vs Y-O-Y, By Residential Broadband, 2013 � 2018
Figure 46 Sdp Market Revenue, From Residential Broadband, By Geographies, 2013 � 2018 ($Billion)
Figure 47 Sdp Market Y-O-Y (%), From Residential Broadband, By Geographies, 2013 � 2018
Figure 48 Sdp Market Revenues, By Geographies, 2013 � 2018
Figure 49 Sdp Market By Software And Services, 2013 � 2018, Y-O-Y (%)
Figure 50 Sdp Market Revenue Vs Y-O-Y, By North America, 2013 � 2018
Figure 51 Sdp Market Revenue, By Software And Services, By North America, 2013 � 2018
Figure 52 Service Delivery Platform Market Revenue, By Software And Services, By North America, 2013 � 2018, Y-O-Y (%)
Figure 53 Sdp Market Revenue, By Sub Segments, By North America, 2013 � 2018
Figure 54 Sdp Market Revenue, By Sub Segments, By North America, 2013 � 2018, Y-O-Y (%)
Figure 55 Service Delivery Platform Market Revenue, By Telecom Service Sectors, By North America, 2013 � 2018
Figure 56 Sdp Market Revenue, By Telecom Service Sectors, By North America, 2013 � 2018, Y-O-Y (%)
Figure 57 Sdp Market Revenue Vs Y-O-Y, By Europe, 2013 � 2018
Figure 58 Sdp Market Revenue, By Types, Europe, 2013 � 2018
Figure 59 Sdp Market Revenue, By Software And Services, In Europe, 2013 � 2018, Y-O-Y (%)
Figure 60 Sdp Market Revenue, By Sub Segments, Europe, 2013 � 2018
Figure 61 Sdp Market Revenue, By Sub Segments, Europe, 2013 � 2018, Y-O-Y (%)
Figure 62 Service Delivery Platform Market Revenue, By Telecom Service Sectors, Europe, 2013 � 2018
Figure 63 Sdp Market Revenue, By Telecom Service Sectors, Europe, 2013 � 2018, Y-O-Y (%)
Figure 64 Sdp Market Revenue Vs Y-O-Y, By Apac, 2013 � 2018
Figure 65 Service Delivery Platform Market Revenue, By Types, By Apac, 2013 � 2018
Figure 66 Sdp Market Revenue, By Software And Services, By Apac, 2013 � 2018, Y-O-Y (%)
Figure 67 Sdp Market Revenue, By Sub Segments, By Apac, 2013 � 2018
Figure 68 Sdp Market Revenue, By Sub Segments, By Apac, 2013 � 2018, Y-O-Y (%)
Figure 69 Service Delivery Platform Market Revenue, By Telecom Service Sectors, By Apac, 2013 � 2018
Figure 70 Sdp Market Revenue, By Telecom Service Sectors, By Apac, 2013 � 2018, Y-O-Y (%)
Figure 71 Sdp Market Revenue Vs Y-O-Y, By Mea, 2013 � 2018
Figure 72 Sdp Market Revenue, By Types, By Mea, 2013 � 2018
Figure 73 Sdp Market Revenue, By Software And Services, By Mea,2013 � 2018, Y-O-Y (%)
Figure 74 Sdp Market Revenue, By Sub Segments, By Mea, 2013 � 2018
Figure 75 Sdp Market Revenue, By Sub Segments, By Mea, 2013 � 2018, Y-O-Y (%)
Figure 76 Sdp Market Revenue, By Telecom Service Sectors, By Mea, 2013 � 2018
Figure 77 Sdp Market Revenue, By Telecom Service Sectors, By Mea, 2013 � 2018, Y-O-Y (%)
Figure 78 Sdp Market Revenue Vs Y-O-Y, By La, 2013 � 2018
Figure 79 Sdp Market Revenue, By Types, By La, 2013 � 2018
Figure 80 Service Delivery Platform Market Revenue, By Software And Services, By La, 2013 � 2018, Y-O-Y (%)
Figure 81 Sdp Market Revenue, By Sub Segments, By La, 2013 � 2018
Figure 82 Sdp Market Revenue, By Sub Segments, By La, 2013 � 2018, Y-O-Y (%)
Figure 83 Sdp Market Revenue, By Telecom Service Sectors, By La, 2013 � 2018
Figure 84 Sdp Market Revenue, By Telecom Service Sectors, By La, 2013 � 2018, Y-O-Y (%)
Figure 85 Sdp Market Share By Revenue
Figure 86 Service Capabilities For Telecom Service Sectors


Growth opportunities and latent adjacency in Service Delivery Platform (SDP) Market
Gather insight into size of servers in telecom market