Service Virtualization Market by Component (Software/Tools and Services), Deployment Type (On-Premises and Cloud), Service Type (Managed Services and Professional Services ), Verticals, and Regions - Global Forecast to 2022


[130 Pages Report] The service virtualization market is projected to grow from USD 385.5 Million in 2016 to USD 1,040.8 Million by 2022, at an estimated Compound Annual Growth Rate (CAGR) of 18.50%. The forecast period has been considered from 2017 to 2022, while 2016 is considered as the base year for estimating the market study.
Objectives of the Study:
The main objective of this report is to define, describe, and forecast the service virtualization market on the basis of segments, which include component, deployment type, vertical, and region. The report provides detailed information regarding the major factors influencing the growth of the market (drivers, restraints, opportunities, and industry-specific challenges). The report forecasts the market size with respect to the 5 main regions, namely, North America, Europe, Asia Pacific (APAC), Middle East and Africa (MEA), and Latin America. The report profiles key players and comprehensively analyzes their core competencies. This report also tracks and analyzes the competitive developments, such as mergers and acquisitions, new product developments, and Research and Development (R&D) activities, in the market.
The research methodology used to estimate and forecast the service virtualization market begins with the collection and analysis of data on key vendor product offerings and business strategies from secondary sources, such as D&B Hoovers, 10K Wizard, Bloomberg, Thomson StreetEvents, Factiva, IT service providers, technology providers, press releases, investor presentations of companies, white papers, technology journals, certified publications, and articles from recognized authors, directories, and databases. The vendor offerings have also been taken into consideration to determine the market segmentation. The bottom-up procedure was employed to arrive at the total market size of the service virtualization market from the revenue of the key market software tool providers and service providers. After arriving at the overall market size, the total market was split into several segments and subsegments, which were then verified through primary research by conducting extensive interviews with key people, such as Chief Executive Officers (CEOs), Vice Presidents (VPs), directors, and executives.
To know about the assumptions considered for the study, download the pdf brochure
Industry Ecosystem
The service virtualization ecosystem comprises vendors such as CA Technologies (US), IBM (US), Micro Focus (Formerly HPE) (US), SmartBear Software (US), Parasoft (US), Tricentis (Austria), Cavisson Systems (US), Cigniti (India), Cognizant (US), Wipro (India), Sogeti (France), SQS (Germany), Maveric Systems (India), Prolifics (US), Axway (US), Crosscheck Networks (US), Delphix (US), Postdot Technologies (US), WireMock (UK), Solution-Soft Systems (US), Planit Testing (Australia), Tobania (Belgium), Tech Mahindra (India), ITC Infotech (India), and Capgemini (France). These Service Virtualization Software Vendors are rated and listed by us on the basis of product quality, reliability, and their business strategy. Please visit 360Quadrants to see the vendor listing of Service Virtualization Software.
Key Target Audience
- Providers of service virtualization tools
- Providers of service virtualization services
- Software testing providers
- QA providers
- Communication service providers
- Managed service providers
- Third-party system integrators
Scope of the Service Virtualization Market Report
The research report categorizes the service virtualization market to forecast the revenues and analyze the trends in each of the following submarkets:
By Component
- Software/Tools
- Services
By Deployment Type
- On-premises
- Cloud
By Vertical
- IT Services
- Telecommunication
- BFSI
- Retail and eCommerce
- Media and Entertainment
- Healthcare
- Automotive
- Others*
By Region
- North America
- Europe
- MEA
- APAC
- Latin America
Available Customizations
With the given market data, MarketsandMarkets offers customizations as per the company�s specific needs. The following customization options are available for the report:
Product Analysis
- Product matrix that gives a detailed comparison of the product portfolio of each company
Geographic Analysis
- Further breakdown of the North American service virtualization market into countries
- Further breakdown of the European market into countries
- Further breakdown of the APAC market into countries
- Further breakdown of the MEA market into countries
- Further breakdown of the Latin American market into countries
Company Information
- Detailed analysis and profiling of additional market players
The service virtualization market is projected to grow from USD 445.5 Million in 2017 to USD 1,040.8 Million by 2022, at an estimated Compound Annual Growth Rate (CAGR) of 18.50% during the forecast period. Several factors such as enhanced quality of test conditions, leveraging of data integration, accelerated time to market, and increased ROI are driving the market. The increased adoption of service virtualization solutions and services are carried out by several industry verticals, such as BFSI, IT services, telecommunications, and retail and e-commerce, have boosted the growth of the market.
The global service virtualization market is segmented by component (software/tools and services), deployment type (on-premises and cloud), vertical, and region. The services component is expected to grow at a higher CAGR during the forecast period because services help organizations in easily deploying the software either on-premises or on-cloud.
The cloud deployment type is expected to grow at the highest CAGR during the forecast period. Enterprises from all verticals and of all sizes are moving from the on-premises to the cloud deployment type, as cloud deployment reduces the overall costs, provides flexibility with advanced technology, offers scalable access to solutions, ensures enforcement of security compliances, and enhances business efficiency. A major advantage of the cloud deployment type is that it provides real-time information from a remote location. Cloud-based testing platforms offer the testing teams with the ability to spin-up self-service test environments, on demand. Due to the ease of deployment, reduced cost of ownership, and improved services, Service Virtualization-as-a-Service (SVaaS) is considered as a viable testing model by many organizations. As a subscription-based service, SVaaS provides automated testing on the cloud. With Testing-as-a-Service (TaaS), companies can instantly start, scale-up, or geographically distribute their testing to accomplish more in less time, and align testing schedules with the agile and DevOps continuous delivery models. Due to the above-mentioned advantages, most of the vendors are switching from the on-premises deployment type to the cloud deployment type.
The digitalization of businesses has revolutionized the application development and testing market space for various industries. To ensure competitiveness, many large-scale businesses, as well as, SMEs are leveraging the power of technology to offer the best-in-class digital solutions to their customers. These technology-enabled businesses help customers to access the services offered by them through innovative applications. Therefore, it becomes crucial for these businesses to accelerate their application development and testing cycles to reduce the time-to-market for customer satisfaction.
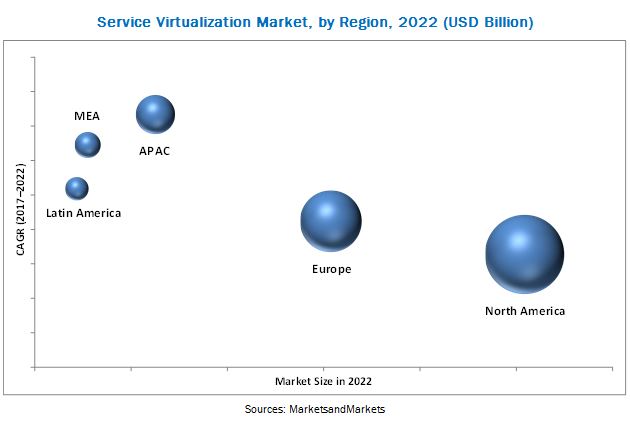
The global service virtualization market has been segmented on the basis of regions into North America, Europe, Asia Pacific (APAC), Middle East and Africa (MEA), and Latin America to provide a region-specific analysis in the report. North America is expected to have the largest market share and is projected to dominate the market during the forecast period. This North American region is rapidly adopting emerging technologies, such as smartphones and cloud platforms. Due to this, companies are willingly investing in the North American region. Most service virtualization solutions and services vendors have an eminent presence in the North American region, and therefore, the competition is stiff among the major market players.
With an increase in the demand, the cost of updating and integrating the equipment required for service virtualization also increases. However, budget constraints and evolving equipment cycle are hindering the growth of the service virtualization market.
The major vendors that offer service virtualization software and services across the globe are CA Technologies (US), IBM (US), Micro Focus (Formerly HPE) (US), SmartBear Software (US), Parasoft (US), Tricentis (Austria), Cavisson Systems (US), Cigniti (India), Cognizant (US), Wipro (India), Sogeti (France), SQS (Germany), Maveric Systems (India), Prolifics (US), Axway (US), Crosscheck Networks (US), Delphix (US), Postdot Technologies (US), WireMock (UK), Solution-Soft Systems (US), Planit Testing (Australia), Tobania (Belgium), Tech Mahindra (India), ITC Infotech (India), and Capgemini (France). These vendors have adopted various organic and inorganic growth strategies, such as new product launches, partnerships, and collaborations to enhance their position in the service virtualization market.
To speak to our analyst for a discussion on the above findings, click Speak to Analyst
 Exclusive indicates content/data unique to MarketsandMarkets and not available with any competitors.
Table of Contents
1 Introduction (Page No. - 13)
1.1 Objectives of the Study
1.2 Market Definition
1.3 Market Scope
1.4 Years Considered for the Study
1.5 Currency
1.6 Stakeholders
2 Research Methodology (Page No. - 17)
2.1 Research Data
2.2 Secondary Data
2.3 Primary Data
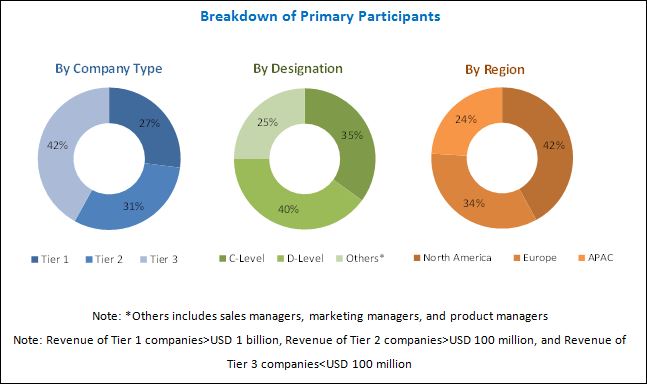
2.3.1 Breakdown of Primaries
2.3.2 Key Industry Insights
2.4 Market Size Estimation
2.5 Research Assumptions
2.6 Limitations
3 Executive Summary (Page No. - 24)
4 Premium Insights (Page No. - 28)
4.1 Attractive Market Opportunities in the Service Virtualization Market
4.2 Market Share of Top 3 Verticals and Regions, 2017
4.3 Market Regional Analysis
5 Market Overview (Page No. - 31)
5.1 Market Dynamics
5.1.1 Drivers
5.1.1.1 Enhanced Quality of Test Conditions and Increasing Need to Leverage Data Integration Tools
5.1.1.2 Increasing Adoption of Agile and Devops Practices for Software Development
5.1.1.3 Accelerated Time-To-Market
5.1.1.4 Increased RoI
5.1.2 Restraints
5.1.2.1 Data Security Regulations and Policies
5.1.3 Opportunities
5.1.3.1 Advancements in IoT, AI, and Machine Learning Technologies
5.1.3.2 Digitalization of Businesses
5.1.4 Challenges
5.1.4.1 High Cost Resulting in Low Adoption Among Smes
5.1.4.2 Data Security Concerns
5.1.4.3 Lack of Awareness
5.2 Service Virtualization Use Cases
5.2.1 Introduction
5.2.1.1 Use Case #1: Training Application Up-Time Runs at 99.99%
5.2.1.2 Use Case #2: Reduced Time to Test the Microservcies
5.2.1.3 Use Case #3: Accelerated Go-To-Market of A Certified Application
6 Service Virtualization Market Analysis, By Component (Page No. - 37)
6.1 Introduction
6.2 Software/Tools
6.3 Services
6.3.1 Services, By Type
6.3.1.1 Managed Services
6.3.1.2 Professional Services
7 Service Virtualization Market Analysis, By Deployment Type (Page No. - 43)
7.1 Introduction
7.2 On-Premises
7.3 Cloud
8 Service Virtualization Market Analysis, By Vertical (Page No. - 47)
8.1 Introduction
8.2 Banking, Financial Services, and Insurance
8.3 IT Services
8.4 Telecommunications
8.5 Media and Entertainment
8.6 Retail and Ecommerce
8.7 Healthcare
8.8 Automotive
8.9 Others
9 Geographic Analysis (Page No. - 56)
9.1 Introduction
9.2 North America
9.2.1 United States
9.2.2 Canada
9.3 Europe
9.3.1 Germany
9.3.2 United Kingdom
9.4 Asia Pacific
9.4.1 Japan
9.4.2 China
9.4.3 India
9.5 Middle East and Africa
9.6 Latin America
10 Company Profiles (Page No. - 84)
(Overview, Strength of Product Portfolio, Business Strategy Excellence, Recent Developments)*
10.1 CA Technologies
10.2 IBM
10.3 Micro Focus (Formerly Hpe Software)
10.4 Smartbear Software
10.5 Parasoft
10.6 Tricentis
10.7 Cavisson Systems
10.8 Cigniti
10.9 Cognizant
10.10 Wipro Limited
10.11 Sogeti (Capgemini)
10.12 SQS
10.13 Maveric Systems
10.14 Prolifics
*Details on Overview, Strength of Product Portfolio, Business Strategy Excellence, Recent Developments Might Not Be Captured in Case of Unlisted Companies.
11 Appendix (Page No. - 122)
11.1 Discussion Guide
11.2 Knowledge Store: Marketsandmarkets� Subscription Portal
11.3 Introducing RT: Real-Time Market Intelligence
11.4 Available Customizations
11.5 Related Reports
11.6 Author Details
List of Tables (72 Tables)
Table 1 United States Dollar Exchange Rate, 2014�2016
Table 2 Service Virtualization Market Size, By Component, 2015�2022 (USD Million)
Table 3 Software/Tools: Market Size, By Region, 2015�2022 (USD Million)
Table 4 Services: Market Size, By Region, 2015�2022 (USD Million)
Table 5 Services: Market Size, By Type, 2015�2022 (USD Million)
Table 6 Managed Services Market Size, By Region, 2015�2022 (USD Million)
Table 7 Professional Services Market Size, By Region, 2015�2022 (USD Million)
Table 8 Service Virtualization Market Size, By Deployment Type, 2015�2022 (USD Million)
Table 9 On-Premises: Market Size, By Region, 2015�2022 (USD Million)
Table 10 Cloud: Market Size, By Region, 2015�2022 (USD Million)
Table 11 Service Virtualization Market Size, By Vertical, 2015�2022 (USD Million)
Table 12 Banking, Financial Services, and Insurance: Market Size, By Region, 2015�2022 (USD Million)
Table 13 IT Services: Market Size, By Region, 2015�2022 (USD Million)
Table 14 Telecommunications: Market Size, By Region, 2015�2022 (USD Million)
Table 15 Media and Entertainment: Market Size, By Region, 2015�2022 (USD Million)
Table 16 Retail and Ecommerce: Market Size, By Region, 2015�2022 (USD Million)
Table 17 Healthcare: Market Size, By Region, 2015�2022 (USD Million)
Table 18 Automotive: Market Size, By Region, 2015�2022 (USD Million)
Table 19 Others: Market Size, By Region, 2015�2022 (USD Million)
Table 20 Service Virtualization Market Size, By Region, 2015�2022 (USD Million)
Table 21 North America: Market Size, By Component, 2015�2022 (USD Million)
Table 22 North America: Market Size, By Service, 2015�2022 (USD Million)
Table 23 North America: Market Size, By Deployment Type, 2015�2022 (USD Million)
Table 24 North America: Market Size, By Vertical, 2015�2022 (USD Million)
Table 25 North America: Market Size, By Country, 2015�2022 (USD Million)
Table 26 United States: Market Size, By Component, 2015�2022 (USD Million)
Table 27 United States: Market Size, By Service, 2015�2022 (USD Million)
Table 28 United States: Market Size, By Deployment Type,
Table 29 2015�2022 (USD Million)
Table 30 United States: Market Size, By Vertical, 2015�2022 (USD Million)
Table 31 Canada: Service Virtualization Market Size, By Component, 2015�2022 (USD Million)
Table 32 Canada: Market Size, By Service, 2015�2022 (USD Million)
Table 33 Canada: Market Size, By Deployment Type, 2015�2022 (USD Million)
Table 34 Canada: Market Size, By Vertical, 2015�2022 (USD Million)
Table 35 Europe: Market Size, By Component, 2015�2022 (USD Million)
Table 36 Europe: Market Size, By Service, 2015�2022 (USD Million)
Table 37 Europe: Market Size, By Deployment Type, 2015�2022 (USD Million)
Table 38 Europe: Market Size, By Vertical, 2015�2022 (USD Million)
Table 39 Europe: Market Size, By Country, 2015�2022 (USD Million)
Table 40 Germany: Service Virtualization Market Size, By Component, 2015�2022 (USD Million)
Table 41 Germany: Market Size, By Service, 2015�2022 (USD Million)
Table 42 Germany: Market Size, By Deployment Type, 2015�2022 (USD Million)
Table 43 Germany: Market Size, By Vertical, 2015�2022 (USD Million)
Table 44 United Kingdom: Market Size, By Component, 2015�2022 (USD Million)
Table 45 United Kingdom: Market Size, By Service, 2015�2022 (USD Million)
Table 46 United Kingdom: Market Size, By Deployment Type, 2015�2022 (USD Million)
Table 47 United Kingdom: Market Size, By Vertical, 2015�2022 (USD Million)
Table 48 Asia Pacific: Market Size, By Component, 2015�2022 (USD Million)
Table 49 Asia Pacific: Market Size, By Service, 2015�2022 (USD Million)
Table 50 Asia Pacific: Market Size, By Deployment Type, 2015�2022 (USD Million)
Table 51 Asia Pacific: Market Size, By Vertical, 2015�2022 (USD Million)
Table 52 Asia Pacific: Market Size, By Country, 2015�2022 (USD Million)
Table 53 Japan: Service Virtualization Market Size, By Component, 2015�2022 (USD Million)
Table 54 Japan: Market Size, By Service, 2015�2022 (USD Million)
Table 55 Japan: Market Size, By Deployment Type, 2015�2022 (USD Million)
Table 56 Japan: Market Size, By Vertical, 2015�2022 (USD Million)
Table 57 China: Market Size, By Component, 2015�2022 (USD Million)
Table 58 China: Market Size, By Service, 2015�2022 (USD Million)
Table 59 China: Market Size, By Deployment Type, 2015�2022 (USD Million)
Table 60 China: Market Size, By Vertical, 2015�2022 (USD Million)
Table 61 India: Service Virtualization Market Size, By Component, 2015�2022 (USD Million)
Table 62 India: Market Size, By Service, 2015�2022 (USD Million)
Table 63 India: Market Size, By Deployment Type, 2015�2022 (USD Million)
Table 64 India: Market Size, By Vertical, 2015�2022 (USD Million)
Table 65 Middle East and Africa: Service Virtualization Market Size, By Component, 2015�2022 (USD Million)
Table 66 Middle East and Africa: Market Size, By Service, 2015�2022 (USD Million)
Table 67 Middle East and Africa: Market Size, By Deployment Type, 2015�2022 (USD Million)
Table 68 Middle East and Africa: Market Size, By Vertical, 2015�2022 (USD Million)
Table 69 Latin America: Market Size, By Component, 2015�2022 (USD Million)
Table 70 Latin America: Market Size, By Service, 2015�2022 (USD Million)
Table 71 Latin America: Market Size, By Deployment Type, 2015�2022 (USD Million)
Table 72 Latin America: Market Size, By Vertical, 2015�2022 (USD Million)
List of Figures (28 Figures)
Figure 1 Service Virtualization Market Segmentation
Figure 2 Market Research Design
Figure 3 Data Triangulation
Figure 4 Market Size Estimation Methodology: Bottom-Up Approach
Figure 5 Market Size Estimation Methodology: Top-Down Approach
Figure 6 Service Virtualization Market: Assumptions
Figure 7 Services Segment is Expected to Grow at A Higher CAGR During the Forecast Period
Figure 8 Banking, Financial Services, and Insurance Vertical is Expected to Grow at the Highest CAGR During the Forecast Period
Figure 9 Cloud Deployment Type is Expected to Grow at A Higher CAGR During the Forecast Period
Figure 10 North America is Estimated to Have the Largest Market Share in 2017
Figure 11 Adoption of Agile and Devops Practices for Software Development is Driving the Growth of the Service Virtualization Market
Figure 12 Banking, Financial Services, and Insurance Vertical, and North America are Estimated to Have the Largest Market Shares in the Service Virtualization Market in 2017
Figure 13 Asia Pacific is Expected to Grow at the Highest CAGR During the Forecast Period
Figure 14 Serivce Virtualization Market: Drivers, Restraints, Opportunities, and Challenges
Figure 15 The Services Segment is Expected to Exhibit the Higher Growth Rate During the Forecast Period
Figure 16 Cloud Deployment Type is Expected to Exhibit the Higher Growth Rate During the Forecast Period
Figure 17 Banking, Financial Services, and Insurance Vertical is Expected to Exhibit the Highest Growth Rate During the Forecast Period
Figure 18 Asia Pacific is Expected to Grow at the Highest CAGR During the Forecast Period
Figure 19 Asia Pacific is Expected to Exhibit the Highest Growth Rate in the Service Virtualization Market
Figure 20 North America: Market Snapshot
Figure 21 Asia Pacific: Market Snapshot
Figure 22 CA Technologies: Company Snapshot
Figure 23 IBM: Company Snapshot
Figure 24 Cigniti: Company Snapshot
Figure 25 Cognizant: Company Snapshot
Figure 26 Wipro Limited: Company Snapshot
Figure 27 Sogeti (Capgemini): Company Snapshot
Figure 28 SQS: Company Snapshot


Growth opportunities and latent adjacency in Service Virtualization Market