Shotcrete Accelerator Market by Type (Alkali Free, Alkaline Aluminate, Alkaline Silicate), Grade (Liquid, Powdered), Process (Wet Mix, Dry Mix), Application (Mining, Tunneling, Construction Repair, Water Retaining Structures) - Global Forecast to 2022


[175 Pages Report] on Shotcrete Accelerator Market was valued at USD 689.3 Million in 2016 and is projected to reach USD 1,101.8 Million by 2022, at a CAGR of 8.2% from 2017 to 2022. The market size in terms of volume is projected to reach 1.22 Million tons by 2022. In this study, 2016 has been considered the base year and 2022 the forecast year to estimate the market size of shotcrete accelerator.
The objectives of the study are:
- To define and segment the global market of shotcrete accelerator by type, grade, process, application, and region.
- To provide detailed information about the key growth factors (drivers, restraints, opportunities, and challenges) influencing the growth of the market
- To estimate and forecast the market size of shotcrete accelerator, in terms of value (USD million), and volume (kilotons), at global and regional levels
- To estimate and forecast the market of shotcrete accelerator, in terms of value (USD million), and volume (kilotons), at the country-level
- To analyze recent market developments and competitive strategies, such as expansions, product launches/developments, and mergers & acquisitions to draw the competitive landscape in the global shotcrete accelerator market
- To strategically identify and profile the key market players and analyze their core competencies in each type and application of the global shotcrete accelerator market
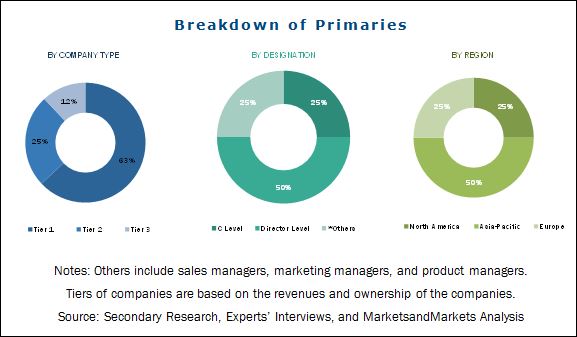
Different secondary sources such as company websites, encyclopedia, directories, and databases such as Hoovers, Bloomberg, Businessweek, Factiva, and OneSource have been used to identify and collect information useful for this extensive commercial study of the global shotcrete accelerator market. The primary sources, including experts from related industries, have been interviewed to verify and collect critical information and assess the prospects of the market. The top-down approach has been implemented to validate the market size in terms of value. With the data triangulation procedure and validation of data through primaries, the exact values of the overall parent market size and individual market sizes have been determined and confirmed in this study.
To know about the assumptions considered for the study, download the pdf brochure
The shotcrete accelerator market has a diversified and established ecosystem of its upstream players such as raw material suppliers, and downstream stakeholders such as manufacturers, vendors, end users, and government organizations.
This study answers several questions for the stakeholders, primarily which market segments they should focus upon during the next two to five years to prioritize their efforts and investments. These stakeholders include shotcrete accelerator manufacturers such as BASF SE (Germany), Sika AG (Switzerland), Mapei Spa (Italy), GCP Applied Technologies (U.S.), Normet Oy (Finland), CHRYSO SAS (France), The Euclid Chemical Company (U.S.), Denka Company Limited (Japan), Basalite Concrete Products LLC (U.S.), and Fosroc (U.K.).
Key Target Audience:
- Regional manufacturers� associations and general shotcrete accelerator associations
- Raw material manufacturers
- Traders, distributors, and suppliers of shotcrete accelerator
- Government and regional agencies and research organizations
Scope of the Report:
This research report categorizes the global shotcrete accelerator market based on type, grade, process, application, and region, forecasts revenue growth, and provides an analysis of trends in each of the submarkets.
On the Basis of Type:
- Alkali Free
- Alkaline Aluminate
- Alkaline Silicate
Each type is further described in detail in the report with volume forecasts until 2022
On the Basis of Grade:
- Liquid
- Powdered
Each grade is further described in detail in the report, with value forecasts until 2022.
On the Basis of Process:
- Wet Mix Process
- Dry Mix Process
Each process is further described in detail in the report, with value forecasts until 2022.
On the Basis of Application:
- Mining
- Tunneling
- Construction Repair Works
- Water Retaining Structures
- Others (protective coatings, roof construction, and free formed structures)
Each application segment is further described in detail in the report, with value forecasts until 2022.
On the Basis of Region:
- Europe
- Asia-Pacific
- North America
- Middle East & Africa
- South America
Each region is further segmented by key countries such as Germany, Italy, Switzerland, Norway, Sweden, Turkey, Russia, the U.K., China, Australia, Japan, India, the U.S., Canada, Mexico, UAE, Qatar, Brazil, and Argentina.
Available Customizations:
The following customization options are available for the report:
- Company Information
Analysis and profiles of additional global as well as regional market players (up to three)
The global shotcrete accelerator market is projected to reach USD 1,101.8 Million by 2022, at a CAGR of 8.2%. It is projected to reach 1.22 Million tons by 2022 by volume. The mining activities around the world, increase in tunnel construction due to rapid urbanization in emerging economies and growth in construction repairs in developed countries, are the key factors driving the global shotcrete accelerator market.
Alkali free accelerators were the largest and fastest type of shotcrete accelerator in 2016. Alkali-free accelerators were developed as the traditional alkaline accelerators were caustic in nature which caused several health hazards to the shotcrete nozzle operators. Apart from this, due to their superior properties in terms of the 28-day strength or the final strength of the structure, they have been replacing the alkaline accelerators.
Globally, liquid accelerator is the largest and fastest-growing grade of shotcrete accelerator in 2016. Both alkali free and alkaline accelerators are available in their liquid form. Liquid accelerators are generally used for the wet process. The wet process is preferred for underground construction such as mining and tunneling, where larger volume of shotcrete accelerator is consumed.
Wet mix shotcrete process is the largest and fastest-growing process in the global shotcrete accelerator market. The major applications of shotcrete accelerator are in the mining and tunnel construction which uses the wet- mix process. Structures constructed with the wet process are seen to have superior quality and are more efficient compared to the dry process which is the main factor in driving the shotcrete accelerator market in this process.
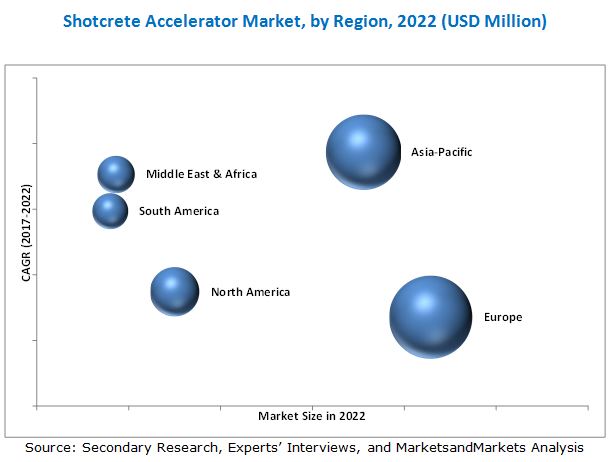
The European region led the global shotcrete accelerator market, both, in terms of value and volume, in 2016. Germany dominates the market followed by Italy, Switzerland, Norway and Sweden in terms of value, in 2016. The growth in the shotcrete accelerator market in Germany is due to a sudden spur in the German construction industry. The German construction industry accounts for 4% of the country�s gross domestic product (GDP), and it amounted to around USD 334 million in 2015. The strong boom in the German construction industry is attributed by the strong growth of the Eurozone economy.
The global shotcrete accelerator market is witnessing a high growth rate but there are a few factors that restrain and challenge the growth of the shotcrete accelerator market. These are established infrastructures in developed countries, unstable economic cycles, and higher shrinkage with alkali free accelerators.
BASF SE (Germany), Sika AG (Switzerland), Mapei Spa (Italy), GCP Applied Technologies Inc. (U.S.), and Normet Oy (Finland), led the global shotcrete accelerator market. The major players are increasing their market shares and global footprint in the shotcrete accelerator market by adopting strategies such as new product launches and expansions which are expected to help them strengthen their positions in the global shotcrete accelerator market.
To speak to our analyst for a discussion on the above findings, click Speak to Analyst
 Exclusive indicates content/data unique to MarketsandMarkets and not available with any competitors.
Table of Contents
1 Introduction (Page No. - 17)
1.1 Objectives of the Study
1.2 Market Definition
1.3 Market Scope
1.3.1 Years Considered for the Study
1.4 Currency
1.5 Package Size
1.6 Limitations
1.7 Stakeholders
2 Research Methodology (Page No. - 21)
2.1 Research Data
2.1.1 Secondary Data
2.1.1.1 Key Data From Secondary Sources
2.1.2 Primary Data
2.1.2.1 Key Data From Primary Sources
2.1.2.2 Key Industry Insights
2.1.2.3 Breakdown of Primary Interviews
2.2 Market Size Estimation
2.3 Data Triangulation
2.4 Research Assumptions
3 Executive Summary (Page No. - 29)
4 Premium Insights (Page No. - 33)
4.1 Attractive Opportunities in Shotcrete Accelerator Market
4.2 Shotcrete Accelerator Market Growth, By Application
4.3 Global Shotcrete Accelerator Market Share, By Region and Application, 2016
5 Market Overview (Page No. - 37)
5.1 Introduction
5.2 Market Dynamics
5.2.1 Drivers
5.2.1.1 Mining Activities Around the World
5.2.1.2 Increase in Tunnel Construction Due to Rapid Urbanization in Emerging Economies
5.2.1.3 Growth in Construction Repairs in Developed Countries
5.2.2 Restraints
5.2.2.1 Lower Prospects of New Infrastructures in Developed Countries
5.2.2.2 Higher Shrinkage With Alkali-Free Shotcrete Accelerator
5.2.3 Opportunities
5.2.3.1 R&D Activities to Improve Current Products
5.2.3.2 Adoption of Public-Private Partnership
5.2.4 Challenges
5.2.4.1 Unstable Economic Cycles
5.2.4.2 Asset Misappropriation in the Construction Industry
5.3 Porter�s Five Forces Analysis
5.3.1 Threat of New Entrants
5.3.2 Bargaining Power of Suppliers
5.3.3 Threat of Substitutes
5.3.4 Bargaining Power of Buyers
5.3.5 Intensity of Competitive Rivalry
5.4 Macroeconomic Overview and Trends
6 Shotcrete Accelerator Market, By Type (Page No. - 49)
6.1 Introduction
6.2 Alkali-Free Accelerator
6.3 Alkaline Aluminate Accelerator
6.4 Alkaline Silicate Accelerator
7 Shotcrete Accelerator Market: By Grade (Page No. - 56)
7.1 Introduction
7.2 Liquid Accelerator
7.3 Powdered Accelerator
8 Shotcrete Accelerator Market: By Process (Page No. - 62)
8.1 Introduction
8.2 Wet Mix Process
8.3 Dry Mix Process
9 Shotcrete Accelerator Market, By Application (Page No. - 68)
9.1 Introduction
9.2 Mining
9.3 Tunneling
9.4 Construction Repair Works
9.5 Water Retaining Structures
9.6 Others
10 Shotcrete Accelerator Market, By Region (Page No. - 79)
10.1 Introduction
10.2 Europe
10.2.1 Germany
10.2.2 Italy
10.2.3 Switzerland
10.2.4 Norway
10.2.5 Sweden
10.2.6 Turkey
10.2.7 Russia
10.2.8 U.K.
10.2.9 Rest of Europe
10.3 Asia-Pacific
10.3.1 China
10.3.2 Australia
10.3.3 Japan
10.3.4 India
10.3.5 Rest of Asia-Pacific
10.4 North America
10.4.1 U.S.
10.4.2 Canada
10.4.3 Mexico
10.5 Middle East & Africa
10.5.1 UAE
10.5.2 Qatar
10.5.3 Rest of Middle East & Africa
10.6 South America
10.6.1 Brazil
10.6.2 Argentina
10.6.3 Rest of South America
11 Competitive Landscape (Page No. - 128)
11.1 Introduction
11.1.1 Dynamics
11.1.2 Innovators
11.1.3 Vanguards
11.1.4 Emerging
11.2 Competitive Benchmarking
11.2.1 Product Offering
11.2.2 Business Strategy
11.3 Market Share Analysis
12 Company Profiles (Page No. - 133)
(Overview, Financial*, Products & Services, Strategy, and Developments)
12.1 BASF SE
12.2 Sika AG.
12.3 Mapei S.P.A
12.4 GCP Applied Technologies Inc.
12.5 Normet Oy
12.6 Chryso SAS
12.7 The Euclid Chemical Company
12.8 Denka Company Limited
12.9 Fosroc
12.10 Cico Group
12.11 Basalite Concrete Products LLC
12.12 Additional Company Profiles
12.12.1 Draco Italiana SPA
12.12.2 Mc-Bauchemie
12.12.3 Target Products Limited
12.12.4 Shotcrete Technologies Inc.
12.12.5 Polygon Chemicals
12.12.6 Gemite Group
12.12.7 Silkroad C & T Co., Ltd.
12.12.8 IQE Group
12.12.9 Atek Fine Chemical Co., Ltd
12.12.10 SI Powders
12.12.11 Applied Concrete Solutions
12.12.12 Hardman Chemicals Pty. Ltd.
12.12.13 Cormix International Limited
12.12.14 Muhu Construction Materials Co., Ltd.
*Details Might Not Be Captured in Case of Unlisted Companies
13 Appendix (Page No. - 166)
13.1 Insights From Industry Experts
13.2 Discussion Guide
13.3 Knowledge Store: Marketsandmarkets� Subscription Portal
13.4 Introducing RT: Real-Time Market Intelligence
13.5 Available Customizations
13.6 Author Details
List of Tables (133 Tables)
Table 1 Trend of Growth in World GDP Per Capita, in USD Million (2016�2020)
Table 2 Shotcrete Accelerator Market Size, By Type, 2015�2022 (USD Million)
Table 3 Shotcrete Accelerator Market Size, By Type, 2015�2022 (Kiloton)
Table 4 Alkali-Free Shotcrete Accelerator Market Size, By Region, 2015�2022 (USD Million)
Table 5 Alkali-Free Shotcrete Accelerator Market Size, By Region, 2015�2022 (Kiloton)
Table 6 Alkaline Aluminate Shotcrete Accelerator Market Size, By Region, 2015�2022 (USD Million)
Table 7 Alkaline Aluminate Shotcrete Accelerator Market Size, By Region, 2015�2022 (Kiloton)
Table 8 Alkaline Silicate Shotcrete Accelerator Market Size, By Region, 2015�2022 (USD Million)
Table 9 Alkaline Silicate Shotcrete Accelerator Market Size, By Region, 2015�2022 (Kiloton)
Table 10 Shotcrete Accelerator Market Size, By Grade, 2015�2022 (USD Million)
Table 11 By Market Size, By Grade, 2015�2022 (USD Million)
Table 12 By Market Size, By Grade, 2015�2022 (Kiloton)
Table 13 By Market Size, By Grade, 2015�2022 (Kiloton)
Table 14 Liquid Accelerator Market Size, By Region, 2015�2022 (USD Million)
Table 15 Liquid Accelerator Market Size, By Region, 2015�2022 (Kiloton)
Table 16 Powdered Accelerator Market Size, By Region, 2015�2022 (USD Million)
Table 17 Powdered Accelerator Market Size, By Region, 2015�2022 (Kiloton)
Table 18 Shotcrete Accelerator Market Size, By Process, 2015�2022 (USD Million)
Table 19 By Market Size, By Process, 2015�2022 (Kiloton)
Table 20 By Market Size in Wet Mix Process, By Region, 2015�2022 (USD Million)
Table 21 By Market Size in Wet Mix Process, By Region, 2015�2022 (Kiloton)
Table 22 By Market Size in Dry Mix Process, By Region, 2015�2022 (USD Million)
Table 23 By Market Size in Dry Mix Process, By Region, 2015�2022 (Kiloton)
Table 24 Shotcrete Accelerator Market Size, By Application, 2015�2022 (USD Million)
Table 25 By Market Size, By Application, 2015�2022 (Kiloton)
Table 26 By Market Size in Mining, By Region, 2015�2022 (USD Million)
Table 27 By Market Size in Mining, By Region, 2015�2022 (Kiloton)
Table 28 By Market Size in Tunneling, By Region, 2015�2022 (USD Million)
Table 29 By Market Size in Tunneling, By Region, 2015�2022 (Kiloton)
Table 30 By Market Size in Construction Repair Works, By Region, 2015�2022 (USD Million)
Table 31 By Market Size in Construction Repair Works, By Region, 2015�2022 (Kiloton)
Table 32 By Market Size in Water Retaining Structures, By Region, 2015�2022 (USD Million)
Table 33 By Market Size in Water Retaining Structures, By Region, 2015�2022 (Kiloton)
Table 34 Shotcrete Accelerator Market Size in Other Applications, By Region, 2015�2022 (USD Million)
Table 35 By Market Size in Other Applications, By Region, 2015�2022 (Kiloton)
Table 36 Shotcrete Accelerator Market Size, By Region, 2015�2022 (USD Million)
Table 37 By Market Size, By Region, 2015�2022 (Kiloton)
Table 38 Europe: Shotcrete Accelerator Market Size, By Country, 2015�2022 (USD Million)
Table 39 Europe: By Market Size, By Country, 2015�2022 (Kiloton)
Table 40 Europe: By Market Size, By Type, 2015�2022 (USD Million)
Table 41 Europe: By Market Size, By Type, 2015�2022 (Kiloton)
Table 42 Europe: By Market Size, By Grade, 2015�2022 (USD Million)
Table 43 Europe: By Market Size, By Grade, 2015�2022 (Kiloton)
Table 44 Europe: By Market Size, By Process, 2015�2022 (USD Million)
Table 45 Europe: By Market Size, By Process, 2015�2022 (Kiloton)
Table 46 Europe: By Market Size, By Application, 2015�2022 (USD Million)
Table 47 Europe: By Market Size, By Application, 2015�2022 (Kiloton)
Table 48 Germany: Shotcrete Accelerator Market Size, By Application, 2015�2022 (USD Million)
Table 49 Germany: By Market Size, By Application, 2015�2022 (Kiloton)
Table 50 Italy: Shotcrete Accelerator Market Size, By Application, 2015�2022 (USD Million)
Table 51 Italy: By Market Size, By Application, 2015�2022 (Kiloton)
Table 52 Switzerland: Shotcrete Accelerator Market Size, By Application, 2015�2022 (USD Million)
Table 53 Switzerland: By Market Size, By Application, 2015�2022 (Kiloton)
Table 54 Norway: Shotcrete Accelerator Market Size, By Application, 2015�2022 (USD Million)
Table 55 Norway: By Market Size, By Application, 2015�2022 (Kiloton)
Table 56 Sweden: Shotcrete Accelerator Market Size, By Application, 2015�2022 (USD Million)
Table 57 Sweden: By Market Size, By Application, 2015�2022 (Kiloton)
Table 58 Turkey: Shotcrete Accelerator Market Size, By Application, 2015�2022 (USD Million)
Table 59 Turkey: By Market Size, By Application, 2015�2022 (Kiloton)
Table 60 Russia: Shotcrete Accelerator Market Size, By Application, 2015�2022 (USD Million)
Table 61 Russia: By Market Size, By Application, 2015�2022 (Kiloton)
Table 62 U.K.: Shotcrete Accelerator Market Size, By Application, 2015�2022 (USD Million)
Table 63 U.K.: By Market Size, By Application, 2015�2022 (Kiloton)
Table 64 Rest of Europe: Shotcrete Accelerator Market Size, By Application, 2015�2022 (USD Million)
Table 65 Rest of Europe: By Market Size, By Application, 2015�2022 (Kiloton)
Table 66 Asia-Pacific: Shotcrete Accelerator Market Size, By Country, 2015�2022 (USD Million)
Table 67 Asia-Pacific: By Market Size, By Country, 2015�2022 (Kiloton)
Table 68 Asia-Pacific: By Market Size, By Type, 2015�2022 (USD Million)
Table 69 Asia-Pacific: By Market Size, By Type, 2015�2022 (Kiloton)
Table 70 Asia-Pacific: By Market Size, By Grade, 2015�2022 (USD Million)
Table 71 Asia-Pacific: By Market Size, By Grade, 2015�2022 (Kiloton)
Table 72 Asia-Pacific: By Market Size, By Process, 2015�2022 (USD Million)
Table 73 Asia-Pacific: By Market Size, By Process, 2015�2022 (Kiloton)
Table 74 Asia-Pacific: By Market Size, By Application, 2015�2022 (USD Million)
Table 75 Asia-Pacific: By Market Size, By Application, 2015�2022 (Kiloton)
Table 76 China: Shotcrete Accelerator Market Size, By Application, 2015�2022 (USD Million)
Table 77 China: By Market Size, By Application, 2015�2022 (Kiloton)
Table 78 Australia: Shotcrete Accelerator Market Size, By Application, 2015�2022 (USD Million)
Table 79 Australia: By Market Size, By Application, 2015�2022 (Kiloton)
Table 80 Japan: Shotcrete Accelerator Market Size, By Application, 2015�2022 (USD Million)
Table 81 Japan: By Market Size, By Application, 2015�2022 (Kiloton)
Table 82 India: Shotcrete Accelerator Market Size, By Application, 2015�2022 (USD Million)
Table 83 India: By Market Size, By Application, 2015�2022 (Kiloton)
Table 84 Rest of Asia-Pacific: Shotcrete Accelerator Market Size, By Application, 2015�2022 (USD Million)
Table 85 Rest of Asia-Pacific: By Market Size, By Application, 2015�2022 (Kiloton)
Table 86 North America: Shotcrete Accelerator Market Size, By Country, 2015�2022 (USD Million)
Table 87 North America: By Market Size, By Country, 2015�2022 (Kiloton)
Table 88 North America: By Market Size, By Type, 2015�2022 (USD Million)
Table 89 North America: By Market Size, By Type, 2015�2022 (Kiloton)
Table 90 North America: By Market Size, By Grade, 2015�2022 (USD Million)
Table 91 North America: By Market Size, By Grade, 2015�2022 (Kiloton)
Table 92 North America: By Market Size, By Process, 2015�2022 (USD Million)
Table 93 North America: By Market Size, By Process, 2015�2022 (Kiloton)
Table 94 North America: By Market Size, By Application, 2015�2022 (USD Million)
Table 95 North America: By Market Size, By Application, 2015�2022 (Kiloton)
Table 96 U.S.: Shotcrete Accelerator Market Size, By Application, 2015�2022 (USD Million)
Table 97 U.S.: By Market Size, By Application, 2015�2022 (Kiloton)
Table 98 Canada: Shotcrete Accelerator Market Size, By Application, 2015�2022 (USD Million)
Table 99 Canada: By Market Size, By Application, 2015�2022 (Kiloton)
Table 100 Mexico: Shotcrete Accelerator Market Size, By Application, 2015�2022 (USD Million)
Table 101 Mexico: By Market Size, By Application, 2015�2022 (Kiloton)
Table 102 Middle East & Africa: Shotcrete Accelerator Market Size, By Country, 2015�2022 (USD Million)
Table 103 Middle East & Africa: By Market Size, By Country, 2015�2022 (Kiloton)
Table 104 Middle East & Africa: By Market Size, By Type, 2015�2022 (USD Million)
Table 105 Middle East & Africa: By Market Size, By Type, 2015�2022 (Kiloton)
Table 106 Middle East & Africa: By Market Size, By Grade, 2015�2022 (USD Million)
Table 107 Middle East & Africa: By Market Size, By Grade, 2015�2022 (Kiloton)
Table 108 Middle East & Africa: By Market Size, By Process, 2015�2022 (USD Million)
Table 109 Middle East and Africa By Market Size, By Process, 2015�2022 (USD Million)
Table 110 Middle East & Africa: By Market Size, By Application, 2015�2022 (USD Million)
Table 111 Middle East & Africa: By Market Size, By Application, 2015�2022 (Kiloton)
Table 112 UAE: Shotcrete Accelerator Market Size, By Application, 2015�2022 (USD Million)
Table 113 UAE: By Market Size, By Application, 2015�2022 (Kiloton)
Table 114 Qatar: Shotcrete Accelerator Market Size, By Application, 2015�2022 (USD Million)
Table 115 Qatar: By Market Size, By Application, 2015�2022 (Kiloton)
Table 116 Rest of Middle East & Africa: Shotcrete Accelerator Market Size, By Application, 2015�2022 (USD Million)
Table 117 Rest of Middle East & Africa: By Market Size, By Application, 2015�2022 (USD Million)
Table 118 South America: Shotcrete Accelerator Market Size, By Country, 2015�2022 (USD Million)
Table 119 South America: By Market Size, By Country, 2015�2022 (Kiloton)
Table 120 South America: By Market Size, By Type, 2015�2022 (USD Million)
Table 121 South America: By Market Size, By Type, 2015�2022 (Kiloton)
Table 122 South America: By Market Size, By Grade, 2015�2022 (USD Million)
Table 123 South America: By Market Size, By Grade, 2015�2022 (Kiloton)
Table 124 South America: By Market Size, By Process, 2015�2022 (USD Million)
Table 125 South America: By Market Size, By Process, 2015�2022 (Kiloton)
Table 126 South America: By Market Size, By Application, 2015�2022 (USD Million)
Table 127 South America: By Market Size, By Application, 2015�2022 (Kiloton)
Table 128 Brazil: Shotcrete Accelerator Market Size, By Application, 2015�2022 (USD Million)
Table 129 Brazil: By Market Size, By Application, 2015�2022 (Kiloton)
Table 130 Argentina: Shotcrete Accelerator Market Size, By Application, 2015�2022 (USD Million)
Table 131 Argentina: By Market Size, By Application, 2015�2022 (Kiloton)
Table 132 Rest of South America: Shotcrete Accelerator Market Size, By Application, 2015�2022 (USD Million)
Table 133 Rest of South America: By Market Size, By Application, 2015�2022 (Kiloton)
List of Figures (46 Figures)
Figure 1 Shotcrete Accelerator Market Segmentation
Figure 2 Shotcrete Accelerator Market: Research Design
Figure 3 Market Size Estimation: Top-Down Approach
Figure 4 Market Size Estimation: Bottom-Up Approach
Figure 5 Shotcrete Accelerator: Data Triangulation
Figure 6 Alkali-Free Accelerators to Be the Largest Type of Shotcrete Accelerator During Forecast Period
Figure 7 Alkali-Free Accelerators to Dominate the Shotcrete Accelerator Market in Europe During Forecast Period
Figure 8 Mining to Dominate Shotcrete Accelerator Market During Forecast Period
Figure 9 Europe Dominated the Shotcrete Accelerator Market in 2016
Figure 10 Shotcrete Accelerator Market to Witness High Growth During Forecast Period
Figure 11 Tunneling to Be the Fastest-Growing Application Between 2017 and 2022
Figure 12 Europe Accounted for the Largest Share in Shotcrete Accelerator Market in 2016
Figure 13 Shotcrete Accelerator Market Attractiveness : Sweden to Emerge as the Most Lucrative Market for Shotcrete Accelerator Between 2017 and 2022
Figure 14 Drivers, Restraints, Opportunities, and Challenges in Shotcrete Accelerator Market
Figure 15 Porter�s Five Forces Analysis
Figure 16 China has the World�s Largest Mineral Production, in Metric Tons, 2015
Figure 17 Alkali-Free Accelerator to Be the Largest and Fastest-Growing Segment of Shotcrete Accelerator Market Between 2017 and 2022
Figure 18 Europe to Be the Largest Alkali-Free Shotcrete Accelerator Market Between 2017 and 2022
Figure 19 Alkaline Aluminate Shotcrete Accelerator Market in Middle East & Africa to Witness the Fastest Growth Between 2017 and 2022
Figure 20 Asia-Pacific to Be the Largest Alkaline Silicate Shotcrete Accelerator Market Between 2017 and 2022
Figure 21 Liquid Accelerators to Dominate Shotcrete Accelerator Market Between 2017 and 2022
Figure 22 Europe to Be the Largest Liquid Accelerator Market Between 2017 and 2022
Figure 23 Europe to Be the Largest Market for Powdered Accelerator Between 2017 and 2022
Figure 24 Wet Mix Process to Dominate Shotcrete Accelerator Market Between 2017 and 2022
Figure 25 Asia-Pacific and Middle East & Africa to Be the Fastest-Growing Shotcrete Accelerator Market in Wet Mix Process Between 2017 and 2022
Figure 26 Asia-Pacific to Be the Fastest-Growing Shotcrete Accelerator Market in Dry Mix Process Between 2017 and 2022
Figure 27 Mining Application to Lead the Shotcrete Accelerator Market Between 2017 and 2022
Figure 28 Europe to Be the Largest Shotcrete Accelerator Market in Mining Application Between 2017 and 2022
Figure 29 Asia-Pacific to Be the Fastest-Growing Shotcrete Accelerator Market in Tunneling Application Between 2017 and 2022
Figure 30 North America to Be the Fastest-Growing Shotcrete Accelerator Market in Construction Repair Works Between 2017 and 2022
Figure 31 Europe to Be the Largest Shotcrete Accelerator Market in Water Retaining Structures Application Between 2017 and 2022
Figure 32 North America to Be the Fastest-Growing Shotcrete Accelerator Market in Other Applications Between 2017 and 2022
Figure 33 Regional Market Snapshot: Asia-Pacific to Be the Fastest-Growing Shotcrete Accelerator Market, 2017�2022
Figure 34 Europe Market Snapshot: Germany to Be the Largest and Sweden the Fastest-Growing Market, 2017�2022
Figure 35 Asia-Pacific Market Snapshot: China to Be the Largest and Fastest-Growing Shotcrete Accelerator Market, 2017�2022
Figure 36 North American Market Snapshot: U.S. Was the Largest Shotcrete Accelerator Market in 2016
Figure 37 Middle East & Africa Market Snapshot: Qatar to Be the Largest and Fastest-Growing Market, 2017�2022
Figure 38 South America Market Snapshot: Brazil to Be the Largest and Fastest-Growing Market, 2017�2022
Figure 39 Competitive Leadership Mapping
Figure 40 Shotcrete Accelerator Market Share Analysis, 2016
Figure 41 BASF SE: Company Snapshot
Figure 42 Sika AG: Company Snapshot
Figure 43 Mapei S.P.A: Company Snapshot
Figure 44 GCP Applied Technologies Inc.: Company Snapshot
Figure 45 Business Strategy Scorecard
Figure 46 Denka Company Limited: Company Snapshot


Growth opportunities and latent adjacency in Shotcrete Accelerator Market