Smart Grid Technology Market - Analysis & Global Forecast By Hardware, Software & Communication Network Technologies (2011 - 2016)


Please click here to get the relevant report of Microgrid Market Forecast & Analysis (2012-2022): By Types (Hybrid, Off-Grid, Grid Connected); Technology (Switch Gears, Pv Inverter, Storage (Batteries, Flywheels, Super Capacitors), Microturbines); Application (Campus, Commercial, Defense)
Smart grid intends to modernize the power grid by using the latest technology that supports the utility to reduce the transmission and distribution loss. This can be achieved with the help of advanced metering infrastructure, software’s such as SCADA, DRM, DMS, MDMS, etc., and communication networks such as Wi-Fi, ZigBee, Z-Wave, etc.
Smart grid will balance the electricity supply and demand. It will improve the grid reliability by monitoring the frequency and duration of power outages and the number of disturbances, including reduction of the possibility of regional blackouts. Smart grid will improve the efficiency and dependability in energy distribution and assist in optimizing utilization of resources.
Reduction in transmission and distribution loss, coupled with an increase in energy efficiency, is one of the major drivers of this market. The governments of various countries are playing important roles in the commercialization of this and passing on mandates and regulations for the same. The high cost of installation of the entire smart grid network is one of the restraints of the smart grid market. Another major restraint is the lack of interoperability of standards. There are huge amounts of investments happening in this market, which are an opportunity for the growth of the market. Prepaid electricity is also en-route, wherein the users will prepay for the electricity that will be consumed by them.
Lack of interoperability standards exists at all the levels in a system. There are numerous service providers across the globe with different standards of operating and meeting a common consensus is very important for the growth of any industry. This is lacking in the smart grid market as every country has its own rules and mandates. This leads to a slower adoption of technology and increases risks for the industry as a whole.
The current trend prevailing in the smart grid technology market is the upgradation of old technology as well as adopting a new technology, which will lead to a more efficient usage of electricity. The increase in investment from the governments as well as the utilities’ point of view is expected to reach a billion mark in the next five years.
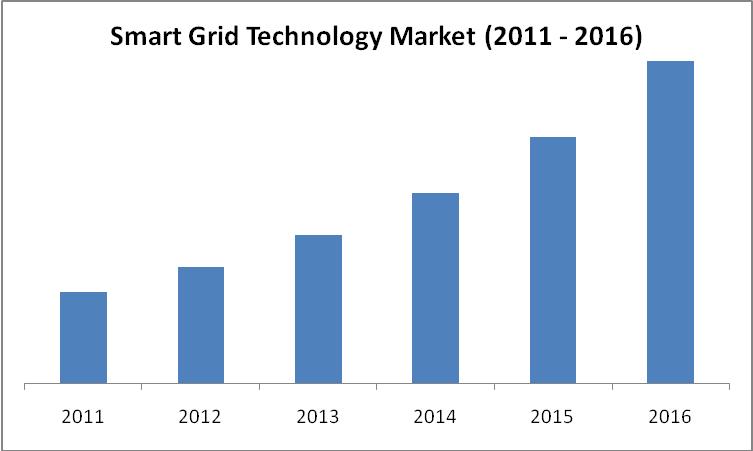
The global smart grid market is expected to reach $80.6 billion in 2016 from $22.8 billion in 2011 at a CAGR of 28.7% from 2011 to 2016. Some of the players in this market include Landys+Gyr (U.S.), Itron (U.S.), Cisco (U.S.), eMeter (U.S.), and Telvent (U.S.).
Scope of the report
This research report categorizes the global smart grid technology market and its related applications market on the basis of different kinds of software’s that are being used for the smart grid network, smart meter, various smart sensor, communication network and geographical analysis; forecasting revenue, and analyzing trends in the market.
On the basis of software and hardware
The software and the hardware market are broadly segmented into Distribution Management Systems (DMS), Demand Response Management Systems (DRM), Meter Data Management Systems (MDMS), Supervisory Control and Data Acquisition (SCADA), Outage Management Systems (OMS) and Smart Meters.
On the basis of smart sensors
The Smart sensors segment consists of voltage sensors, transformer monitoring sensors, dynamic line rating sensors and HAN sensors
On the basis of communication network
The communication Network is segmented on the basis of Wide Area Network (WAN) and Home Area Network (HAN). The different networks in the WAN and the HAN network are analysed.
On the basis of geography
- North America
- U.S.
- Canada
- Mexico
- Europe
- Germany
- UK
- France
- Spain
- Italy
- Others
- Asia-Pacific
- Australia
- China
- Japan
- Korea
- India
- Others
- ROW
- Middle East
- Africa
- Others
Each section will provide market data, market drivers, trends and opportunities, key players, and competitive outlook. It will also provide market tables for covering the sub-segments and micro-markets. In addition, the report provides more than 20 company profiles covering all the sub-segments.
One of the most fundamental functions of a smart grid is to monitor, analyze, control, and communicate the capabilities of a national electrical system in a digitized form, which helps in maximizing the throughput time of the system as well as reducing the consumption of energy. The installation of the smart grid network will enable reduction in the T&D losses, which is driving the smart grid market.
A smart grid is also known as “Energy Internet”. The basic components of a smart grid network are: intelligent networking, sensing and monitoring devices, and in home devices. Intelligent networking refers to the communication networks, through which the grid will be able to communicate from the generator to the end-user. Sensing and measurement deal with informing the utility end about the potential outages that may take place as well as about any kind of fluctuation in the grid network.
The major objective of traditional grid was to provide electricity; there is only one way communication in traditional grid, whereas smart grid technology is an advanced technology based on two way communication that allows interactivity between utility and end-users.
It is estimated that with the use of a traditional electric grid, the transmission and distribution losses amount to 25 – 30% annually, whereas by the use of smart sensors such as voltage monitoring sensors, transformer monitoring sensors, dynamic line rating sensors, which help in tracking the voltage of power supplied from transmission to distribution, temperature of the transformer, the transmission and distribution losses are reduced to up to 8 – 10% annually.
Cyber security is the major issue related to smart grid. There can be a cyber attack through the public network; which has been identified by the cyber security assessment of SCADA.
A major obstacle in protecting these networks is that these systems were not essentially designed considering the cyber security issue, due to which there have been ample opportunities for attackers to hack the smart grid security.
The players in this market include Landys+Gyr (U.S.), Itron (U.S.), Cisco (U.S.), eMeter (U.S.), and Telvent (U.S.).
Source: MarketsandMarkets Analysis
 Exclusive indicates content/data unique to MarketsandMarkets and not available with any competitors.
TABLE OF CONTENTS
1 INTRODUCTION
1.1 KEY TAKE-AWAYS
1.2 REPORT DESCRIPTION
1.3 MARKETS COVERED
1.4 STAKEHOLDERS
1.5 RESEARCH METHODOLOGY
1.5.1 MARKET SIZE
1.5.2 KEY DATA POINTS FROM SECONDARY SOURCES
1.5.3 KEY DATA POINTS TAKEN FROM PRIMARY SOURCES
1.5.4 ASSUMPTIONS MADE
1.5.5 LIST OF COMPANIES COVERED DURING THIS REPORT
2 EXECUTIVE SUMMARY
3 MARKET OVERVIEW
3.1 INTRODUCTION
3.2 WHAT IS A SMART GRID?
3.3 TRADITIONAL GRID VERSUS SMART GRID
3.4 MARKET DYNAMICS
3.4.1 DRIVERS
3.4.1.1 Increased government support
3.4.1.2 Reduction in transmission and distribution losses
3.4.1.3 Aging infrastructure
3.4.1.4 Improved communication network
3.4.1.5 Need for energy efficiency
3.4.2 RESTRAINTS
3.4.2.1 High cost of installation
3.4.2.2 Privacy issues
3.4.2.3 Lack of interoperability and common standards
3.4.3 OPPORTUNITIES
3.4.3.1 Increased investments
3.4.3.2 Prepayment of electricity
3.5 WINNING IMPERATIVES
3.5.1 PARTNERSHIPS WITH MAJOR PLAYERS
3.6 BURNING ISSUES
3.6.1 CYBER SECURITY ISSUES
3.7 MARKET SHARE ANALYSIS
3.8 PORTER’S FIVE FORCES MODEL
3.8.1 THREAT OF SUBSTITUTES
3.8.2 THREAT OF NEW ENTRANTS
3.8.3 BARGAINING POWER OF CUSTOMERS
3.8.4 BARGAINING POWER OF SUPPLIERS
3.8.5 INTENSITY OF RIVALRY
3.9 SMART GRID TECHNOLOGY ANALYSIS - BY APPLICATIONS
3.10 SMART GRID TECHNOLOGY ANALYSIS - BY COUNTRY
4 SOFTWARE AND HARDWARE MARKET
4.1 OVERVIEW OF THE SOFTWARE AND THE HARDWARE MARKET
4.1.1 DISTRIBUTION MANAGEMENT SYSTEM (DMS)
4.1.2 DEMAND RESPONSE MANAGEMENT (DRM)
4.1.3 METER DATA MANAGEMENT SYSTEM (MDMS)
4.1.4 SUPERVISORY CONTROL AND DATA ACQUISITION (SCADA)
4.1.5 SMART METER
4.1.5.1 Cost analysis of smart electric meter installation
4.1.6 OUTAGE MANAGEMENT SYSTEM (OMS)
5 SMART GRID SENSORS MARKET
5.1 OVERVIEW OF SMART SENSORS
5.1.1 VOLTAGE SENSORS
5.1.2 TRANSFORMER MONITORING SENSORS
5.1.3 DYNAMIC LINE RATING SENSORS
5.1.4 HOME AREA NETWORK SENSORS
6 COMMUNICATIONS NETWORK
6.1 OVERVIEW OF COMMUNICATIONS NETWORK
6.1.1 WIDE AREA NETWORK
6.1.2 HOME AREA NETWORK (HAN)
7 GEOGRAPHIC ANALYSIS
7.1 OVERVIEW
7.1.1 NORTH AMERICA
7.1.1.1 U.S.
7.1.1.2 Canada
7.1.1.3 Mexico
7.1.2 EUROPE
7.1.2.1 Germany
7.1.2.2 U.K.
7.1.2.3 France
7.1.2.4 Italy
7.1.2.5 Others
7.1.3 APAC
7.1.3.1 Australia
7.1.3.2 China
7.1.3.3 Japan
7.1.3.4 South Korea
7.1.3.5 India
7.1.3.6 Others
7.1.4 ROW
7.1.4.1 Middle East
7.1.4.2 Africa
7.1.4.3 Others
8 COMPETITIVE LANDSCAPE
8.1 OVERVIEW
8.2 KEY GROWTH STRATEGIES
8.3 NEW PRODUCT DEVELOPMENT
8.4 MERGERS & ACQUISITIONS
8.5 PARTNERSHIPS, AGREEMENTS, COLLABORATIONS AND JOINT VENTURES
8.6 OTHERS (SUPPLY CONTRACTS/CERTIFICATIONS ETC)
9 COMPANY PROFILES
9.1 CISCO SYSTEMS, INC.
9.1.1 OVERVIEW
9.1.2 PRODUCTS & SERVICES
9.1.3 FINANCIALS
9.1.4 STRATEGY
9.1.5 DEVELOPMENTS
9.2 COMVERGE
9.2.1 OVERVIEW
9.2.2 PRODUCTS & SERVICES
9.2.3 FINANCIALS
9.2.4 STRATEGY
9.2.5 DEVELOPMENTS
9.3 COOPER POWER SYSTEMS, LLC
9.3.1 OVERVIEW
9.3.2 PRODUCTS & SERVICES
9.3.3 FINANCIALS
9.3.4 STRATEGY
9.3.5 DEVELOPMENTS
9.4 ECHELON CORP
9.4.1 OVERVIEW
9.4.2 PRODUCTS & SERVICES
9.4.3 FINANCIALS
9.4.4 STRATEGY
9.4.5 DEVELOPMENTS
9.5 ELSTER GROUP SE
9.5.1 OVERVIEW
9.5.2 PRODUCTS & SERVICES
9.5.3 FINANCIALS
9.5.4 STRATEGY
9.5.5 DEVELOPMENTS
9.6 EMETER CORPORATION
9.6.1 OVERVIEW
9.6.2 PRODUCTS & SERVICES
9.6.3 FINANCIALS
9.6.4 STRATEGY
9.6.5 DEVELOPMENTS
9.7 GE ENERGY
9.7.1 OVERVIEW
9.7.2 PRODUCTS & SERVICES
9.7.3 FINANCIALS
9.7.4 STRATEGY
9.7.5 DEVELOPMENTS
9.8 GRID NET, INC.
9.8.1 OVERVIEW
9.8.2 PRODUCTS & SERVICES
9.8.3 FINANCIALS
9.8.4 STRATEGY
9.8.5 DEVELOPMENTS
9.9 INTERNATIONAL BUSINESS MACHINES CORPORATION (IBM CORP)
9.9.1 OVERVIEW
9.9.2 PRODUCTS & SERVICES
9.9.3 FINANCIALS
9.9.4 STRATEGY
9.9.5 DEVELOPMENTS
9.10 INFRAX SYSTEMS, INC.
9.10.1 OVERVIEW
9.10.2 PRODUCTS & SERVICES
9.10.3 FINANCIALS
9.10.4 STRATEGY
9.10.5 DEVELOPMENTS
9.11 ISKRAEMECO
9.11.1 OVERVIEW
9.11.2 PRODUCTS & SERVICES
9.11.3 FINANCIALS
9.11.4 STRATEGY
9.11.5 DEVELOPMENTS
9.12 ITRON INC
9.12.1 OVERVIEW
9.12.2 PRODUCTS & SERVICES
9.12.3 FINANCIALS
9.12.4 STRATEGY
9.12.5 DEVELOPMENTS
9.13 LANDIS+GYR LTD
9.13.1 OVERVIEW
9.13.2 PRODUCTS & SERVICES
9.13.3 FINANCIALS
9.13.4 STRATEGY
9.13.5 DEVELOPMENTS
9.14 OSISOFT, LLC
9.14.1 OVERVIEW
9.14.2 PRODUCTS & SERVICES
9.14.3 FINANCIALS
9.14.4 STRATEGY
9.14.5 DEVELOPMENTS
9.15 POWER PLUS COMMUNICATIONS AG
9.15.1 OVERVIEW
9.15.2 PRODUCTS & SERVICES
9.15.3 FINANCIALS
9.15.4 STRATEGY
9.16 S&C ELECTRIC COMPANY
9.16.1 OVERVIEW
9.16.2 PRODUCTS & SERVICES
9.16.3 FINANCIALS
9.16.4 STRATEGY
9.16.5 DEVELOPMENTS
9.17 SENSUS USA INC
9.17.1 OVERVIEW
9.17.2 PRODUCTS & SERVICES
9.17.3 FINANCIALS
9.17.4 STRATEGY
9.17.5 DEVELOPMENTS
9.18 SILVER SPRING NETWORKS INC.
9.18.1 OVERVIEW
9.18.2 PRODUCTS & SERVICES
9.18.3 FINANCIALS
9.18.4 STRATEGY
9.18.5 DEVELOPMENTS
9.19 SMARTSYNCH, INC.
9.19.1 OVERVIEW
9.19.2 PRODUCTS & SERVICES
9.19.3 FINANCIALS
9.19.4 STRATEGY
9.19.5 DEVELOPMENTS
9.20 STMICROELECTRONICS N.V.
9.20.1 OVERVIEW
9.20.2 PRODUCTS & SERVICES
9.20.3 FINANCIALS
9.20.4 STRATEGY
9.20.5 DEVELOPMENTS
9.21 TELVENT GIT, S.A.
9.21.1 OVERVIEW
9.21.2 PRODUCTS & SERVICES
9.21.3 FINANCIALS
9.21.4 STRATEGY
9.21.5 DEVELOPMENTS
9.22 TENDRIL NETWORKS, INC.
9.22.1 OVERVIEW
9.22.2 PRODUCTS & SERVICES
9.22.3 FINANCIALS
9.22.4 STRATEGY
9.22.5 DEVELOPMENTS
9.23 TRILLIANT INC
9.23.1 OVERVIEW
9.23.2 PRODUCTS & SERVICES
9.23.3 FINANCIALS
9.23.4 STRATEGY
9.23.5 DEVELOPMENTS
9.24 VENTYX, INC.
9.24.1 OVERVIEW
9.24.2 PRODUCTS & SERVICES
9.24.3 FINANCIALS
9.24.4 STRATEGY
9.24.5 DEVELOPMENTS
9.25 VERIZON COMMUNICATIONS INC.
9.25.1 OVERVIEW
9.25.2 PRODUCTS & SERVICES
9.25.3 FINANCIALS
9.25.4 STRATEGY
9.25.5 DEVELOPMENTS
LIST OF TABLES
TABLE 1 GLOBAL SMART GRID MARKET REVENUE, BY GEOGRAPHY, 2011 – 2016 ($MILLION)
TABLE 2 GOVERNMENT SUPPORT
TABLE 3 GLOBAL SMART GRID SOFTWARE MARKET REVENUE, BY TYPES, 2011 – 2016 ($MILLION)
TABLE 4 DMS MARKET REVENUE, BY GEOGRAPHY, 2011 – 2016 ($MILLION)
TABLE 5 NORTH AMERICA: DMS MARKET REVENUE, BY COUNTRY, 2011 – 2016 ($MILLION)
TABLE 6 EUROPE: DMS MARKET REVENUE, BY COUNTRY, 2011 – 2016 ($MILLION)
TABLE 7 APAC: DMS MARKET REVENUE, BY COUNTRY, 2011 – 2016 ($MILLION)
TABLE 8 ROW: DMS MARKET REVENUE, BY COUNTRY, 2011 – 2016 ($MILLION)
TABLE 9 DRM MARKET REVENUE, BY GEOGRAPHY, 2011 – 2016 ($MILLION)
TABLE 10 NORTH AMERICA: DRM MARKET REVENUE, BY COUNTRY, 2011 – 2016 ($MILLION)
TABLE 11 EUROPE: DRM MARKET REVENUE, BY COUNTRY, 2011 – 2016 ($MILLION)
TABLE 12 APAC: DRM MARKET REVENUE, BY COUNTRY, 2011 – 2016 ($MILLION)
TABLE 13 ROW: DRM MARKET REVENUE, BY COUNTRY, 2011 – 2016 ($MILLION)
TABLE 14 METER DATA MANAGEMENT SYSTEM MODULES
TABLE 15 MDMS MARKET REVENUE, BY GEOGRAPHY, 2011 – 2016 ($MILLION)
TABLE 16 NORTH AMERICA: MDMS MARKET REVENUE, BY COUNTRY, 2011 – 2016 ($MILLION)
TABLE 17 EUROPE: MDMS MARKET REVENUE, BY COUNTRY, 2011 – 2016 ($MILLION)
TABLE 18 APAC: MDMS MARKET REVENUE, BY COUNTRY, 2011 – 2016 ($MILLION)
TABLE 19 ROW: MDMS MARKET REVENUE, BY COUNTRY, 2011 – 2016 ($MILLION)
TABLE 20 SCADA MARKET REVENUE, BY GEOGRAPHY, 2011 – 2016 ($MILLION)
TABLE 21 NORTH AMERICA: SCADA MARKET REVENUE, BY COUNTRY, 2011 – 2016 ($MILLION)
TABLE 22 EUROPE: SCADA MARKET REVEUNE, BY COUNTRY, 2011 – 2016 ($MILLION)
TABLE 23 APAC: SCADA MARKET REVENUE, BY COUNTRY, 2011 – 2016 ($MILLION)
TABLE 24 ROW: SCADA MARKET REVENUE, BY COUNTRY, 2011 – 2016 ($MILLION)
TABLE 25 SMART METER UNIT SHIPMENTS, BY GEOGRAPHY, 2011 -2016 (MILLION UNITS)
TABLE 26 SMART METER MARKET REVENUE, BY GEOGRAPHY, 2011 – 2016 ($MILLION)
TABLE 27 SMART METER INSTALLATION: COST ANALYSIS
TABLE 28 NORTH AMERICA: SMART METER UNIT SHIPMENTS, BY COUNTRY, 2011 – 2016 (MILLION UNITS)
TABLE 29 NORTH AMERICA: SMART METER MARKET REVENUE, BY COUNTRY, 2011 – 2016 ($MILLION)
TABLE 30 EUROPE: SMART METER UNIT SHIPMENTS, BY COUNTRY, 2011 – 2016 (MILLION UNITS)
TABLE 31 EUROPE: SMART METER MARKET REVENUE, BY COUNTRY, 2011 – 2016 ($MILLION)
TABLE 32 APAC: SMART METER UNIT SHIPMENTS, BY COUNTRY, 2011 – 201 6 (MILLION UNITS)
TABLE 33 APAC: SMART METER MARKET REVENUE, BY COUNTRY, 2011 – 2016 ($MILLION)
TABLE 34 ROW: SMART METER UNIT SHIPMENTS, BY COUNTRY, 2011 – 2016 (MILLION UNITS)
TABLE 35 ROW: SMART METER MARKET REVENUE, BY COUNTRY, 2011 – 2016 ($MILLION)
TABLE 36 GLOBAL SMART SENSORS MARKET REVENUE, BY TYPES, 2011 – 2016 ($MILLION)
TABLE 37 GLOBAL MARKET REVENUE FOR SMART SENSORS, BY GEOGRAPHY, 2011 – 2016 ($MILLION)
TABLE 38 SMART GRID VOLTAGE SENSOR MARKET REVENUE, BY GEOGRAPHY, 2011 – 2016 ($MILLION)
TABLE 39 NORTH AMERICA: VOLTAGE SENSORS MARKET REVENUE FOR SMART GRID, BY COUNTRY, 2011 – 2016 ($MILLION)
TABLE 40 EUROPE: VOLTAGE SENSORS MARKET REVENUE FOR SMART GRID, BY COUNTRY, 2011 – 2016 ($MILLION)
TABLE 41 APAC: VOLTAGE SENSORS MARKET REVENUE FOR SMART GRID, BY COUNTRY, 2011 – 2016 ($MILLION)
TABLE 42 ROW: VOLTAGE SENSORS MARKET REVENUE FOR SMART GRID, BY COUNTRY, 2011 – 2016 ($MILLION)
TABLE 43 SMART GRID TRANSFORMER MONITORING SENSORS MARKET REVENUE, BY GEOGRAPHY, 2011 – 2016 ($MILLION)
TABLE 44 NORTH AMERICA: TRANSFORMER MONITORING SENSORS MARKET REVENUE FOR SMART GRID, BY COUNTRY, 2011 – 2016 ($MILLION)
TABLE 45 EUROPE: TRANSFORMER MONITORING SENSORS MARKET REVENUE, FOR SMART GRID, BY COUNTRY, 2011 – 2016 ($MILLION)
TABLE 46 APAC: TRANSFORMER MONITORING SENSORS MARKET REVENUE FOR SMART GRID, BY COUNTRY, 2011 – 2016 ($MILLION)
TABLE 47 ROW: TRANSFORMER MONITORING SENSORS MARKET REVENUE FOR SMART GRID, BY COUNTRY, 2011 – 2016 ($MILLION)
TABLE 48 DYNAMIC LINE RATING SENSORS MARKET REVENUE FOR SMART GRID, BY GEOGRAPHY 2011 – 2016 ($MILLION)
TABLE 49 NORTH AMERICA: DYNAMIC LINE RATING SENSORS MARKET REVENUE FOR SMART GRID, BY COUNTRY, 2011 – 2016 ($MILLION)
TABLE 50 EUROPE: DYNAMIC LINE RATING SENSORS MARKET REVENUE FOR SMART GRID, BY COUNTRY, 2011 – 2016 ($MILLION)
TABLE 51 APAC: SMART GRID DYNAMIC LINE RATING SENSORS MARKET REVENUE, BY COUNTRY, 2011 – 2016 ($MILLION)
TABLE 52 ROW: SMART GRID DYNAMIC LINE RATING SENSORS MARKET REVENUE , BY COUNTRY, 2011 – 2016 ($MILLION)
TABLE 53 HAN SENSORS MARKET REVENUE FOR SMART GRID, BY GEOGRAPHY, 2011 – 2016 ($MILLION)
TABLE 54 NORTH AMERICA: SMART GRID HAN SENSORS MARKET REVENUE , BY COUNTRY, 2011 – 2016 ($MILLION)
TABLE 55 EUROPE: SMART GRID HAN SENSORS MARKET REVENUE, BY COUNTRY, 2011 – 2016 ($MILLION)
TABLE 56 APAC: SMART GRID HAN SENSORS MARKET REVENUE, BY COUNTRY, 2011 – 2016 ($MILLION)
TABLE 57 ROW: SMART GRID HAN SENSORS MARKET REVENUE, BY COUNTRY, 2011 – 2016 ($MILLION)
TABLE 58 SMART GRID HAN NETWORK MARKET REVENUE, BY GEOGRAPHY, 2011 – 2016 ($MILLION)
TABLE 59 COMPARISON OF WAN TECHNOLOGIES
TABLE 60 COMPARISON OF HAN TECHNOLOGIES
TABLE 61 GLOBAL SMART GRID HAN MARKET REVENUE, BY TYPES, 2011 – 2016 ($MILLION)
TABLE 62 SMART GRID ZIGBEE MARKET REVENUE, BY GEOGRAPHY, 2011 – 2016 ($MILLION)
TABLE 63 SMART GRID Z-WAVE MARKET REVENUE, BY GEOGRAPHY, 2011 – 2016 ($MILLION)
TABLE 64 SMART GRID WI-FI MARKET REVENUE, BY GEOGRAPHY, 2011 – 2016 ($MILLION)
TABLE 65 SMART GRID OTHER COMMUNICATION TECHNOLOGIES MARKET REVENUE, BY GEOGRAPHY, 2011 – 2016 ($MILLION)
TABLE 66 NORTH AMERICA: SMART GRID MARKET REVENUE, BY TYPES, 2011 – 2016 ($MILLION)
TABLE 67 U.S.: SMART GRID MARKET REVENUE, BY TYPES, 2011 – 2016 ($MILLION)
TABLE 68 CANADA: SMART GRID NETWORK, BY TYPES, 2011 – 2016 ($MILLION)
TABLE 69 MEXICO: SMART GRID MARKET, BY TYPES, 2011 – 2016 ($MILLION)
TABLE 70 EUROPE: SMART GRID MARKET REVENUE, BY TYPES, 2011 – 2016 ($MILLION)
TABLE 71 GERMANY: SMART GRID MARKET REVENUE, BY TYPES, 2011 – 2016 ($MILLION)
TABLE 72 U.K.: SMART GRID MARKET REVENUE, BY TYPES, 2011 – 2016 ($MILLION)
TABLE 73 FRANCE: SMART GRID MARKET REVENUE, BY TYPES, 2011 – 2016 ($MILLION)
TABLE 74 ITALY SMART GRID MARKET REVENUE, BY TYPES, 2011 – 2016 ($MILLION)
TABLE 75 EUROPE (OTHERS) SMART GRID MARKET REVENUE, BY TYPES, 2011 – 2016 ($ MILLION)
TABLE 76 APAC: SMART GRID MARKET REVENUE, BY TYPES, 2011 – 2016 ($MILLION)
TABLE 77 AUSTRALIA: SMART GRID MARKET REVENUE, BY TYPES, 2011 – 2016 ($MILLION)
TABLE 78 CHINA: SMART GRID MARKET REVENUE, BY TYPES, 2011 – 2016 ($MILLION)
TABLE 79 JAPAN SMART GRID MARKET REVENUE, BY TYPES, 2011 – 2016 ($MILLION)
TABLE 80 SOUTH KOREA: SMART GRID MARKET REVENUE, BY TYPES, 2011 – 2016 ($MILLION)
TABLE 81 INDIA: SMART GRID MARKET REVENUE, BY TYPES, 2011 – 2016 ($MILLION)
TABLE 82 APAC (OTHERS): SMART GRID MARKET REVENUE, BY TYPES, 2011 – 2016 ($MILLION)
TABLE 83 ROW SMART GRID MARKET REVENUE, BY TYPES, 2011 – 2016 ($MILLION)
TABLE 84 MIDDLE EAST: SMART GRID MARKET REVENUE, BY TYPES, 2011 – 2016 ($MILLION)
TABLE 85 AFRICA: SMART GRID MARKET REVENUE, BY TYPES, 2011 – 2016 ($MILLION)
TABLE 86 ROW (OTHERS): SMART GRID MARKET REVENUE, BY TYPES, 2011 – 2016 ($MILLION)
TABLE 87 NEW PRODUCT DEVELOPMENT, 2009 - 2012
TABLE 88 MERGERS & ACQUISITIONS, 2009 – 2011
TABLE 89 PARTNERSHIPS, AGREEMENTS, COLLABORATIONS & JOINT VENTURES, 2008 - 2012
TABLE 90 OTHERS (SUPPLY CONTRACTS/CERTIFICATIONS ETC), 2008 – 2012
LIST OF FIGURES
FIGURE 1 OVERVIEW: SMART GRID TECHNOLOGY MARKET
FIGURE 2 ADVANTAGES OF A SMART GRID NETWORK
FIGURE 3 TRADITIONAL GRID VS SMART GRID
FIGURE 4 IMPACT ANALYSIS OF DRIVERS
FIGURE 5 GLOBAL ELECTRICITY CONSUMPTION, 2011 – 2016 (TWH)
FIGURE 6 IMPACT ANALYSIS OF RESTRAINTS
FIGURE 7 SMART ELECTRIC METER: MARKET SHARE ANALYSIS
FIGURE 8 ANALYSIS OF PORTER’S FIVE FORCES
FIGURE 9 GROWTH POTENTIAL OF VARIOUS SMART GRID APPLICATIONS IN 2011 & 2016
FIGURE 10 GROWTH POTENTIAL OF DIFFERENT COUNTIRES IN THE SMART GRID MARKET ACROSS THE GLOBE
FIGURE 11 AN OVERVIEW: SMART GRID SOFTWARE & HARDWARE
FIGURE 12 PROCESS OF DISTRIBUTION MANAGEMENT SYSTEM
FIGURE 13 GLOBAL DMS MARKET – Y-O-Y GROWTH RATE, 2011 – 2016 (%)
FIGURE 14 DEMAND RESPONSE MANAGEMENT
FIGURE 15 GLOBAL DRM MARKET – Y-O-Y GROWTH RATE, 2011 – 2016 (%)
FIGURE 16 PROCESS OF MDMS
FIGURE 17 GLOBAL MDMS MARKET – Y-O-Y GROWTH RATE, 2011 – 2016 (%)
FIGURE 18 GLOBAL SCADA MARKET: - Y-O-Y GROWTH RATE, 2011 – 2016 (%)
FIGURE 19 WORKING OF A SCADA NETWORK
FIGURE 20 WORKING OF SMART METER
FIGURE 21 SMART GRID SENSORS: AN OVERVIEW
FIGURE 22 COMMUNICATION NETWORK: AN OVERVIEW
FIGURE 23 GEOGRAPHICAL OVERVIEW OF THE SMART GRID MARKET
FIGURE 24 NORTH AMERICA SMART GRID MARKET REVENUE, 2011 – 2016 ($MILLION)
FIGURE 25 EUROPE: SMART GRID MARKET REVENUE, 2011 – 2016 ($MILLION)
FIGURE 26 APAC: SMART GRID MARKET REVENUE, BY COUNTRY, 2011 – 2016 ($MILLION)
FIGURE 27 ROW: SMART GRID MARKET REVENUE, BY COUNTRY, 2011 – 2016 ($MILLION)
FIGURE 28 KEY GROWTH STRATEGIES – 2009 – 2012
FIGURE 29 ECHELON: REVENUE ANALYSIS 2008-2010
FIGURE 30 ELSTER GROUP: REVENUE ANALYSIS, 2008-2010
FIGURE 31 GE ENERGY: REVENUE ANALYSIS, 2008-2010
FIGURE 32 IBM CORP: REVENUE ANALYSIS, 2009-2010
FIGURE 33 ITRON: REVENUE ANALYSIS, 2008-2010
FIGURE 34 SENSUS: REVENUE ANALYSIS, 2008-2010
FIGURE 35 STMICROELECTRONICS: REVENUE ANALYSIS, 2009-2010
FIGURE 36 TELVENT: REVENUE ANALYSIS, 2009-2010


Growth opportunities and latent adjacency in Smart Grid Technology Market