The study involved major activities in estimating the current size of the Smart Grid market. Exhaustive secondary research was done to collect information on the peer and parent markets. The next step was to validate these findings, assumptions, and sizing with industry experts across the value chain through primary research. Both top-down and bottom-up approaches were employed to estimate the complete market size. Thereafter, market breakdown and data triangulation were used to estimate the market size of the segments and subsegments.
Secondary Research
This research study on the Smart Grid market involved the use of extensive secondary sources, directories, and databases, such as the International Organization for Standardization (ISO), the International Electrotechnical Commission (IEC), the American National Standards Institute (ANSI), the Geography Markup Language (GML) to identify and collect information useful for a technical, market-oriented, and commercial study of the global Smart Grid market. The other secondary sources included annual reports, press releases & investor presentations of companies, white papers, certified publications, articles by recognized authors, manufacturer associations, trade directories, and databases.
Primary Research
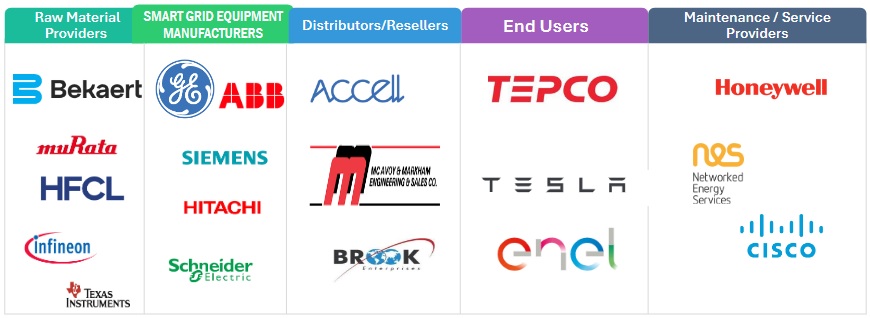
The Smart Grid market comprises several stakeholders such as smart grid manufacturers, manufacturers of subcomponents of smart grid, manufacturing technology providers, and technology support providers in the supply chain. The increased use of energy sources worldwide, especially in industrial and commercial projects, is driving up demand for smart grid. Smart grid technology attracts customers from the public and private sectors owing to its several benefits providing numerous opportunities for building smart infrastructure. Utility providers, solution providers, electronic device manufacturers, and system integrators are developing cost-effective and reliable solutions in the emerging smart grid market.

To know about the assumptions considered for the study, download the pdf brochure
Market Size Estimation
Both top-down and bottom-up approaches were used to estimate and validate the total size of the smart grid market. These methods were also used extensively to estimate the size of various subsegments in the market. The research methodology used to estimate the market size includes the following:
-
The key players in the industry and market have been identified through extensive secondary research, and their market share in the respective regions have been determined through both primary and secondary research.
-
The industry’s value chain and market size, in terms of value, have been determined through primary and secondary research processes.
-
All percentage shares, splits, and breakdowns have been determined using secondary sources and verified through primary sources.
Global Smart Grid Market Size: Top-down Approach

To know about the assumptions considered for the study, Request for Free Sample Report
Global Smart Grid Market Size: Bottom-Up Approach

Data Triangulation
After arriving at the overall market size from the estimation process explained above, the total market has been split into several segments and subsegments. To complete the overall market engineering process and arrive at the exact statistics for all the segments and subsegments, the data triangulation and market breakdown processes have been employed, wherever applicable. The data has been triangulated by studying various factors and trends from both the demand- and supply sides. Along with this, the market has been validated using both the top-down and bottom-up approaches.
Market Definition
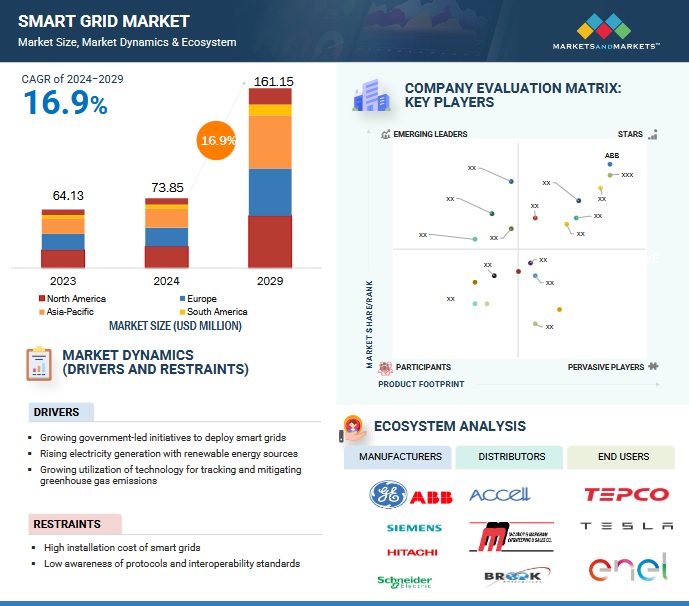
A smart grid is an electricity network enhanced with digital technology to enable advanced monitoring, automation, control, and management of energy transmission, distribution, power generation, and network supply. This technology facilitates the evolution from traditional energy distribution to an intelligent electricity grid, allowing two-way communication between utility providers and their customers. Smart grid systems employ digital communication technologies, information systems, and automation to monitor energy flow and adjust to changes in energy demand and supply. By integrating smart metering systems, it enables real-time monitoring of power consumption, offering both consumers and suppliers real-time data on energy use. Consequently, the smart grid enhances system efficiency and reduces operational costs.
Key Stakeholders
-
Energy utilities
-
Power service providers
-
Solution vendors
-
Original equipment manufacturers (OEMs)
-
Government agencies
-
Managed service providers (MSPs)
-
System integrators
-
Consultancy firms/advisory firms
-
Investors and venture capitalists
-
Independent software vendors
-
Value-added resellers (VARs) and distributors
-
Governments and urban planning agencies
Objectives of the Study
-
To define, describe, segment, and forecast the smart grid market, in terms of component, application, communication technology, and region.
-
To forecast the market size for five key regions: North America, South America, Europe, Asia Pacific, and Middle East & Africa, along with their key countries
-
To provide detailed information about the key drivers, restraints, opportunities, and challenges influencing the growth of the market
-
To strategically analyze the subsegments with respect to individual growth trends, prospects, and contributions of each segment to the overall market size
-
To analyze market opportunities for stakeholders and the competitive landscape of the market
-
To strategically profile the key players and comprehensively analyze their market shares and core competencies
-
To analyze competitive developments, such as deals and agreements in the market
Available Customizations:
With the given market data, MarketsandMarkets offers customizations as per the client’s specific needs. The following customization options are available for this report:
Geographic Analysis
-
Further breakdown of region or country-specific analysis
Company Information
-
Detailed analyses and profiling of additional market players (up to 5)


 HIGHEST CAGR MARKET IN 2024-2030
 US LARGEST MARKET IN REGION
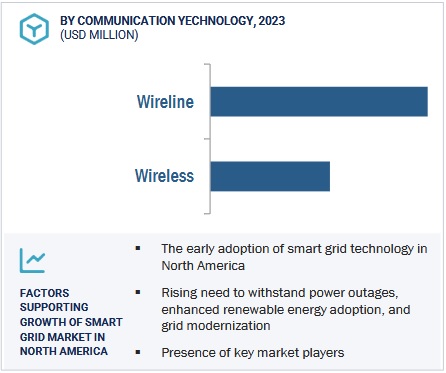


Christopher
Jun, 2022
Which market segment is expected to shape the future of the Smart Grid Market?.
Lucas
Jul, 2022
Smart Grid Market report includes Market Estimates, CAGRs and Forecasts, Rising demand in the Emerging Markets, Opportunity analysis in market for key stakeholders by identification of high growth segments, Trend analysis and study of drivers and restraints that will affect the global landscaps, Key playing fields and burning issues in sector, Market share, contracts & developments, strategies, product innovations of key companies/players and Competition mapping.
Girish
Jul, 2022
Smart Grid Market was published in Oct 2021, and it covers the market trends and growth factors with respect to Smart Grid Market. It also covered the Market estimations of Smart Grid in terms of Value by Component/Application/ Communication Technology at regional and country level for the period 2019-2026. The report also covers the detail competitive landscape with key players Market Share Analysis, Developments of Key Market Players Like There Contracts & Agreements, Investments & Expansions, Joint Venture, Partnerships, And Collaborations and their Business Overview, Products/solutions/services Offered, Recent Developments, SWOT Analysis..