Special Effect Pigments Market by Type (Metallic, Pearlescent), Application (Plastics, Paints & Coatings, Printing Inks, Cosmetics), and Region - Global Forecast to 2022


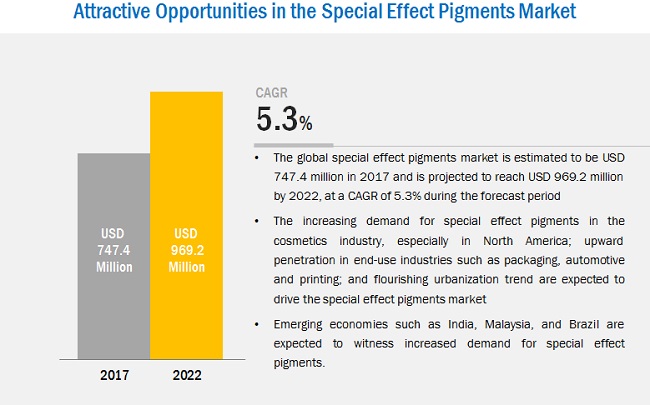
The special effect pigments market is projected to reach USD 969.2 Million by 2022, at a CAGR of 5.3%. The base year considered for the study is 2016 while the forecast period is from 2017 to 2022. The special effect pigments market is driven by the increasing demand for special effect pigments from applications such as paints & coatings, plastics, printing inks, cosmetics, and others. The report includes an analysis of the special effect pigment market by region, namely, North America, Europe, Asia-Pacific, Middle East & Africa, and South America.
Objectives of the Special Effect Pigments Market Study:
- To define, describe, and forecast the special effect pigments market on the basis of type, application, and region
- To provide detailed information about the key factors influencing the growth of the market (drivers, restraints, opportunities, and challenges)
- To strategically analyze micromarkets1 with respect to individual growth trends, future prospects, and contribution to the total market
- To analyze the opportunities in the market for stakeholders and provide a competitive landscape for market leaders
- To strategically profile key players and comprehensively analyze their market shares and core competencies2
Note1: Micromarkets are the subsegments of the special effect pigment market included in the report
Note2: Core competencies of companies are determined in terms of their key developments, key strategies adopted by them to sustain in the market
The top-down and bottom-up both approaches have been used to estimate and validate the size of the global special effect pigments market and to estimate the size of various other dependent submarkets. The research study involved the use of extensive secondary sources, directories, and databases such as Hoovers, Bloomberg, Chemical Weekly, Factiva, Commonwealth Scientific and Industrial Research Organization (CSIRO), Securities And Exchange Commission (SEC), American National Standards Institute (ANSI), Organization for Economic Co-operation and Development (OECD), and other government and private websites, to identify and collect information useful for the technical, market-oriented, and commercial study of the special effect pigments market.
To know about the assumptions considered for the study, download the pdf brochure
Key Target Audience in Special Effect Pigments Market
- Manufacturers of special effect pigments
- Traders, Distributors, and Suppliers of special effect pigments
- Regional Manufacturers’ Associations and General Special Effect Pigments Associations
- Government and Regional Agencies and Research Organizations
- Investment Research Firms
“This study answers several questions for the stakeholders, primarily which market segments they should focus upon during the next two to five years to prioritize their efforts and investments”.
Special Effect Pigments Market Report Scope
- This research report categorizes the special effect pigments market on the basis of type, application, and region.
Based on Type:
- Metallic Pigments
- Pearlescent Pigments
- Others
Based on Application:
- Paints & Coatings
- Plastics
- Printing Inks
- Cosmetics
- Others
Based on Region:
- North America
- Europe
- Asia-Pacific
- Middle East & Africa
- South America
- The market is further analyzed for the key countries in each of these regions.
Special Effect Pigments Market Report Available Customizations
With the given market data, MarketsandMarkets offers customizations according to the company’s specific needs. The following customization options are available for the report:
Regional Analysis:
Country-level analysis of the special effect pigments market is provided by application.
Company Information:
Detailed analysis and profiles of additional market players.
The global special effect pigments market is projected to reach USD 969.2 Million by 2022 at a CAGR of 5.3%, in terms of value. The special effect pigment market has witnessed high growth in recent years, and this growth is projected to persist in the coming years as well. Special effect pigments are used in a wide range of applications such as paints & coatings, plastics, printing inks, cosmetics, and others, as these impart properties such as enhanced appearance, excellent glitter, shimmer, shine, and luster to products.
Different types of special effect pigments are also covered in the report. The main types are metallic pigments and pearlescent pigments. The metallic pigments type segment accounted for the largest market share in 2016, due to their suitability in several application areas, while pearlescent pigments is projected to be the fastest-growing type segment in the special effect pigments market, in terms of value and volume, due to its increasing acceptance in various applications such as cosmetics and paints & coatings. Metallic pigments are used to achieve metallic effects such as gold, silver, and chrome, among others. The demand for pearlescent pigments is projected to grow on account of the increasing consumption of cosmetic products and rising disposable incomes of consumers.
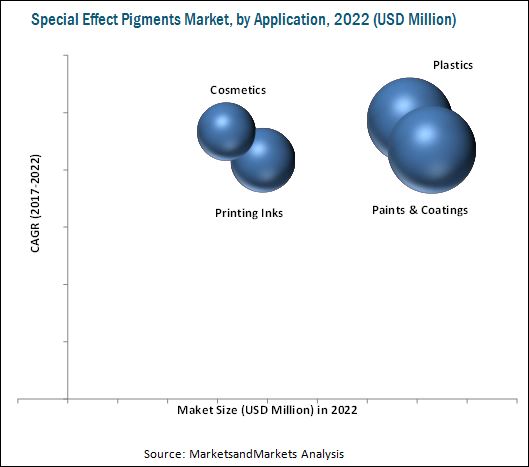
Special effect pigments are used in various applications such as paints & coatings, plastics, printing inks, cosmetics, and others, which are the major applications considered in the report. In 2016, the paints & coatings application accounted for the largest market share, in terms of value and volume, followed by plastics, printing inks, cosmetics, and others. The plastics application is projected to grow at the highest CAGR from 2017 to 2022 among all the applications considered.
North America, Europe, Asia-Pacific, Middle East & Africa, and South America are the main regions considered for the special effect pigments market in the report. The Asia-Pacific is the largest special effect pigments market. The rising demand for special effect pigments in this region is mainly driven by their increased use in the packaging, cosmetics, and household goods industries. North America is the second-largest consumer and manufacturer of special effect pigments, globally. The Asia-Pacific region is the fastest-growing region in the special effect pigments market. Paints & coatings and plastics are the top two applications contributing to the growing demand for special effect pigments globally.
Though the special effect pigments market is growing at a high rate, a few factors such as the high price of raw materials, shift of the end-use market from developed countries to emerging countries, and the rising cost of production hinder the growth of the market, globally.
Key Players in Special Effect Pigments Market
BASF SE (Germany), Clariant AG (Switzerland), Huntsman Corporation (U.S.), Altana AG (Germany), Merck KGaA (Germany), and Sudarshan Chemical Industries (India) are the leading players in this market. These companies are projected to account for a major share of the market in the near future. Entering into related industries and targeting new markets will enable special effect pigment manufacturers to overcome the effects of volatile economies, leading to diversified business portfolios and increase in revenues. Other major special effect pigment manufacturers are, DIC Corporation (Japan), Geotech International B.V. (Netherlands), Sensient Industrial Colors (U.K.), and Kolortek Co., Ltd. (China).
To speak to our analyst for a discussion on the above findings, click Speak to Analyst
 Exclusive indicates content/data unique to MarketsandMarkets and not available with any competitors.
Table of Contents
1 Introduction (Page No. - 15)
1.1 Objectives of the Study
1.2 Market Definition
1.3 Market Scope
1.3.1 Markets Covered
1.3.2 Years Considered for the Study
1.4 Currency
1.5 Limitations
1.6 Stakeholders
2 Research Methodology (Page No. - 18)
2.1 Research Data
2.1.1 Secondary Data
2.1.1.1 Key Data From Secondary Sources
2.1.2 Primary Data
2.1.2.1 Key Data From Primary Sources
2.1.2.2 Key Industry Insights
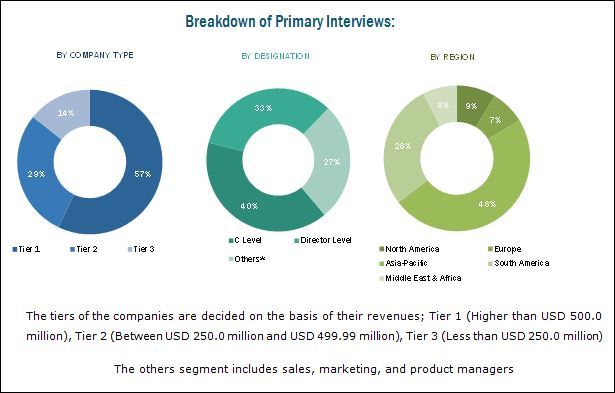
2.1.2.3 Breakdown of Primary Interviews
2.2 Market Size Estimation
2.2.1 Bottom-Up Approach
2.2.2 Top-Down Approach
2.3 Data Triangulation
2.4 Research Assumptions
3 Executive Summary (Page No. - 26)
4 Premium Insights (Page No. - 31)
4.1 Significant Opportunities in the Special Effect Pigments Market Between 2017 and 2022
4.2 Special Effect Pigment Market, By Type
4.3 Special Effect Pigments Market Share in Asia-Pacific, By Application and Country
4.4 Special Effect Pigment Market Share, By Application and Region
4.5 Special Effect Pigments Market Attractiveness
5 Market Overview (Page No. - 34)
5.1 Introduction
5.2 Market Dynamics
5.2.1 Drivers
5.2.1.1 Increased Demand for Product Differentiation and Improved Appearance
5.2.1.2 Emerging Demand From Cosmetics and Personal Care Industries
5.2.1.3 Rapid Growth in Paints & Coatings and Plastics Industries Due to Increasing Urbanization
5.2.2 Restraints
5.2.2.1 Volatile Raw Material Prices
5.2.2.2 Stringent Environmental Regulations on Toxic Metals
5.2.3 Opportunities
5.2.3.1 Growing Demand for Bio-Based Special Effect Pigments
5.3 Porter’s Five Forces Analysis
5.3.1 Threat of New Entrants
5.3.2 Threat of Substitutes
5.3.3 Bargaining Power of Buyers
5.3.4 Bargaining Power of Suppliers
5.3.5 Intensity of Competitive Rivalry
6 Macroeconomic Overview and Key Trends (Page No. - 40)
6.1 Introduction
6.2 Trends and Forecast of GDP
6.3 Trends and Forecast of Construction Industry
6.3.1 Trends and Forecast of Construction Industry in North America
6.3.2 Trends and Forecast of Construction Industry in Europe
6.3.3 Trends and Forecast of Construction Industry in Asia-Pacific
6.3.4 Trends and Forecast of Construction Industry in Middle East & Africa
6.3.5 Trends and Forecast of Construction Industry in South America
6.4 Trends of Automotive Industry
7 Special Effect Pigments Market, By Effect (Page No. - 45)
7.1 Introduction
7.2 Pearlescent
7.3 Fluorescent
7.4 Phosphorescent
7.5 Others
8 Special Effect Pigment Market, By Type (Page No. - 46)
8.1 Introduction
8.2 Metallic Pigments
8.2.1 Aluminum Pigments
8.2.1.1 Leafing Pigments
8.2.1.2 Non-Leafing Pigments
8.2.2 Bronze Pigments
8.2.3 Chrome Pigments
8.2.4 Gold Pigments
8.2.5 Silver Pigments
8.3 Pearlescent Pigments
8.3.1 Mica Base
8.3.2 Titanium Dioxide
8.4 Others
9 Special Effect Pigments Market, By Application (Page No. - 51)
9.1 Introduction
9.2 Paints & Coatings
9.3 Printing Inks
9.4 Plastics
9.5 Cosmetics
9.6 Others
10 Special Effect Pigments Market, By Region (Page No. - 55)
10.1 Introduction
10.2 Asia-Pacific
10.2.1 China
10.2.2 India
10.2.3 Japan
10.2.4 South Korea
10.2.5 Thailand
10.2.6 Indonesia
10.2.7 Malaysia
10.2.8 Rest of Asia-Pacific
10.3 North America
10.3.1 U.S.
10.3.2 Canada
10.3.3 Mexico
10.4 Europe
10.4.1 Germany
10.4.2 France
10.4.3 Italy
10.4.4 U.K.
10.4.5 Spain
10.4.6 Russia
10.4.7 Rest of Europe
10.5 Middle East & Africa
10.5.1 Saudi Arabia
10.5.2 South Africa
10.5.3 UAE
10.5.4 Rest of Middle East & Africa
10.6 South America
10.6.1 Brazil
10.6.2 Argentina
10.6.3 Rest of South America
11 Competitive Landscape (Page No. - 95)
11.1 Introduction
11.1.1 Dynamic
11.1.2 Innovators
11.1.3 Vanguards
11.1.4 Emerging
11.2 Competitive Benchmarking
11.3 Product Offerings (25 Players)
11.4 Business Strategy (25 Players)
11.5 Market Share Analysis
12 Company Profiles (Page No. - 100)
(Overview, Financial*, Products & Services, Strategy, and Developments)
12.1 BASF SE
12.2 Clariant AG
12.3 Huntsman Corporation
12.4 Altana AG
12.5 Merck KGaA
12.6 Sudarshan Chemical Industries
12.7 Dic Corporation
12.8 Sensient Industrial Colors
12.9 Geotech International B.V.
12.10 Kolortek Co., Ltd
12.11 Other Players
12.11.1 Kobo Products Inc.
12.11.2 Ferro Corporation
12.11.3 Cabot Corporation
12.11.4 Nemoto & Co., Ltd.
12.11.5 Dainichiseika Color & Chemicals Mfg. Co. Ltd
12.11.6 Siberline Manufacturing Co. Inc
12.11.7 Toyal Europe
12.11.8 Special Effects & Coatings
12.11.9 Mono Pigment Developments Ltd.
12.11.10 Toyocolor Co., Ltd.
12.11.11 E.I. Du Pont De Nemours and Company
12.11.12 Flint Group Pigments
12.11.13 Carlfors Burk AB
12.11.14 The Chemours Company
12.11.15 Dayglo Color Corp.
*Details Might Not Be Captured in Case of Unlisted Companies.
13 Appendix (Page No. - 128)
13.1 Insights From Industry Experts
13.2 Discussion Guide
13.3 Knowledge Store: Marketsandmarkets Subscription Portal
13.4 Introducing RT: Real-Time Market Intelligence
13.5 Available Customizations
13.6 Related Reports
13.7 Author Details
List of Tables (83 Tables)
Table 1 Trends and Forecast of GDP, 2016–2022 (USD Billion)
Table 2 Contribution of Construction Industry to GDP of North America, 2014–2021 (USD Billion)
Table 3 Contribution of Construction Industry to GDP of Europe, 2014–2021 (USD Billion)
Table 4 Contribution of Construction Industry to GDP of Asia-Pacific, 2014–2021 (USD Billion)
Table 5 Contribution of Construction Industry to GDP of Middle East & Africa, 2014–2021 (USD Billion)
Table 6 Contribution of Construction Industry to GDP of South America, 2014–2021 (USD Billion)
Table 7 Automotive Production, 2011–2015 (Million Units)
Table 8 Special Effect Pigments Market Size, By Type, 2015–2022 (Kiloton)
Table 9 Special Effect Pigment Market Size, By Type, 2015–2022 (USD Million)
Table 10 Special Effect Pigments Market Size, By Application, 2015–2022 (Kiloton)
Table 11 Special Effect Pigment Market Size, By Application, 2015–2022 (USD Million)
Table 12 Special Effect Pigments Market, By Region, 2016-2022 (Kiloton)
Table 13 Special Effect Pigment Market, By Region, 2015-2022 (USD Million)
Table 14 Asia-Pacific: By Market Size, By Country, 2015–2022 (Kiloton)
Table 15 Asia-Pacific: By Market Size, By Country, 2015–2022 (USD Million)
Table 16 Asia-Pacific: By Market Size, By Application, 2015–2022 (Kiloton)
Table 17 Asia-Pacific: By Market Size, By Application, 2015–2022 (USD Million)
Table 18 China: By Market Size, By Application, 2015–2022 (Kiloton)
Table 19 China: By Market Size, By Application, 2015–2022 (USD Million)
Table 20 India: By Market Size, By Application, 2015–2022 (Kiloton)
Table 21 India: By Market Size, By Application, 2015–2022 (USD Million)
Table 22 Japan: By Market Size, By Application, 2015–2022 (Kiloton)
Table 23 Japan: By Market Size, By Application, 2015–2022 (USD Million)
Table 24 South Korea: By Market Size, By Application, 2015–2022 (Kiloton)
Table 25 South Korea: By Market Size, By Application, 2015–2022 (USD Million)
Table 26 Thailand: By Market Size, By Application, 2015–2022 (Kiloton)
Table 27 Thailand: By Market Size, By Application, 2015–2022 (USD Million)
Table 28 Indonesia: By Market Size, By Application, 2015–2022 (Kiloton)
Table 29 Indonesia: By Market Size, By Application, 2015–2022 (USD Million)
Table 30 Malaysia: By Market Size, By Application, 2015–2022 (Kiloton)
Table 31 Malaysia: By Market Size, By Application, 2015–2022 (USD Million)
Table 32 Rest of Asia-Pacific: By Market Size, By Application, 2015–2022 (Kiloton)
Table 33 Rest of Asia-Pacific: By Market Size, By Application, 2015–2022 (USD Million)
Table 34 North America: By Market Size, By Country, 2015–2022 (Kiloton)
Table 35 North America: By Market Size, By Country, 2015–2022 (USD Million)
Table 36 North America: By Market Size, By Application, 2015–2022 (Kiloton)
Table 37 North America: By Market Size, By Application, 2015–2022 (USD Million)
Table 38 U.S.: By Market Size, By Application, 2015–2022 (Kiloton)
Table 39 U.S.: By Market Size, By Application, 2015–2022 (USD Million)
Table 40 Canada: By Market Size, By Application, 2015–2022 (Kiloton)
Table 41 Canada: By Market Size, By Application, 2015–2022 (USD Million)
Table 42 Mexico: By Market Size, By Application, 2015–2022 (Kiloton)
Table 43 Mexico: By Market Size, By Application, 2015–2022 (USD Million)
Table 44 Europe: By Market Size, By Country, 2015–2022 (Kiloton)
Table 45 Europe: By Market Size, By Country, 2015–2022 (USD Million)
Table 46 Europe: By Market Size, By Application, 2015–2022 (Kiloton)
Table 47 Europe: By Market Size, By Application, 2015–2022 (USD Million)
Table 48 Germany: By Market Size, By Application, 2015–2022 (Kiloton)
Table 49 Germany: By Market Size, By Application, 2015–2022 (USD Million)
Table 50 France: By Market Size, By Application, 2015–2022 (Kiloton)
Table 51 France: By Market Size, By Application, 2015–2022 (USD Million)
Table 52 Italy: By Market Size, By Application, 2015–2022 (Kiloton)
Table 53 Italy: By Market Size, By Application, 2015–2022 (USD Million)
Table 54 U.K.: By Market Size, By Application, 2015–2022 (Kiloton)
Table 55 U.K.: By Market Size, By Application, 2015–2022 (USD Million)
Table 56 Spain: By Market Size, By Application, 2015–2022 (Kiloton)
Table 57 Spain: By Market Size, By Application, 2015–2022 (USD Million)
Table 58 Russia: By Market Size, By Application, 2015–2022 (Kiloton)
Table 59 Russia: By Market Size, By Application, 2015–2022 (USD Million)
Table 60 Rest 0f Europe: By Market Size, By Application, 2015–2022 (Kiloton)
Table 61 Rest 0f Europe: By Market Size, By Application, 2015–2022 (USD Million)
Table 62 Middle East & Africa: By Market Size, By Country, 2015–2022 (Kiloton)
Table 63 Middle East & Africa: By Market Size, By Country, 2015–2022 (USD Million)
Table 64 Middle East & Africa: By Market Size, By Application, 2015–2022 (Kiloton)
Table 65 Middle East & Africa: By Market Size, By Application, 2015–2022 (USD Million)
Table 66 Saudi Arabia: By Market Size, By Application, 2015–2022 (Kiloton)
Table 67 Saudi Arabia: By Market Size, By Application, 2015–2022 (USD Million)
Table 68 South Africa: By Market Size, By Application, 2015–2022 (Kiloton)
Table 69 South Africa: By Market Size, By Application, 2015–2022 (USD Million)
Table 70 UAE: By Market Size, By Application, 2015–2022 (Kiloton)
Table 71 UAE: By Market Size, By Application, 2015–2022 (USD Million)
Table 72 Rest of Middle East and Africa: By Market Size, By Application, 2015–2022 (Kiloton)
Table 73 Rest of Middle East and Africa: By Market Size, By Application, 2015–2022 (USD Million)
Table 74 South America: By Market Size, By Country, 2015–2022 (Kiloton)
Table 75 South America: By Market Size, By Country, 2015–2022 (USD Million)
Table 76 South America: By Market Size, By Application, 2015–2022 (Kiloton)
Table 77 South America: By Market Size, By Application, 2015–2022 (USD Million)
Table 78 Brazil: By Market Size, By Application, 2015–2022 (Kiloton)
Table 79 Brazil: By Market Size, By Application, 2015–2022 (USD Million)
Table 80 Argentina: By Market Size, By Application, 2015–2022 (Kiloton)
Table 81 Argentina: By Market Size, By Application, 2015–2022 (USD Million)
Table 82 Rest of South America: By Market Size, By Application, 2015–2022 (Kiloton)
Table 83 Rest of South America: By Market Size, By Application, 2015–2022 (USD Million)
List of Figures (32 Figures)
Figure 1 Special Effect Pigments Market Segmentation
Figure 2 Special Effect Pigment Market: Research Methodology
Figure 3 Bottom-Up Approach
Figure 4 Top-Down Approach
Figure 5 Data Triangulation
Figure 6 Assumptions
Figure 7 Paints & Coatings Application to Lead the Special Effect Pigments Market
Figure 8 The Metallic Pigments Type to Lead the Special Effect Pigment Market
Figure 9 The Market in Asia-Pacific is to Register the Highest CAGR Between 2017 and 2022
Figure 10 The Market in the U.S. to Leads the Global Special Effect Pigments Market Till 2022
Figure 11 Asia-Pacific Dominated the Global Special Effect Pigment Market, 2016
Figure 12 Special Effect Pigments Market to Witness Rapid Growth Between 2017 and 2022
Figure 13 Pearlescent Pigments to Register the Highest CAGR During the Forecast Period
Figure 14 China Accounted for the Largest Market Share (Volume) in 2016
Figure 15 Paints & Coatings Accounted for the Largest Market Share (Volume) in 2016
Figure 16 Asia-Pacific to Be the Fastest-Growing Special Effect Pigment Market Between 2017 and 2022
Figure 17 Increased Demand for Product Differentiation and Improved Appearance of Products is Driving the Market
Figure 18 Porter’s Five Forces Analysis: Special Effect Pigments Market
Figure 19 Metallic Pigments is Estimated to Dominate the Special Effect Pigment Market in 2017
Figure 20 Plastics Application is Expected to Witness Rapid Growth Between 2017 and 2022
Figure 21 India, China, and Japan are Emerging as the New Hotspots in the Global Special Effect Pigments Market, 2017–2022
Figure 22 Asia-Pacific to Be the Fastest-Growing Market for Special Effect Pigments
Figure 23 Special Effect Pigment Market: Regional Snapshot (2016)
Figure 24 Dive Chart
Figure 25 BASF SE Accounted for the Largest Share of the Special Effect Pigments for Cosmetics Application Market 2016
Figure 26 BASF SE: Company Snapshot
Figure 27 Clariant: Company Snapshot
Figure 28 Huntsman Corporation: Company Snapshot
Figure 29 Altana AG : Company Snapshot
Figure 30 Merck KGaA : Company Snapshot
Figure 31 Sudarshan Chemicals: Company Snapshot
Figure 32 Dic Corporation: Company Snapshot


Growth opportunities and latent adjacency in Special Effect Pigments Market