Spectroscopy IR Detector Market by Detector Technology (DTGS, MCT, InGaAs), Spectrum Sensitivity (NIR, Mid IR, and Far IR), Cooling Requirement (Cooled and Uncooled), Product Type (Benchtop, Portable, Hyphenated) - Global Forecast to 2035


Spectroscopy IR Detector Market Summary
The Spectroscopy IR Detector Market is positioned for steady expansion as demand for precise, fast, and non-destructive material analysis increases across pharmaceuticals, chemicals, food and beverages, environmental monitoring, semiconductor manufacturing, and research laboratories. The global market is estimated at approximately USD 1.1 billion in 2025 and is projected to reach nearly USD 1.8 billion by 2035, registering a CAGR of about 5%–6% during the forecast period. Growth is being supported by the adoption of infrared spectroscopy for real-time quality control, process monitoring, contamination detection, and chemical identification. Increasing laboratory automation, integration of AI-enabled analytical software, IoT-connected instruments, cloud-based data management, and digital transformation across industrial laboratories are further strengthening demand for advanced IR detector technologies.
Spectroscopy IR detectors convert infrared radiation into measurable electrical signals, enabling analytical instruments to identify molecular characteristics and quantify chemical compositions. Improvements in detector sensitivity, miniaturization, response speed, thermal stability, and spectral range are expanding their use beyond conventional laboratory instruments into portable analyzers, industrial process systems, medical diagnostics, environmental sensing, and semiconductor applications. As industries increasingly prioritize automated and data-driven measurement, IR detectors are becoming an important component of modern analytical platforms.
Key Market Trends & Insights
The Spectroscopy IR Detector Market is experiencing several structural changes as spectroscopy systems become more connected, compact, and intelligent. North America currently represents a major market because of its established pharmaceutical, biotechnology, chemical, semiconductor, and research infrastructure. The region benefits from strong investments in analytical instrumentation and laboratory automation.
Asia Pacific is expected to record the fastest growth through 2035. Expansion of pharmaceutical manufacturing, chemical processing, food testing, electronics production, and environmental monitoring in China, Japan, South Korea, and other Asian economies is creating new opportunities for spectroscopy equipment and IR detector suppliers.
The mid-infrared detector segment remains important because mid-IR spectroscopy provides strong molecular fingerprinting capabilities. However, near-infrared and extended-spectrum detector technologies are gaining traction in applications requiring rapid, non-destructive measurement.
AI is increasingly being incorporated into spectroscopy workflows to identify spectral patterns, classify materials, detect anomalies, and automate interpretation. IoT connectivity is also enabling remote instrument monitoring, predictive maintenance, centralized data collection, and integration with laboratory information management systems.
Miniaturized and uncooled detector technologies are another important trend. These solutions can reduce instrument size, energy consumption, and system complexity, supporting portable spectroscopy devices and distributed industrial sensing applications.
Market Size & Forecast
-
Base year market size: USD 1.1 billion in 2025
-
Forecast value by 2035: USD 1.8 billion
-
Expected CAGR: 5%–6%
-
Primary growth factors: Increasing adoption of infrared spectroscopy, laboratory automation, pharmaceutical quality control, environmental testing, industrial process monitoring, and semiconductor manufacturing.
-
Technology opportunity: AI-enabled spectral interpretation, IoT connectivity, miniaturized detectors, cloud analytics, and automated calibration are expected to create additional growth opportunities.
Spectroscopy IR Detector Market Top 10 key takeaway
-
The global Spectroscopy IR Detector Market is expected to grow from approximately USD 1.1 billion in 2025 to USD 1.8 billion by 2035.
-
The market is projected to expand at a CAGR of approximately 5%–6% during the forecast period.
-
North America remains a leading regional market because of advanced analytical laboratories and strong industrial demand.
-
Asia Pacific is expected to be the fastest-growing region through 2035.
-
Pharmaceutical and biotechnology applications represent major demand centers for IR detector technologies.
-
Mid-infrared detectors remain highly important for molecular identification and chemical analysis.
-
AI is improving automated spectral interpretation, classification, and anomaly detection.
-
IoT-connected spectroscopy systems are supporting remote monitoring and predictive maintenance.
-
Miniaturized and uncooled detectors are creating opportunities for portable and field-deployable spectroscopy systems.
-
Semiconductor, environmental, food safety, and industrial process applications are expected to broaden the addressable market.
Product Insights
The Spectroscopy IR Detector Market includes detector technologies designed for different infrared wavelength ranges, sensitivity requirements, operating environments, and spectroscopy platforms. Mid-infrared detectors represent a significant product category because the mid-IR region contains characteristic molecular absorption bands that are highly useful for chemical identification and compositional analysis. These detectors are widely used in Fourier-transform infrared spectroscopy and other analytical systems serving pharmaceutical, chemical, petrochemical, food, and research applications.
Near-infrared detectors are also gaining importance because NIR spectroscopy enables rapid and non-destructive analysis with limited sample preparation. Applications include agricultural analysis, pharmaceutical formulation, food quality inspection, moisture measurement, and process monitoring. Their ability to support rapid measurements makes NIR systems attractive for automated manufacturing environments.
Thermal detectors, photonic detectors, and semiconductor-based detector technologies continue to evolve. The development of compact detector modules with improved signal-to-noise ratios is allowing manufacturers to design smaller spectroscopy instruments without compromising analytical performance. Uncooled detector configurations are particularly attractive for portable systems because they can reduce the need for complex cooling arrangements.
AI integration is further increasing the value of detector systems. Intelligent software can compensate for signal variations, identify spectral signatures, classify samples, and provide automated analytical recommendations. As these capabilities improve, detector hardware is increasingly being evaluated together with software, connectivity, and data-processing capabilities rather than as an isolated component.
Technology / Component Insights
Detector technology is one of the most important differentiating factors in the Spectroscopy IR Detector Market. Mercury cadmium telluride (MCT), indium gallium arsenide (InGaAs), lead sulfide (PbS), lead selenide (PbSe), thermopile, pyroelectric, and related semiconductor technologies serve different spectral ranges and application requirements.
MCT detectors are valued for their high sensitivity and broad mid-infrared performance, particularly in demanding research and analytical applications. InGaAs detectors are widely associated with near-infrared applications where high-speed response and sensitivity are important. Thermal and pyroelectric detectors provide advantages in areas where robustness, broad spectral response, and cost considerations are priorities.
AI and machine learning are increasingly becoming part of the analytical technology stack. Instead of relying entirely on manual interpretation, spectroscopy platforms can use trained algorithms to compare measured spectra against reference libraries, identify deviations, and support automated quality decisions. This capability is particularly valuable in high-throughput laboratories.
IoT connectivity enables spectroscopy systems to transmit instrument health information, usage data, calibration status, and measurement results to centralized platforms. Cloud connectivity can facilitate collaborative analysis and long-term data storage. In manufacturing environments, detector-based measurement systems can also be integrated with industrial automation and process-control architectures.
Future innovations are likely to emphasize higher detectivity, lower noise, broader spectral coverage, lower power consumption, and greater miniaturization. Advances in semiconductor materials, microfabrication, optical filtering, and signal processing are expected to improve detector performance while reducing system size.
Application Insights
Pharmaceutical and biotechnology applications represent an important growth area for the Spectroscopy IR Detector Market. Infrared spectroscopy is widely used for raw-material identification, formulation analysis, process monitoring, contamination detection, and quality assurance. The growing emphasis on continuous manufacturing and real-time release testing is increasing demand for analytical technologies capable of providing rapid and reliable measurements.
Chemical and petrochemical industries are another significant application segment. IR detectors support chemical identification, concentration measurement, process monitoring, and detection of unwanted compounds. As industrial facilities adopt automation and digital process management, spectroscopy systems can increasingly operate as connected sensors rather than standalone laboratory instruments.
Food and beverage manufacturers are adopting infrared analysis for moisture, fat, protein, sugar, and other compositional measurements. The ability to perform rapid, non-destructive testing supports automated quality control and reduces dependence on time-consuming laboratory procedures.
Environmental monitoring is also expected to provide attractive opportunities. Infrared technologies can support detection and measurement of gases and chemical compounds in air, water, and industrial emissions. Semiconductor manufacturing, medical diagnostics, agricultural testing, and research laboratories further expand the application base.
The future application landscape will increasingly favor portable, automated, and connected spectroscopy platforms. Detector manufacturers capable of combining high performance with compact form factors and digital connectivity are likely to benefit from this shift.
Regional Insights
North America remains a leading market for spectroscopy IR detectors, supported by extensive pharmaceutical research, biotechnology development, chemical production, semiconductor manufacturing, and advanced laboratory infrastructure. The US accounts for a substantial share of regional demand because analytical instruments are extensively used across industrial, academic, and government research environments. Investments in laboratory automation and advanced manufacturing are also supporting market development.
Europe represents another established market, driven by pharmaceutical production, chemical processing, food safety regulations, environmental monitoring, and scientific research. Germany, France, the UK, and other European markets have strong analytical instrumentation ecosystems. Increasing emphasis on sustainable manufacturing and stringent quality requirements is encouraging adoption of automated analytical technologies.
Asia Pacific is expected to experience the fastest growth. China and Japan are major contributors, while expanding industrialization across India, South Korea, and Southeast Asia is creating additional demand. Pharmaceutical manufacturing, electronics production, food processing, and environmental monitoring are important growth areas.
-
North America benefits from strong R&D and analytical laboratory infrastructure.
-
Europe is supported by stringent quality, safety, and environmental requirements.
-
Asia Pacific is expected to deliver the fastest market growth.
-
Industrial automation is increasing spectroscopy deployment across manufacturing facilities.
-
Semiconductor and pharmaceutical investments are creating new detector opportunities across Asia.
Country-Specific Market Trends
China is expected to remain one of the fastest-growing national markets in Asia Pacific, supported by investments in pharmaceuticals, chemicals, electronics, food processing, and environmental monitoring. Its expanding manufacturing base is increasing demand for automated analytical systems. Japan maintains a technologically mature market, with demand driven by precision manufacturing, pharmaceuticals, electronics, research laboratories, and advanced instrumentation.
In North America, the United States represents the largest market, supported by its extensive pharmaceutical, biotechnology, chemical, semiconductor, and research sectors. Canada is benefiting from growing investments in scientific research, food testing, environmental analysis, and advanced manufacturing. Mexico is developing opportunities through industrial modernization, automotive production, food processing, and manufacturing expansion.
Germany remains a major European market because of its strong chemical, pharmaceutical, automotive, and industrial technology sectors. France benefits from pharmaceutical, food, environmental, and research applications. Across Europe, regulatory requirements and sustainability initiatives are encouraging manufacturers to adopt reliable analytical and process-monitoring systems.
Indicative country-level growth during the forecast period is expected to remain strongest in China and Mexico, while mature markets such as the US, Germany, Japan, and France are expected to maintain steady expansion.
-
China is positioned as a major Asia Pacific growth engine for spectroscopy technologies.
-
Japan remains a technologically advanced market with strong precision-analysis demand.
-
United States represents the largest North American opportunity.
-
Germany continues to benefit from its advanced industrial and chemical ecosystem.
-
France and Canada offer opportunities across pharmaceuticals, food testing, environmental monitoring, and research.
Key Spectroscopy IR Detector Company Insights
The competitive landscape includes established analytical instrumentation companies and specialized detector technology suppliers. Major participants focus on improving detector sensitivity, spectral coverage, reliability, miniaturization, and integration with spectroscopy platforms. Companies such as Hamamatsu Photonics, Teledyne Technologies, Thermo Fisher Scientific, HORIBA, Shimadzu, Bruker, and Excelitas Technologies participate across different parts of the infrared detection and spectroscopy ecosystem.
Leading companies are increasingly combining detector hardware with sophisticated software and data analytics. AI-supported spectral interpretation, automated calibration, remote diagnostics, and cloud-based data management are becoming important areas of differentiation. Product strategies are also moving toward modular detector architectures that allow instruments to be adapted for different spectral ranges and applications.
Specialized detector manufacturers are concentrating on semiconductor materials, optical coatings, packaging, and high-performance sensing, while full-system providers are integrating these technologies into FTIR, NIR, process spectroscopy, and laboratory platforms.
-
Companies are prioritizing higher sensitivity and lower noise.
-
AI-based spectral analysis is becoming an important software differentiator.
-
Miniaturization is expanding opportunities for portable spectroscopy instruments.
-
Connected instruments are supporting remote monitoring and predictive maintenance.
-
Strategic partnerships can accelerate integration between detector, software, and analytical platforms.
Recent Developments
The market is seeing continued development of compact infrared detector modules designed for portable spectroscopy and industrial sensing. Manufacturers are also improving semiconductor-based detector performance to deliver higher sensitivity while maintaining lower power consumption.
Another important development is the integration of AI and machine learning into spectroscopy software. These capabilities enable automated spectral classification, anomaly detection, chemometric analysis, and predictive quality control, reducing the analytical workload for laboratory personnel.
Industry collaboration is also increasing around connected analytical systems. Partnerships between instrument manufacturers, sensor companies, software providers, and industrial automation specialists are helping create spectroscopy platforms capable of feeding real-time information into manufacturing execution systems, laboratory information management systems, and cloud analytics environments.
Market Segmentation
The Spectroscopy IR Detector Market can be segmented by product, technology/component, application, and region. By product, the market includes detector solutions designed for near-infrared, mid-infrared, and broader spectral applications. By technology, major categories include MCT, InGaAs, PbS, PbSe, thermopile, pyroelectric, and other detector technologies. By application, pharmaceutical and biotechnology, chemicals, food and beverages, environmental monitoring, semiconductor and electronics, industrial processing, research, and other sectors represent important demand areas. Regionally, the market covers North America, Europe, Asia Pacific, and other global markets.
-
Mid-infrared detectors remain important for molecular fingerprinting applications.
-
InGaAs-based solutions benefit from expanding NIR spectroscopy applications.
-
Pharmaceutical and chemical industries remain core application areas.
-
Asia Pacific offers significant long-term expansion potential.
-
AI, IoT, and cloud connectivity are influencing product development across segments.
The Spectroscopy IR Detector Market is expected to maintain a positive growth trajectory through 2035, supported by expanding use of infrared analysis across pharmaceutical manufacturing, chemicals, food safety, environmental monitoring, semiconductor production, and scientific research. The transition toward automated and connected analytical workflows is changing the role of IR detectors from conventional measurement components into critical elements of intelligent sensing systems.
AI will have an increasingly important impact by enabling automated spectral interpretation, anomaly detection, predictive analytics, and real-time quality decisions. IoT connectivity will further strengthen the market by allowing spectroscopy instruments to communicate with laboratory and industrial platforms. At the same time, advances in semiconductor materials, miniaturization, optical engineering, and low-power electronics will create opportunities for portable and distributed sensing.
By 2035, businesses are likely to prioritize spectroscopy solutions that combine detector performance with connectivity, automation, software intelligence, and ease of integration. For detector manufacturers and analytical instrument companies, investments in AI-enabled analytics, compact architectures, high-sensitivity materials, and application-specific solutions will be strategically important for capturing emerging opportunities.
FAQs
1. What is the projected market size of the Spectroscopy IR Detector Market?
The global Spectroscopy IR Detector Market is estimated at approximately USD 1.1 billion in 2025 and is projected to reach around USD 1.8 billion by 2035.
2. What is the expected growth rate of the Spectroscopy IR Detector Market?
The market is expected to grow at a CAGR of approximately 5%–6% between 2025 and 2035.
3. What are the key factors driving the Spectroscopy IR Detector Market?
Key drivers include increasing pharmaceutical and chemical testing, industrial process monitoring, laboratory automation, environmental analysis, semiconductor manufacturing, AI-enabled spectroscopy, IoT connectivity, and digital transformation.
4. Which region is expected to lead the Spectroscopy IR Detector Market?
North America is expected to remain a leading regional market, while Asia Pacific is projected to be the fastest-growing region through 2035.
5. Who are the key companies in the Spectroscopy IR Detector Market?
Major companies and technology participants include Hamamatsu Photonics, Teledyne Technologies, Thermo Fisher Scientific, HORIBA, Shimadzu, Bruker, and Excelitas Technologies, among others.
To speak to our analyst for a discussion on the above findings, click Speak to Analyst
 Exclusive indicates content/data unique to MarketsandMarkets and not available with any competitors.
Table of Contents
1 Introduction (Page No. - 10)
1.1 Study Objectives
1.2 Market Definition
1.3 Market Covered
1.4 Stakeholders
1.5 Currency & Pricing
2 Research Methodology (Page No. - 16)
2.1 Arriving at the Market Size
2.2 spectroscopy IR detector market Size Estimation
2.3 Forecasting Approach
2.4 Top – Down & Bottom – Up Approach
2.4.1 Bottom-Up Approach
2.4.2 Top-Down Approach
2.5 Market Crackdown & Data Triangulations
2.5 Demand Side Approach
2.5 Key Data Points Taken From Secondary Research
2.5 Key Data Points Taken From Primary Research
2.5 Market Share Estimation
2.5 Report Assumptions
3 Executive Summary (Page No. - 30)
4 Market Overview (Page No. - 32)
4.1 Introduction
4.2 Parent Market Comparison
4.3 Market Dynamics
4.3.1 Drivers
4.3.1.1 Increasing Shipments of IR Spectroscopy Devices
4.3.1.2 Upgradation of IR Spectroscopy Devices Fostering the Growth of the IR Detector Market
4.3.2 Restraints
4.4.2.1 Availability of Substitutes for IR Spectroscopy in Various Industries
4.3.3 Opportunities
4.3.3.1 Adoption of NIR Spectroscopy Devices in Seed Quality Detection
4.3.3.2 Growing Product Development of IR Spectroscopy Devices for Biological Segment
4.4 Value Chain Analysis
4.5 Porter’s Five Forces Model
4.5.1 Bargaining Power of Suppliers
4.5.2 Bargaining Power of Buyers
4.5.3 Threat of New Entrants
4.5.4 Threat of Substitutes
4.5.5 Intensity of Competitive Rivalry
5 Global IR Detector Market for IR Spectroscopy, By Detector Technology (Page No. - 46)
5.1 Introduction
5.2 Market Overview, By Detector Technology
5.2.1 MCT IR Detector
5.2.1.1 MCT IR Detector Market, By Spectrum Sensitivity
5.2.2 DTGS IR Detector
5.2.2.1 DTGS IR Detector Market, By Spectrum Sensitivity
6 Global IR Detector Market for IR Spectroscopy, By Spectrum Sensitivity (Page No. - 51)
6.1 Introduction
6.2 Market Overview, By Spectrum Sensitivity
6.2.1 NIR Detector Market, By Detector Technology
6.2.1.1 NIR Detector Market, By Detector Technology
6.2.1.2 NIR Detector Market, By Product Type
6.2.2 Mid IR Detector Market, By Detector Technology
6.2.2.1 Mid IR Detector Market, By Detector Technology
6.2.2.2 Mid IR Detector Market, By Product Type
6.2.3 Far IR Detector Market, By Detector Technology
6.2.3.1 Far IR Detector Market, By Detector Technology
6.2.3.2 Far IR Detector Market, By Product Type
7 Global IR Detector Market for IR Spectroscopy, By Cooling Requirement (Page No. - 60)
7.1 Introduction
7.2 Market Overview, By Cooling Requirement
7.2.1 Cooled IR Detector
7.2.2 Uncooled IR Detector
8 Global IR Detector Market for IR Spectroscopy, By Product Type (Page No. - 63)
8.1 Introduction
8.2 spectroscopy IR detector market Overview, By Product Type
8.2.1 Benchtop IR Spectroscopes
8.2.1.1 IR Detector Market in Benchtop Spectroscopes, By Spectrum Sensitivity
8.2.2 Micro IR Spectroscopes
8.2.2.1 IR Detector Market in Microspectroscopes, By Spectrum Sensitivity
8.2.3 Portable IR Spectroscopes
8.2.3.1 IR Detector Market in Portable Spectroscopes, By Spectrum Sensitivity
8.2.4 Hyphenated IR Spectroscopes
8.2.4.1 IR Detector Market in Hyphenated Spectroscopes, By Spectrum Sensitivity
9 Geographic Analysis (Page No. - 70)
9.1 IR Detector Market for IR Spectroscopy, By Geography
9.2 North America
9.3 Europe
9.4 Asia-Pacific
10 Competitive Landscape (Page No. - 76)
9.1 Introduction
9.2 IR Detector Market Ranking Analysis, 2015
9.3 Competitive Scenario & Trends
9.4 Recent Developments
9.4.1 New Product Launches
9.4.2 Expansions
9.4.3 Mergers & Acqusitions
9.4.4 Partnerships, Agreements, Joint Ventures, & Collaborations
9.4.5 Others
11 Company Profiles (Page No. - 86)
11.1 Allied Vision Technologies GmbH
11.2 Bayspec, Inc.
11.3 Episensors, Inc.
11.4 Flir Systems, Inc..
11.5 Hamamatsu Photonics K.K.
11.6 Horiba, Ltd.
11.7 Newport Corporation
11.8 Sensors Unlimited
11.9 Sofradir
11.10 Teledyne Dalsa Inc.
11.11 Laser Components GmbH
11.12 Excelitas Technologies Corp.
List of Tables (45 Tables)
Table 1 Country-Wise Trade of Spectrometers, Spectrophotometers, and Other Devices, 2015
Table 2 Key Data Taken From Secondary Sources
Table 3 Key Data Taken From Primary Sources
Table 4 General Assumptions
Table 5 Year-Wise & Forecast Assumptions
Table 6 Year-Wise & Forecast Assumptions
Table 7 Quantification of Porter’s Analysis
Table 8 Global IR Detector Market for IR Spectroscopy, By Detector Technology, 2014–2022 (Unit Shipment)
Table 9 MCT IR Detector Market for IR Spectroscopy, By Spectrum Sensitivity, 2014–2022 (Unit Shipment)
Table 10 DTGS IR Detector Market for IR Spectroscopy, By Spectrum Sensitivity, 2014–2022 (Unit Shipment)
Table 11 Global IR Detector Market for IR Spectroscopy, By Spectrum Sensitivity, 2014–2022 (Unit Shipment)
Table 12 NIR Detector Market for IR Spectroscopy, By Detector Technology, 2014–2022 (Unit Shipment)
Table 13 NIR Detector Market for IR Spectroscopy, By Product Type, 2014–2022 (Unit Shipment)
Table 14 Mid IR Detector Market for IR Spectroscopy, By Detector Technology, 2014–2022 (Unit Shipment)
Table 15 Mid IR Detector Market for IR Spectroscopy, By Product Type, 2014–2022 (Unit Shipment)
Table 16 Far IR Detector Market for IR Spectroscopy, By Detector Technology, 2014–2022 (Unit Shipment)
Table 17 Far IR Detector Market for IR Spectroscopy, By Product Type, 2014–2022 (Unit Shipment)
Table 18 Global IR Detector Market for IR Spectroscopy, By Cooling Requirement, 2014–2022 (Unit Shipment)
Table 19 Global IR Detector Market for IR Spectroscopy, By Product Type, 2014–2022 (Unit Shipment)
Table 20 IR Detector Market in Benchtop Spectroscopes, By Spectrum Sensitivity, 2014–2022 (Unit Shipment)
Table 21 IR Detector Market in Microspectroscopes, By Spectrum Sensitivity, 2014–2022 (Unit Shipment)
Table 22 IR Detector Market in Portable Spectroscopes, By Spectrum Sensitivity, 2014–2022 (Unit Shipment)
Table 23 IR Detector Market in Hyphenated Spectroscopes, By Spectrum Sensitivity, 2014–2022 (Unit Shipment)
Table 24 Global IR Detector Market for IR Spectroscopy, By Region, 2014–2022 (Unit Shipment)
Table 25 IR Detector Market for IR Spectroscopy in North America, By Country, 2014–2022 (Unit Shipment)
Table 26 IR Detector Market for IR Spectroscopy in Europe, By Country, 2014–2022 (Unit Shipment)
Table 27 IR Detector Market for IR Spectroscopy in APAC, By Country, 2014–2022 (Unit Shipment)
Table 28 Market Ranking Analysis of IR Detector Market
Table 29 List of New Product Development in the IR Detector Market for IR Spectroscopy
Table 30 List of Expansion in IR Detector Market for IR Spectroscopy
Table 31 List of Merger and Acquistions in IR Detector Market for IR Spectroscopy
Table 32 List of Agreements, Partnership, Joint Ventures, Contracts & Collabrations in spectroscopy IR detector market
Table 33 List of Other Activities in IR Detector Market for IR Spectroscopy
Table 34 Allied Vision Technologies GmbH: Developments
Table 35 Bayspec, Inc.: Developments
Table 36 Episensors, Inc.: Developments
Table 37 Flir Systems, Inc.: Developments
Table 38 Hamamatsu Photonics K.K.: Developments
Table 39 Horiba, Ltd.: Developments
Table 40 Newport Corporation: Developments
Table 41 Sensors Unlimited: Developments
Table 42 Sofradir: Developments
Table 43 Teledyne Dalsa Inc.: Developments
Table 44 Laser Components GmbH: Developments
Table 45 Excelitas Technologies Corp.: Developments
List of Figures (69 Figures)
Figure 1 IR Spectrum Range (Wavelength)
Figure 2 Spectroscopy IR Detector Market Covered
Figure 3 Spectroscopy IR Detector Market Size Estimation
Figure 4 Top – Down & Bottom – Up Approach
Figure 5 Market Crackdown & Data Triangulation
Figure 6 Key Insights From Primary Respondent
Figure 7 Executive Summary of IR Detector Market for IR Spectroscopy in 2015
Figure 8 Parent Market Comparison of IR Detector Market for IR Spectroscopy
Figure 9 Market Dynamics of IR Detector Market for IR Spectroscopy Application
Figure 10 ISpectroscopy IR Detector Market Driver Impact Analysis
Figure 11 Spectroscopy IR Detector Market Restain Impact Analysis
Figure 12 Value Chain Analysis of IR Detector Market in IR Spectroscopy
Figure 13 Impact Analysis in 2015
Figure 14 Impact Analysis in 2015 & 2022
Figure 15 Bargaining Power of Supplier
Figure 16 Bargaining Power of Buyer
Figure 17 Threat From New Entrant
Figure 18 Threat From Substitute
Figure 19 Intensity of Competitive Rivalry
Figure 20 Spectroscopy IR Detector Market, By Detector Technology
Figure 21 Global ISpectroscopy IR Detector Market, By Detector Technology, 2014–2022 (USD Million)
Figure 22 MCT IR Detector Market for IR Spectroscopy, By Spectrum Sensitivity, 2014–2022 (USD Million)
Figure 23 DTGS IR Detector Market for IR Spectroscopy, By Spectrum Sensitivity, 2014–2022 (USD Million)
Figure 24 Spectroscopy IR Detector Market, By Spectrum Sensitivity
Figure 25 Global Spectroscopy IR Detector Market, By Spectrum Sensitivity, 2014–2022 (USD Million)
Figure 26 NIR Detector Market for IR Spectroscopy, By Detector Technology, 2014–2022 (USD Million)
Figure 27 NIR Detector Market for IR Spectroscopy, By Product Type, 2014–2022 (USD Million)
Figure 28 Mid IR Detector Market for IR Spectroscopy, By Detector Technology, 2014–2022 (USD Million)
Figure 29 Mid IR Detector Market for IR Spectroscopy, By Product Type, 2014–2022 (USD Million)
Figure 30 Far IR Detector Market for IR Spectroscopy, By Detector Technology, 2014–2022 (USD Million)
Figure 31 Far IR Detector Market for IR Spectroscopy, By Product Type, 2014–2022 (USD Million)
Figure 32 Spectroscopy IR Detector Market, By Cooling Requirement
Figure 33 Global Spectroscopy IR Detector Market, By Cooling Requirement, 2014–2022 (USD Million)
Figure 34 IR Detector Market for IR Spectroscopy, By Product Type
Figure 35 Global Spectroscopy IR Detector Market, By Product Type, 2014–2022 (USD Million)
Figure 36 IR Detector Market in Benchtop Spectroscopes, By Spectrum Sensitivity, 2014–2022 (USD Million)
Figure 37 IR Detector Market in Microspectroscopes, By Spectrum Sensitivity, 2014–2022 (USD Million)
Figure 38 IR Detector Market in Portable Spectroscopes, By Spectrum Sensitivity, 2014–2022 (USD Million)
Figure 39 IR Detector Market in Hyphenated Spectroscopes, By Spectrum Sensitivity, 2014–2022 (USD Million)
Figure 40 Geography Snapshot: Global IR Detector Market for IR Spectroscopy
Figure 41 Global IR Detector Market for IR Spectroscopy, By Region, 2014–2022 (USD Million)
Figure 42 Spectroscopy IR Detector Market in North America, By Country, 2014–2022 (USD Million)
Figure 43 Spectroscopy IR Detector Market in Europe, By Country, 2014–2022 (USD Million)
Figure 44 Spectroscopy IR Detector Market in APAC, By Country, 2014–2022 (USD Million)
Figure 45 Spectroscopy IR Detector Market: Competitive Situation & Trends, 2016–2012
Figure 46 Twentsche Kabelfabriek (TKF) Group NV: Business Overview
Figure 47 Allied Vision Technologies GmbH: Products Offred
Figure 48 Bayspec, Inc.: Business Overview
Figure 49 Bayspec, Inc.: Products Offered
Figure 50 Episensors, Inc.: Business Overview
Figure 51 Episensors, Inc.: Products Offered
Figure 52 Flir Systems, Inc.: Business Overview
Figure 53 Flir Systems, Inc.: Products Offered
Figure 54 Hamamatsu Photonics K.K.: Business Overview
Figure 55 Hamamatsu Photonics K.K.: Products Offered
Figure 56 Horiba, Ltd.: Business Overview
Figure 57 Horiba, Ltd.: Products Offered
Figure 58 Newport Corporation: Business Overview
Figure 59 Newport Corporation: Products Offered
Figure 60 United Technologies Corporation: Business Overview
Figure 61 Sensors Unlimited: Products Offered
Figure 62 Sofradir: Business Overview
Figure 63 Sofradir: Products Offered
Figure 64 Teledyne Technologies Inc.: Business Overview
Figure 65 Teledyne Dalsa Inc.: Products Offered
Figure 66 Laser Components GmbH: Business Overview
Figure 67 Laser Components GmbH: Products Offered
Figure 68 Excelitas Technologies Corp.: Business Overview
Figure 69 Excelitas Technologies Corp.: Products Offered
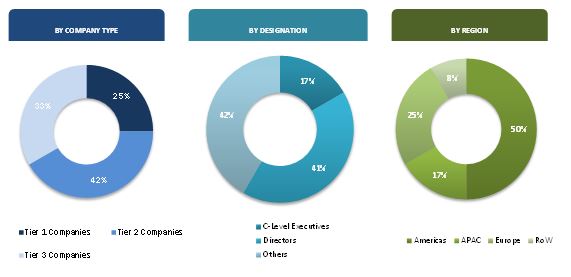
The research methodology used to estimate and forecast the spectroscopy IR detector market begins with obtaining data on key vendor revenues through company’s annual reports, SEC filings, Factiva, Bloomberg Business, and other secondary resources. The vendor offerings have also been taken into consideration to determine the market segmentation. The bottom-up procedure has been employed to arrive at the overall market size of the global IR detector market from the ASPs of IR detectors and the shipment of IR spectroscopy devices market. After arriving at the overall market size, the total market has been split into several segments and sub-segments, which are then verified through primary research by conducting extensive interviews with CEOs, VPs, directors, and executives. The market breakdown and data triangulation procedures have been employed to complete the overall market engineering process and arrive at the exact statistics for all segments and subsegments. The breakdown of the profiles of the primaries is depicted in the figure below:
To know about the assumptions considered for the study, download the pdf brochure
The IR detector ecosystem comprises IR sensor/detector component manufacturers such as Hamamatsu Photonics K.K. (Japan), Excelitas Technologies Corp. (U.S.), LASER Components GmbH (Germany) and others; and IR spectroscopy device manufacturers such as Thermo Fisher Scientific (U.S.), PerkinElmer (U.S.), Bruker Corporation (U.S.), and Agilent Technologies (U.S.) among others.
Key Target Audience
- IR Detector Manufacturers
- IR Spectroscopy Manufacturers
- IR Sensor & Spectroscopy Suppliers
- Government and Research Organizations
- Distribution Network Service Providers/Operators
- Banks, Venture Capitalists, Financial Institutions, and Other Investors
Scope of the Report
The research report segments the spectroscopy IR detector market into the following submarkets:
By Detector Technology
- Mercury Cadmium Telluride (MCT)
- Deuterated Triglycine Sulfate (DTGS)
- Indium Gallium Arsenide (InGaAs)
- Others
By Spectrum Sensitivity
- NIR
- Mid IR
- Far IR
By Cooling Requirement:
- Cooled
- Uncooled
By Product Type
- Benchtop Spectroscopes
- Microspectroscopes
- Portable Spectroscopes
- Hyphenated Spectroscopes
By Geography:
- North Americas
- Europe
- APAC
- RoW
Available Customizations
With the given market data, MarketsandMarkets offers customizations according to the company’s specific needs. The following customization options are available for the report:
Geographic Analysis
- Further breakdown of the IR detector market in North America
- Further breakdown of the IR detector market in Europe
- Further breakdown of the IR detector market in APAC
Company Information
- Detailed analysis and profiling of additional market players (up to five)












Growth opportunities and latent adjacency in Spectroscopy IR Detector Market