Stick Packaging Market by Material (Polyester, Paper, BOPP, Aluminum, Metallized Polyester, Polyethylene, Others), Application (Food & Beverages, Pharmaceuticals, Consumer Goods, Nutraceuticals, Others), & by Region - Trends & Forecasts to 2020


[206 Pages Report] The global stick packaging market has witnessed rapid growth from 2011, and is projected to grow at a CAGR of 6.26% during the review period, to reach $316.6 Million by 2020. North America dominated the market, with a share of 41% in 2014; this market is driven by convenience and portability of stick packs, aggressive pricing, rising consumer spending, and shift from rigid to flexible packaging. The Asia-Pacific region is projected to become the fastest-growing market.
The stick packaging market in the Asia-Pacific region is projected to grow at the highest CAGR from 2015 to 2020, in terms of volume. The rising middle-class population of the region, with high disposable income, and demand for on-the-go products, is driving the growth of this market.
Stick Packaging Market Share (Value), by Region, 2014
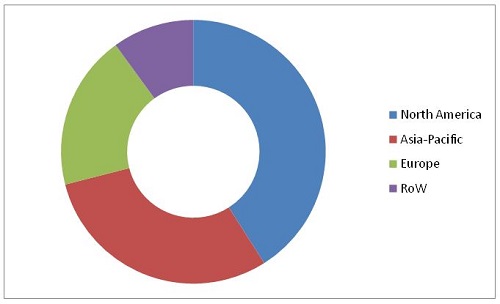
Source: Expert Interviews and MarketsandMarkets Analysis
This report estimates the size of the global stick packaging market in terms of value and volume. In this report, the market is broadly segmented based on material, application, and region. Market drivers, restraints, challenges, raw materials, and product price trends are discussed in detail. Market share, by participant, for the overall market, is discussed in detail. The global market has grown exponentially in the last few years and this trend is expected to continue. Increasing disposable incomes of people in developing countries, government regulations, and changing preferences of people towards easy-to-consume products drive the growth of this market.
Scope of the report
This research study categorizes the global market based on material, application, and region:
Based on Material:
- Polyester
- BOPP
- Paper
- Aluminum
- Metallized Polyester
- Polyethylene
- Polypropylene
Based on Application:
- Food & Beverages
- Pharmaceuticals
- Consumer Goods
- Nutraceuticals
Based on Region:
- North America
- Europe
- Asia-Pacific
- Rest of the World (RoW)
Stick packaging is a type of flexible packaging. It is named after its shape: thin and long. Stick packaging is easy to handle, conveniently small, and suitable for on-the-go products. Industries such as food, pharmaceuticals, or manufacturers of single-dose products prefer using stick packs for their products.
The global market has expanded owing to developments in the flexible packaging industry. The demand for stick packaging is growing at a significant pace and is projected to grow at an even higher rate in the near future. With the rising population and increased incomes of people, the use of packaged products is booming, and consequently, so is the stick packaging market. This market can be classified into three main categories based on application: food & beverages, pharmaceuticals, consumer goods, nutraceuticals, and others.
Stick Packaging Market Size, by Material, 2015-2020 ($Million)
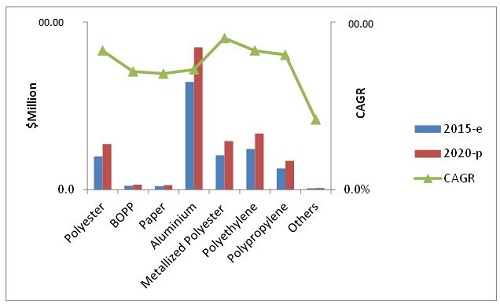
Source: Expert Interviews and MarketsandMarkets Analysis
The global market is observed to be mature in developing economies such as Europe and North America. The reason behind this is the rapid growth in the packaging sector. The Asia-Pacific region formed the second-largest market, with a share of 30%. It is projected to be the fastest-growing market from 2015 to 2020. The global market is projected to reach $316.61 Million by 2020.
The market for stick packaging is driven by the demand from the flexible packaging industry. The busy lifestyles of consumers have encouraged the use of convenient products. High disposable income has enabled end users to spend more on new types of packaging. Most importantly, the changing preference of consumers from rigid to flexible packaging has given a boost to the stick packaging market.
The global market is marked with intense competition due to the presence of a large number of both, big and small firms. New product launches, mergers & acquisitions, and partnerships & expansions are the key strategies adopted by market players to ensure their growth in the market. Companies such as Amcor Limited (Australia), Constantia Flexibles (Austria), Huhtamaki OYJ (Finland), Mondi Group (South Africa), and Sonoco Products Company (U.S.) are some of the prominent companies in this market, comprising 73.60% of the total market share.
 Exclusive indicates content/data unique to MarketsandMarkets and not available with any competitors.
Table of Contents
1 Introduction (Page No. - 15)
1.1 Objectives of the Study
1.2 Market Definition
1.3 Study Scope
1.3.1 Periodization Considered for this Market
1.4 Currency Considered for this Market
1.5 Package Size
1.6 Limitations
1.7 Stakeholders
2 Research Methodology (Page No. - 18)
2.1 Introduction
2.1.1 Secondary Data
2.1.1.1 Key Data From Secondary Sources
2.1.2 Primary Data
2.1.2.1 Key Data From Primary Sources
2.1.2.1.1 Breakdown of Primaries - By Company Type, Designation, and Region
2.2 Factor Analysis
2.2.1 Introduction
2.2.2 Overview of the Parent Industry
2.2.2.1 Key Segments in the Packaging Sector
2.2.3 Demand-Side Analysis
2.2.3.1 Rising Population
2.2.3.1.1 Increase in Middle-Class Population, 2009-2030
2.2.3.2 Developing Economies, GDP (Purchasing Power Parity),2013
2.2.4 Supply-Side Analysis
2.2.4.1 Regulations
2.2.4.2 Research & Development
2.2.4.3 Packaging Equipment and Technologies
2.3 Market Size Estimation
2.4 Market Breakdown & Data Triangulation
2.5 Market Share Estimation
2.6 Research Assumptions & Limitations
2.6.1 Assumptions
2.6.2 Limitations
3 Executive Summary (Page No. - 32)
3.1 Introduction
3.2 Evolution
3.3 Drivers of this Market
3.4 Aluminum Segment Projected to Hold Major Share in this Market By 2020
3.5 Stick Packaging Market in Asia-Pacific Witnessed the Highest Growth in 2014
4 Premium Insights (Page No. - 36)
4.1 Attractive Opportunities in this Market
4.2 China is Projected to Dominate this Market By 2020
4.3 Stick Packaging Market, By Type, 2015
4.4 Stick Packaging Market
4.5 Aluminum Was the Largest Segment in All Regions
5 Market Overview (Page No. - 40)
5.1 Introduction
5.2 Evolution
5.3 Market Segmentation
5.3.1 Stick Packaging Market, By Material
5.3.1.1 Aluminum Foil
5.3.1.2 Polypropylene
5.3.1.3 Paper
5.3.1.4 Polyester
5.3.1.5 Metallized Polyester
5.3.1.6 Bi-Axially Oriented Polypropylene (BOPP)
5.3.2 Stick Packaging Market, By Application
5.3.2.1 Food & Beverages
5.3.2.2 Pharmaceuticals
5.3.2.3 Consumer Goods
5.3.2.4 Nutraceuticals
5.4 Market Dynamics
5.4.1 Drivers
5.4.1.1 Ease of Handling
5.4.1.2 Cost-Effectiveness
5.4.1.3 Innovation
5.4.2 Restraints
5.4.2.1 Decrease in Sugar Consumption for Health Benefits
5.4.2.2 Reluctance to Change Existing Packaging Types
5.4.3 Opportunities
5.4.3.1 Growth in Pharmaceuticals Industry
5.4.3.2 Emerging Markets
5.4.4 Challenges
5.4.4.1 Fluctuations in Prices of Raw Materials
5.4.4.2 Printing on Stick Packs
5.4.4.3 Stringent Packaging Policies
5.4.4.4 Improving Filling Speed
6 Industry Trends (Page No. - 50)
6.1 Introduction
6.2 Value Chain Analysis
6.3 Supply Chain
6.3.1 Prominent Companies
6.3.2 Small & Medium Enterprises
6.4 Porter’s Five Forces Analysis
6.4.1 Threat of New Entrants
6.4.2 Threat of Substitutes
6.4.3 Bargaining Power of Suppliers
6.4.4 Bargaining Power of Buyers
6.4.5 Intensity of Competitive Rivalry
7 Market, By Material (Page No. - 56)
7.1 Introduction
7.2 Polyester
7.3 Biaxially Oriented Polypropylene (BOPP)
7.4 Paper
7.5 Aluminum
7.6 Metallized Polyester
7.7 Polyethylene
7.8 Polypropylene
7.9 Others
8 Market, By Application (Page No. - 103)
8.1 Introduction
8.2 Food & Beverages
8.3 Pharmaceuticals
8.4 Consumer Goods
8.5 Nutraceuticals
8.6 Others
9 Market, By Region (Page No. - 117)
9.1 Introduction
9.2 North America: Largest Market
9.2.1 U.S.: Land of Opportunities
9.2.2 Canada
9.2.3 Mexico
9.3 Europe
9.3.1 Germany
9.3.2 France
9.3.3 U.K.
9.3.4 Spain
9.3.5 Russia
9.3.6 Rest of Europe
9.4 Asia-Pacific
9.4.1 Japan
9.4.2 Korea
9.4.3 China
9.4.4 Australia
9.4.5 Rest of Asia-Pacific
9.5 Rest of the World (RoW)
9.5.1 Argentina
9.5.2 Brazil
9.5.3 South Africa
9.5.4 Others in RoW
10 Competitive Landscape (Page No. - 167)
10.1 Overview
10.2 Market Share Analysis
10.3 Competitive Situations & Trends
10.3.1 Mergers & Acquisitions
10.3.2 Investments & Expansions
10.3.3 Partnerships, Joint Ventures, Strategic Alliances, and Licensing
10.3.4 New Product Launches
11 Company Profiles (Page No. - 173)
(Overview, Financial*, Products & Services, Strategy, and Developments)
11.1 Introduction
11.2 Amcor Limited
11.3 Sonoco Products Company
11.4 Constantia Flexibles
11.5 Huhtamaki OYJ
11.6 Mondi Group
11.7 Bosch Packaging Technology
11.8 Fres-Co System Inc.
11.9 Oystar Group
11.10 UDG Healthcare PLC
11.11 Winpak
*Details Might Not Be Captured in Case of Unlisted Companies.
12 Appendix (Page No. - 199)
12.1 Industry Insight
12.2 Discussion Guide
12.3 Introducing RT:Real Time Market Intelligence
12.4 Available Customizations
12.5 Related Reports
List of Tables (124 Tables)
Table 1 Rising Demand for Convenience in Handling Packs
Table 2 Growing Concern About Health
Table 3 Demand for Stick Packs in Pharmaceuticals
Table 4 High Cost of Raw Materials & Stringent Regulatory Policies
Table 5 Stick Packaging Market Size, By Material, 2013–2020 ($Million)
Table 6 Market Size, By Material, 2013–2020 (KT)
Table 7 Polyester in Stick Packaging Market Size, By Region,2013–2020 ($Million)
Table 8 Polyester in Stick Packaging Market Size, By Region, 2013–2020 (KT)
Table 9 Polyester in Stick Packaging Market Size, By Country,2013–2020 ($Million)
Table 10 Polyester in Stick Packaging Market Size, By Country, 2013–2020 (KT)
Table 11 Polyester in Stick Packaging Market Size, By Application,2013–2020 ($Million)
Table 12 Polyester in Stick Packaging Market Size, By Application, 2013–2020 (KT)
Table 13 BOPP in Stick Packaging Market Size, By Region, 2013–2020 ($Million)
Table 14 BOPP in Stick Packaging Market Size, By Region, 2013–2020 (KT)
Table 15 BOPP in Stick Packaging Market Size, By Country, 2013–2020 ($Million)
Table 16 BOPP in Stick Packaging Market Size, By Country, 2013–2020 (KT)
Table 17 BOPP in Stick Packaging Market Size, By Application, 2013–2020 ($Million)
Table 18 BOPP in Stick Packaging Market Size, By Application, 2013–2020 (KT)
Table 19 Paper in Stick Packaging Market Size, By Region, 2013–2020 ($Million)
Table 20 Paper in Stick Packaging By Market Size, By Region, 2013–2020 (KT)
Table 21 Paper in Stick Packaging By Market Size, By Country, 2013–2020 ($Million)
Table 22 Paper in Stick Packaging By Market Size, By Country, 2013–2020 (KT)
Table 23 Paper in Stick Packaging By Market Size, By Application,2013–2020 ($Million)
Table 24 Paper in Stick Packaging By Market Size, By Application, 2013–2020 (KT)
Table 25 Aluminum in Stick Packaging By Market Size, By Region,2013–2020 ($Million)
Table 26 Aluminum in Stick Packaging By Market Size, By Region, 2013–2020 (KT)
Table 27 Aluminum in Stick Packaging By Market Size, By Country,2013–2020 ($Million)
Table 28 Aluminum in Stick Packaging By Market Size, By Country, 2013–2020 (KT)
Table 29 Aluminum in Stick Packaging By Market Size, By Application,2013–2020 ($Million)
Table 30 Aluminum in Stick Packaging By Market Size, By Application, 2013–2020 (KT)
Table 31 Metallized Polyester in Stick Packaging By Market Size, By Region,2013-2020 ($Million)
Table 32 Metallized Polyester in Stick Packaging By Market Size, By Region,2013–2020 (KT)
Table 33 Metallized Polyester in Stick Packaging By Market Size, By Country,2013-2020 ($Million)
Table 34 Metallized Polyester in Stick Packaging By Market Size, By Country,2013–2020 (KT)
Table 35 Metallized Polyester in Stick Packaging By Market Size, By Application, 2013-2020 ($Million)
Table 36 Metallized Polyester in Stick Packaging By Market Size, By Application, 2013–2020 (KT)
Table 37 Polyethylene in Stick Packaging By Market Size, By Region,2013–2020 ($Million)
Table 38 Polyethylene in Stick Packaging By Market Size, By Region, 2013–2020 (KT)
Table 39 Polyethylene in Stick Packaging By Market Size, By Country,2013–2020 ($Million)
Table 40 Polyethylene in Stick Packaging By Market Size, By Country, 2013–2020 (KT)
Table 41 Polyethylene in Stick Packaging By Market Size, By Application,2013–2020 ($Million)
Table 42 Polyethylene in Stick Packaging By Market Size, By Application,2013–2020 (KT)
Table 43 Polypropylene in Stick Packaging By Market Size, By Region,2013–2020 ($Million)
Table 44 Polypropylene in Stick Packaging By Market Size, By Region, 2013–2020 (KT)
Table 45 Polypropylene in Stick Packaging By Market Size, By Country,2013–2020 ($Million)
Table 46 Polypropylene in Stick Packaging By Market Size, By Country,2013–2020 (KT)
Table 47 Polypropylene in Stick Packaging By Market Size, By Application,2013–2020 ($Million)
Table 48 Polypropylene in Stick Packaging By Market Size, By Application,2013–2020 (KT)
Table 49 Others in Stick Packaging By Market Size, By Region, 2013–2020 ($Million)
Table 50 Others in Stick Packaging By Market Size, By Region, 2013–2020 (KT)
Table 51 Others in Stick Packaging By Market Size, By Country, 2013–2020 ($Million)
Table 52 Others in Stick Packaging By Market Size, By Country, 2013–2020 (KT)
Table 53 Others in Stick Packaging By Market Size, By Application,2013–2020 ($Million)
Table 54 Others in Stick Packaging By Market Size, By Application, 2013–2020 (KT)
Table 55 Stick Packaging Market Size, By Application, 2013–2020 ($Million)
Table 56 Market Size, By Application, 2013–2020 (KT)
Table 57 Stick Packaging Market Size for Food & Beverages, By Material,2013–2020 ($Million)
Table 58 Market Size for Food & Beverages, By Material,2013–2020 (KT)
Table 59 Stick Packaging Market Size for Pharmaceuticals, By Material,2013–2020 ($Million)
Table 60 Market Size for Pharmaceuticals, By Material,2013–2020 (KT)
Table 61 Stick Packaging Market Size for Consumer Goods, By Material,2013–2020 ($Million)
Table 62 Market Size for Consumer Goods, By Material,2013–2020 (KT)
Table 63 Stick Packaging Market Size for Nutraceuticals, By Material,2013–2020 ($Million)
Table 64 Market Size for Nutraceuticals, By Material,2013–2020 (KT)
Table 65 Stick Packaging Market Size for Other Applications, By Material,2013–2020 ($Million)
Table 66 Market Size for Other Applications, By Material,2013–2020 (KT)
Table 67 Stick Packaging Market Size, By Region, 2013–2020 ($Million)
Table 68 Market Size, By Region, 2013–2020 (KT)
Table 69 North America: Market Size, By Country,2013–2020 ($Million)
Table 70 North America: Market Size, By Country, 2013–2020 (KT)
Table 71 North America: Market Size, By Material,2013-2020 ($Million)
Table 72 North America: Market Size, By Material, 2013-2020 (KT)
Table 73 U.S.: Market Size, By Material, 2013-2020 ($Million)
Table 74 U.S.: Market Size, By Material, 2013-2020 (KT)
Table 75 Canada: Market Size, By Material, 2013-2020 ($Million)
Table 76 Canada: Market Size, By Material, 2013-2020 (KT)
Table 77 Mexico: Market Size, By Material, 2013-2020 ($Million)
Table 78 Mexico: Market Size, By Material, 2013-2020 (KT)
Table 79 Europe: Market Size, By Country, 2013–2020 ($Million)
Table 80 Europe: Market Size, By Country, 2013–2020 (KT)
Table 81 Europe: Market Size, By Material, 2013-2020 ($Million)
Table 82 Europe: Market Size, By Material, 2013-2020 (KT)
Table 83 Germany: Market Size, By Material, 2013-2020 ($Million)
Table 84 Germany: Market Size, By Material, 2013-2020 (KT)
Table 85 France: Market Size, By Material, 2013-2020 ($Million)
Table 86 France: Market Size, By Material, 2013-2020 (KT)
Table 87 U.K.: Market Size, By Material, 2013-2020 ($Million)
Table 88 U.K.: Market Size, By Material, 2013-2020 (KT)
Table 89 Spain: Market Size, By Material, 2013-2020 ($Million)
Table 90 Spain: Market Size, By Material, 2013-2020 (KT)
Table 91 Russia: Market Size, By Material, 2013-2020 ($Million)
Table 92 Russia: Market Size, By Material, 2013-2020 (KT)
Table 93 Rest of Europe: Market Size, By Material,2013-2020 ($Million)
Table 94 Rest of Europe: Market Size, By Material, 2013-2020 (KT)
Table 95 Asia-Pacific: Market Size, By Country,2013–2020 ($Million)
Table 96 Asia-Pacific: Market Size, By Country, 2013–2020 (KT)
Table 97 Asia-Pacific: Market Size, By Material,2013-2020 ($Million)
Table 98 Asia-Pacific: Market Size, By Material, 2013-2020 (KT)
Table 99 Japan: Market Size, By Material, 2013-2020 ($Million)
Table 100 Japan: Market Size, By Material, 2013-2020 (Million)
Table 101 Korea: Market Size, By Material, 2013-2020 ($Million)
Table 102 Korea: Market Size, By Material, 2013-2020 (KT)
Table 103 China: Market Size, By Material, 2013-2020 ($Million)
Table 104 China: Market Size, By Material, 2013-2020 (KT)
Table 105 Australia: Market Size, By Material, 2013-2020 ($Million)
Table 106 Australia: Market Size, By Material, 2013-2020 (KT)
Table 107 Rest of Asia-Pacific: Market Size, By Material,2013-2020 ($Million)
Table 108 Rest of Asia-Pacific: Market Size, By Material,2013-2020 (KT)
Table 109 RoW: Market Size, By Country, 2013–2020 ($Million)
Table 110 RoW: Market Size, By Country, 2013–2020 (KT)
Table 111 RoW: Market Size, By Material, 2013-2020 ($Million)
Table 112 RoW: Market Size, By Material, 2013-2020 (KT)
Table 113 Argentina: Stick Packaging Market Size, By Material,2013-2020 ($Million)
Table 114 Argentina: Market Size, By Material, 2013-2020 (KT)
Table 115 Brazil: Stick Packaging Market Size, By Material, 2013-2020 ($Million)
Table 116 Brazil: Market Size, By Material, 2013-2020 (KT)
Table 117 South Africa: Stick Packaging Market Size, By Material,2013-2020 ($Million)
Table 118 South Africa: Market Size, By Material, 2013-2020 (KT)
Table 119 Others in RoW: Stick Packaging Market Size, By Material,2013-2020 ($Million)
Table 120 Others in RoW: Market Size, By Material, 2013-2020 (KT)
Table 121 Mergers & Acquisitions, 2011–2015
Table 122 Investments & Expansions, 2011–2015
Table 123 Partnerships, Joint Ventures, Strategic Alliances, and Licensing,2011–2015
Table 124 New Product Launches, 2011–2015
List of Figures (54 Figures)
Figure 1 Research Design
Figure 2 Global Population Projected to Reach ~ 9.5billion By 2050
Figure 3 Stick Packaging Market Size, By Country, 2014
Figure 4 Market Size Estimation Methodology: Bottom-Up Approach
Figure 5 Market Size Estimation Methodology: Top-Down Approach
Figure 6 U.S. Held Largest Share in this Market, 2014
Figure 7 Stick Packaging Market Snapshot (2015 vs. 2020): Metallized Polyester Segment Projected to Grow at the Highest CAGR
Figure 8 Asia-Pacific Was the Fastest-Growing Region for this Market, 2014
Figure 9 Emerging Economies Offer Attractive Opportunities in this Market
Figure 10 China is Projected to Be the Fastest-Growing Market
Figure 11 North America Contributes Largest Share in this Market in 2015
Figure 12 Emerging Markets to Grow Faster Than Developed Markets
Figure 13 Aluminum Segment Generated Highest Revenue, By Material, in 2014
Figure 14 Cost-Effectiveness & Convenience of Handling are Key Drivers of this Market
Figure 15 Porter’s Five Forces Analysis
Figure 16 Polyester in Stick Packaging Market, By Region, 2015 & 2020 ($Million)
Figure 17 Food & Beverages Sector, Colossal Market for Polyester in Stick Packaging
Figure 18 BOPP in Stick Packaging Market, By Region
Figure 19 BOPP in Stick Packaging Market, By Application
Figure 20 Paper in Stick Packaging Market, By Region
Figure 21 Paper is Widely Used in the Food & Beverages Industry, Specifically for Sugar Packs
Figure 22 North America to Hold Largest Share in Aluminum Segment of this Market, By 2020
Figure 23 Barrier Properties of Aluminum Maximizes Its Use in Food & Beverages
Figure 24 Metallized Polyester in Stick Packaging Market, By Region, 2015 and 2020
Figure 25 Metallized Polyester in Stick Packaging, By Application, 2015 and 2020
Figure 26 Polyethylene in Stick Packaging Market, By Region, 2015 and 2020
Figure 27 Polyethylene in Stick Packaging, By Application, 2015 and 2020
Figure 28 Polypropylene in Stick Packaging Market, By Region, 2015 and 2020
Figure 29 Polypropylene, By Application, 2015 and 2020
Figure 30 Others in Stick Packaging Market, By Region, 2015 and 2020
Figure 31 Others in Stick Packaging Market, By Application, 2015 and 2020
Figure 32 Stick Packaging Market for Food & Beverages, By Material, 2015 and 2020
Figure 33 Stick Packaging Market Size for Pharmaceuticals, By Material, 2015 and 2020
Figure 34 Stick Packaging Market Size for Consumer Goods, By Material, 2015 and 2020
Figure 35 Stick Packaging Market Size for Nutraceuticals, By Material, 2015 and 2020
Figure 36 Stick Packaging Market Size for Other Applications, By Material, 2015 and 2020
Figure 37 Companies Adopted Acquisition as the Key Growth Strategy Over the Last Five Years
Figure 38 Stick Packaging Market Share, By Key Player, 2014
Figure 39 Acquisitions Fueled Growth of this Market
Figure 40 Battle for Market Share: Mergers & Acquisitions Have Been the Key Strategy
Figure 41 Geographic Revenue Mix of Top 5 Market Players
Figure 42 Amcor Limited: Company Snapshot
Figure 43 Amcor Limited: SWOT Analysis
Figure 44 Sonoco Products Company: Company Snapshot
Figure 45 Sonoco Products Company: SWOT Analysis
Figure 46 Constantia Flexibles: Company Snapshot
Figure 47 Constantia Flexibles: SWOT Analysis
Figure 48 Huhtamaki OYJ: Company Snapshot
Figure 49 Huhtamaki OYJ: SWOT Analysis
Figure 50 Mondi Group: Company Snapshot
Figure 51 Bosch Packaging Technology: Company Snapshot
Figure 52 Bosch Packaging Technology: SWOT Analysis
Figure 53 Fres-Co System Inc.: SWOT Analysis
Figure 54 UDG Healthcare PLC: Company Snapshot


Growth opportunities and latent adjacency in Stick Packaging Market