Subsea Pumps Market by Type (Helico-Axial, ESP, Centrifugal, Twin-Screw, Hybrid, Counter-Axial), Application (Subsea Boosting, Subsea Injection, Subsea Separation, Subsea Gas Compression), & by Region - Global Trends & Forecast to 2020


Subsea pumps are employed majorly in the offshore mature fields to improve the recovery rate by reducing back-pressure on the reservoir, thereby lowering the production expenditures. The report focuses on the subsea pump market based on its various types and applications for different regions. The oil price slump in 2014 has slowed the growth of the offshore hardware and equipment market due to non-profitable extraction of crude from the fields. Due to this many stakeholders have pulled their support from the offshore projects, resulting in a decline in offshore productions. Considering this, the report forecasts subsea pumps market till 2020.
The global market is projected to reach $1,773.7 Million by 2020, at a CAGR of 11.3% during the forecast period 2015-2020. Latin America was the single-largest market for subsea pumps in 2014, holding a 31.1% share, and is set to continue its dominance till 2020. High growth rates have been observed because of the ongoing production activities as future investments and promoting oil contango.
Subsea boosting is expected to be the largest application for subsea pumps and is expected to have more than 50% of the market share during the forecast period. Seabed boosting is at times deployed to ensure the flow of fluids from fields at the required rate after the natural reservoir pressure declines. It includes seabed multi-phase and down-hole boosting, raw seawater injection, and gas compression. Major factors that encourage the operators to adopt subsea boosting are the existence of heavy oil, the increased distance from the host, increased water depth, low reservoir pressure, and a greater number of field tiebacks to the host.
Subsea pumps market is majorly driven by the offshore exploration activities and the mature oilfields which require additional pressure in order to maintain a proper recovery rate. These activities are expected to have a healthy growth after 2016. The ultra-deep E&P activities are expected to witness huge investments and move to deeper reserves once the oil prices and the breakeven price for oil production return to normal. However, stringent government regulations for offshore exploration and production activities hamper the growth of the subsea pumps while uncertainty in oil prices remains a challenge to the key players.
This report provides an analysis of key companies and competitive analysis of developments recorded in the industry in the last three years. Market drivers, restraints, opportunities, burning issues, and latest industry trends of the market have been discussed in detail. The leading players in the market such as OneSubsea (U.S.), FMC Technologies (U.S.), Aker Solutions (Norway), General Electric (U.S.), and Baker Hughes (U.S.) among others have been profiled in this report.
Subsea Pumps Market Size, by Region, 2020 ($Million)
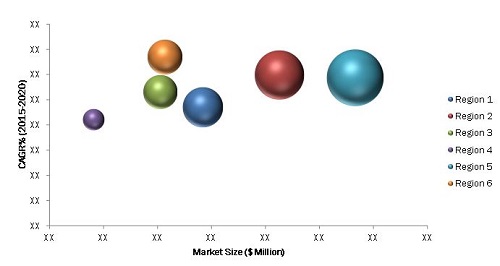
Bubble Size=Projected Market Share of 2020
Source: Company Annual Reports, Press Releases, and MarketsandMarkets Analysis
In 2015, South America is expected to have the largest market in the subsea pumps market. The reason behind this is the exploration and production in the off coast area of Brazil. Although the capital intensive projects have been put on hold or are currently not in play, but the region is still estimated to lead the subsea market.
Scope of the Report
This report focuses on the global market, which has been segmented on the basis of type, application, and region.
On the basis of Type
- Centrifugal
- Helico-axial
- Hybrid pump
- Twin screw
- Co-axial
- ESP
On the basis of Application
- Subsea boosting
- Subsea separation
- Subsea injection
- Gas compression
On the basis of Region
- Asia-Pacific
- North America
- Europe
- Middle East
- South America
- Africa
The global market was valued at $1,018.5 Million in 2014 and is projected to reach $1,773.7 Million by 2020, at a CAGR of 11.3% during the forecast period 2015-2020. The report focuses on the subsea pump market based on its various types and applications for different regions. The oil price slump in 2014 has slowed the growth of the offshore hardware and equipment market due to non-profitable extraction of crude from the fields. Due to this many stakeholders have pulled their support from the offshore projects, resulting in a decline in offshore productions. Considering this, the report forecasts subsea pumps market till 2020.
Subsea boosting is expected to be the largest application for subsea pumps and is expected to have more than 50% of the market share during the forecast period. Seabed boosting is at times deployed to ensure the flow of fluids from fields at the required rate after the natural reservoir pressure declines. Major factors that encourage the operators to adopt subsea boosting are the existence of heavy oil, the increased distance from the host, increased water depth, low reservoir pressure, and a greater number of field tiebacks to the host.
The report provides qualitative analysis of the leading players in the subsea pumps market, with a clear insight and analysis of the development strategies used and preferred by them. The report also includes a chronology of the developments with respect to contracts and agreements (including joint ventures, collaborations, and partnerships), mergers and acquisitions, new product launches, and expansions. Key players including OneSubsea (U.S.), FMC Technologies (U.S.), Aker Solutions (Norway), General Electric (U.S.), and Baker Hughes (U.S.), have been profiled in this report. The market dynamics in terms of market drivers, restraints, opportunities, burning issues, and industry trends have also been discussed in this report. Additionally, the effects of the oil price slump on the oil & gas industry is taken into consideration in order to track and forecast the market.
Subsea Pumps Market Size, 2015 vs. 2020 ($Million)
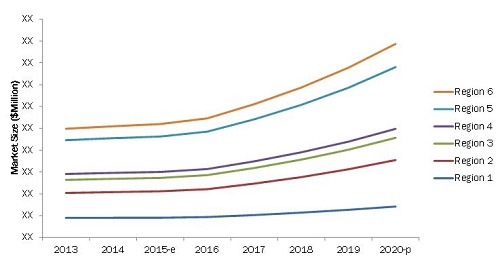
E-estimated, P-projected
Source: Company Annual Reports, Press Releases, and MarketsandMarkets Analysis
The global market size is projected to grow at a CAGR of 11.3% during the forecast period. South America and Africa are expected to have maximum investments in the offshore E&P activities. Brazil, Norway, Angola, Mozambique, and the U.K. are identified as the key countries for this market.
 Exclusive indicates content/data unique to MarketsandMarkets and not available with any competitors.
Table of Contents
1 Introduction (Page No. - 12)
1.1 Objectives of the Study
1.2 Market Definition
1.3 Markets Covered
1.3.1 Markets Covered: Global Subsea Pumps Market
1.3.2 Years Considered in the Report
1.4 Currency
1.5 Limitations
1.6 Stakeholders
2 Research Methodology (Page No. - 15)
2.1 Research Data
2.1.1 Secondary Data
2.1.1.1 Key Data From Secondary Sources
2.1.2 Primary Data
2.1.2.1 Key Data From Primary Sources
2.1.2.2 Breakdown of Primaries
2.2 Market Size Estimation
2.3 Market Breakdown and Data Triangulation
2.4 Research Assumptions & Limitations
2.4.1 Assumptions
2.4.2 Limitations
3 Executive Summary (Page No. - 24)
4 Premium Insights (Page No. - 30)
4.1 Attractive Opportunities in the Subsea Pumps Market
4.2 Subsea Pumps Market, By Type
4.3 Subsea Pumps Market: Application vs Type
4.4 South America Holds the Largest Market Share in Terms of Value in 2014
4.5 Subsea Pumps Market: Developed vs Developing Nations
4.6 Subsea Pumps Market, By Application (2015-2020)
4.7 Africa Subsea Pumps Market, By Type
4.8 Life Cycle Analysis, By Region
5 Market Overview (Page No. - 37)
5.1 Introduction
5.2 Market Evolution
5.3 Market Segmentation
5.3.1 By Type
5.3.2 By Application
5.3.3 By Region
5.4 Market Dynamics
5.4.1 Drivers
5.4.1.1 Increasing Deep-Water Activities, Longer Tiebacks, and Recoverable Reserves
5.4.1.2 Access to Difficult Reserves
5.4.2 Restraints
5.4.2.1 Stringent Government Regulatory Norms
5.4.2.2 Operational and Environmental Concerns
5.4.3 Opportunity
5.4.3.1 New Offshore Discoveries
5.4.4 Challenge
5.4.4.1 Oil Price Volatility
5.5 Porter�s Five Forces Analysis
5.5.1 Threat of New Entrants
5.5.1.1 High Capital Requirement
5.5.1.2 High Product Differentiation
5.5.2 Threat of Substitutes
5.5.2.1 No Major Substitute Available
5.5.3 Bargaining Power of Suppliers
5.5.3.1 High Cost of Switching Suppliers
5.5.3.2 Non-Concentration of Suppliers
5.5.4 Bargaining Power of Buyers
5.5.4.1 Concentration of Buyers in the Market
5.5.4.2 Local Sourcing Requirements
5.5.5 Intensity of Competitive Rivalry
5.5.5.1 Many Equally Sized Competitors
6 Subsea Pumps Market, By Type (Page No. - 50)
6.1 Introduction
6.2 Helico-Axial
6.3 Electrical Submersible Pump (ESP)
6.4 Centrifugal
6.5 Twin Screw
6.6 Hybrid
6.7 Counter-Axial
7 Subsea Pumps Market, By Application (Page No. - 62)
7.1 Introduction
7.2 Subsea Boosting
7.3 Subsea Separation
7.4 Subsea Injection
7.5 Subsea Compression
8 Subsea Pump Market, By Region (Page No. - 71)
8.1 Introduction
8.2 South America
8.2.1 Brazil
8.2.2 Rest of South America
8.3 Europe
8.3.1 Norway
8.3.2 U.K.
8.3.3 Rest of Europe
8.4 North America
8.4.1 U.S.
8.4.2 Canada
8.4.3 Mexico
8.5 Asia-Pacific
8.5.1 China
8.5.2 India
8.5.3 Malaysia
8.5.4 Indonesia
8.5.5 Australia
8.5.6 Rest of Asia-Pacific
8.6 Africa
8.6.1 Angola
8.6.2 Nigeria
8.6.3 Ghana
8.6.4 Rest of Africa
8.7 Middle East
8.7.1 Saudi Arabia
8.7.2 UAE
8.7.3 Qatar
8.7.4 Rest of Middle East
9 Competitive Landscape (Page No. - 110)
9.1 Overview
9.2 Market Share Analysis
9.3 Competitive Situation & Trends
9.4 Contracts & Agreements (Including Partnerships/Joint Ventures/Collaborations)
9.5 Mergers & Acquisitions
9.6 Expansions
9.7 New Product Launches
10 Company Profiles (Page No. - 120)
(Company at A Glance, Business Overview, Product Offerings, Key Strategy, Recent Developments, SWOT Analysis & MnM View
10.1 Introduction
10.2 Aker Solutions
10.3 Baker Hughes Incorporated
10.4 FMC Technologies, Inc.
10.5 General Electric Company
10.6 Onesubsea
10.7 Sulzer AG
10.8 SPX Corporation
10.9 ITT Bornemann
10.10 Flowserve Corporation
10.11 Leistritz Pumpen Gmbh
10.12 Framo as
*Details on Company at A Glance, Recent Financials, Products & Services, Strategies & Insights, & Recent Developments Might Not Be Captured in Case of Unlisted Companies.
11 Appendix (Page No. - 152)
11.1 Insights of Industry Experts
11.2 Discussion Guide
11.3 Introducing RT: Real Time Market Intelligence
11.4 Available Customizations
11.5 Related Reports
List of Tables (69 Tables)
Table 1 Increasing Deepwater Activities Wil Drive Subsea Pumps Market
Table 2 Stringent Regulations About Subsea Drilling and Production is the Major Restraining Force for the Global Market
Table 3 New Offshore Discoveries Offers High Growth Opportunities for Manufacturers
Table 4 Oil Price Voltality is A Challenge for the Market
Table 5 Subsea Pumps Market Size, By Type, 2013�2020 ($Million)
Table 6 Helico-Axial Subsea Pump Market Size, By Region, 2013-2020 ($Million)
Table 7 ESP Subsea Pump Market Size, By Region, 2013-2020 ($Million)
Table 8 Centrifugal Subsea Pump Market Size, By Region, 2013-2020 ($Million)
Table 9 Twin Screw Subsea Pumps Market Size, By Region, 2013-2020 ($Million)
Table 10 Hybrid Subsea Pump Market Size, By Region, 2013-2020 ($Million)
Table 11 Counter-Axial Subsea Pumps Market Size, By Region, 2013-2020 ($Million)
Table 12 Subsea Pumps Market Size, By Application, 2013�2020 ($Million)
Table 13 Subsea Boosting Application Market Size, By Region, 2013-2020 ($Million)
Table 14 Subsea Separation Market Size, By Region, 2013-2020 ($Million)
Table 15 Subsea Injection Market Size, By Region, 2013-2020 ($Million)
Table 16 Subsea Gas Compression Market Size, By Region, 2013-2020 ($Million)
Table 17 Subsea Pumps Market Size, By Region, 2013-2020 ($Million)
Table 18 South America: Subsea Pumps Market Size, By Country, 2013-2020 ($Million)
Table 19 South America: Market Size, By Application, 2013-2020 ($Million)
Table 20 South America: Market Size, By Type, 2013-2020 ($Million)
Table 21 Brazil: Subsea Pumps Market Size, By Type, 2013-2020 ($Million)
Table 22 Brazil: Market Size, By Application, 2013-2020 ($Million)
Table 23 Rest of South America: Subsea Pumps Market Size, By Type, 2013-2020 ($Million)
Table 24 Rest of South America: Market Size, By Application, 2013-2020 ($Million)
Table 25 Europe: Subsea Pumps Market Size, By Country, 2013-2020 ($Million)
Table 26 Europe: Market Size, By Type, 2013-2020 ($Million)
Table 27 Europe: Market Size, By Application, 2013-2020 ($Million)
Table 28 Norway: Subsea Pumps Market Size, By Type, 2013-2020 ($Million)
Table 29 Norway: Market Size, By Application, 2013-2020 ($Million)
Table 30 U.K.: Subsea Pumps Market Size, By Type, 2013-2020 ($Million)
Table 31 U.K.: Market Size, By Application, 2013-2020 ($Million)
Table 32 Rest of Europe: Subsea Pumps Market Size, By Type, 2013-2020 ($Million)
Table 33 Rest of Europe: Market Size, By Application, 2013-2020 ($Million)
Table 34 North America: Subsea Pumps Market Size, By Country, 2013-2020 ($Million)
Table 35 North America: Market Size, By Type, 2013-2020 ($Million)
Table 36 North America: Market Size, By Application, 2013-2020 ($Million)
Table 37 U.S.: Subsea Pumps Market Size, By Type, 2013-2020 ($Million)
Table 38 U.S.: Market Size, By Application, 2013-2020 ($Million)
Table 39 Canada: Subsea Pumps Market Size, By Type, 2013-2020 ($Million)
Table 40 Canada: Market Size, By Application, 2013-2020 ($Million)
Table 41 Mexico: Subsea Pumps Market Size, By Type, 2013-2020 ($Million)
Table 42 Mexico: Market Size, By Application, 2013-2020 ($Million)
Table 43 Asia-Pacific: Subsea Pumps Market Size, By Country, 2013-2020 ($Million)
Table 44 Asia-Pacific: Market Size, By Type, 2013-2020 ($Million)
Table 45 Asia-Pacific: Market Size, By Application, 2013-2020 ($Million)
Table 46 China: Subsea Pumps Market Size, By Type, 2013-2020 ($Million)
Table 47 India: Subsea Pumps Market Size, By Type, 2013-2020 ($Million)
Table 48 Malaysia: Subsea Pump Market Size, By Type, 2013-2020 ($Million)
Table 49 Indonesa: Subsea Pump Market Size, By Type, 2013-2020 ($Million)
Table 50 Australia: Subsea Pump Market Size, By Type, 2013-2020 ($Million)
Table 51 Rest of Asia-Pacific: Subsea Pump Market Size, By Type, 2013-2020 ($Million)
Table 52 Africa: Subsea Pumps Market Size, By Country, 2013-2020 ($Million)
Table 53 Africa: Market Size, By Type, 2013-2020 ($Million)
Table 54 Africa: Market Size, By Application, 2013-2020 ($Million)
Table 55 Angola: Subsea Pump Market Size, By Type, 2013-2020 ($Million)
Table 56 Nigeria: Subsea Pump Market Size, By Type, 2013-2020 ($Million)
Table 57 Ghana: Subsea Pumps Market Size, By Type, 2013-2020 ($Million)
Table 58 Rest of Africa: Subsea Pumps Market Size, By Type, 2013-2020 ($Million)
Table 59 Middle East: Subsea Pumps Market Size, By Country, 2013-2020 ($Million)
Table 60 Middle East: Market Size, By Type, 2013-2020 ($Million)
Table 61 Middle East: Market Size, By Application, 2013-2020 ($Million)
Table 62 Saudi Arabia: Subsea Pumps Market Size, By Type, 2013-2020 ($Million)
Table 63 UAE: Subsea Pumps Market Size, By Type, 2013-2020 ($Million)
Table 64 Qatar: Subsea Pumps Market Size, By Type, 2013-2020 ($Million)
Table 65 Rest of Middle East: Subsea Pumps Market Size, By Type, 2013-2020 ($Million)
Table 66 Contracts & Agreements (Including Partnerships/Joint Ventures/Collaborations), 2012�2015
Table 67 Mergers & Acquisitions, 2012-2015
Table 68 Expansions, 2012-2015
Table 69 New Product Launches, 2012-2015
List of Figures (55 Figures)
Figure 1 Subsea Pumps Market: Research Design
Figure 2 Breakdown of Primary Sources: By Company Type, Designation, and Region
Figure 3 Market Size Estimation Methodology: Bottom-Up Approach
Figure 4 Market Size Estimation Methodology: Top-Down Approach
Figure 5 Data Triangulation Methodology
Figure 6 South America is Projected to Remain the Largest Market During Forecast Period
Figure 7 Market for Subsea Boosting Application to Grow at A Fast Pace During the Forecast Period
Figure 8 Helico-Axial is the Largest Segment, By Type
Figure 9 South America, Europe, & Africa are the Most Promising Markets
Figure 10 Aker Solutions is the Most Active Company in Terms of Market Developments
Figure 11 Increasing Offshore Expenditure Offers Lucrative Opportunities
Figure 12 Helico-Axial Type is Expected to Grow at the Highest Rate in the Global Market
Figure 13 Subsea Boosting Application and Helico-Axial Type Held the Largest Market Share in 2014
Figure 14 Africa, Europe, & South America are Expected to Grow at High CAGR
Figure 15 Developing Economies in Africa to Grow at the Highest Rate
Figure 16 More Than 60% of the Total Market Growth Will Come From Subsea Boosting Application
Figure 17 Helico-Axial Type Will Be Dominant in Emerging Economies of the African Region
Figure 18 South America is Expected to Continue in the Growth Phase in the Next Five Years
Figure 19 Oil Production Cost vs Break Even Cost of Brent Crude
Figure 20 Subsea Equipment Market Segmentation: By Type
Figure 21 Subsea Pumps Market Segmentation: By Application
Figure 22 Subsea Pumps Market Segmentation: By Region
Figure 23 Subsea Pumps Market: Drivers, Restraints, Opportunities and Challenges
Figure 24 Porter�s Five Forces Analysis: Intensity of Rivalry is Moderate in the Subsea Pumps Market
Figure 25 Subsea Pumps Market Share (Value), By Type, 2014
Figure 26 Helico-Axial Type is Expected to Grow at the Fastest Pace, 2015 & 2020
Figure 27 Helico-Axial Subsea Pump Market Share (Value), By Region, 2014
Figure 28 ESP Subsea Pump Market Share (Value), By Region, 2014
Figure 29 Centrifugal Subsea Pump Market Share (Value) By Region, 2014
Figure 30 Twin Screw Subsea Pumps Market Share (Value), By Region, 2014
Figure 31 Hybrid Subsea Pump Market Share (Value), By Region, 2014
Figure 32 Counter-Axial Subsea Pumps Market Share (Value), By Region, 2014
Figure 33 Subsea Pumps Market Share (Value), By Application, 2014
Figure 34 Subsea Boosting is Expected to Remain the Dominant Application Throughout the Forecast Period
Figure 35 Subsea Boosting Application Market Share (Value), By Region, 2014
Figure 36 Subsea Separation Market Share (Value), By Region, 2014
Figure 37 Subsea Injection Market Share (Value), By Region, 2014
Figure 38 Subsea Compression Market Share (Value), By Region, 2014
Figure 39 Subsea Pumps Market Share, By Region, 2014
Figure 40 Regional Snapshot � Growth Rate of Subsea Pumps Market in Important Countries, 2015-2020
Figure 41 South America & Europe are Expected to Be the Top Two Largest Markets in the Next Five Years
Figure 42 Regional Snapshot: Africa Provides Attractive Market Opportunities
Figure 43 Companies Adopted Various Growth Strategies in the Past Three Years
Figure 44 FMC Technologies Posted Strongest Revenue Growth During 2012-2014
Figure 45 Battle for Market Share: Contracts & Agreements is the Key Growth Strategy, 2012-2015
Figure 46 Subsea Pumps Market Share (Value), By Key Player, 2014
Figure 47 Large Number of Contracts and Agreements Signed By Leading Market Players in 2014
Figure 48 Regional Revenue Mix of the Top 5 Market Players
Figure 49 Aker Solutions: Company Snapshot
Figure 50 Baker Hughes Incorporated: Company Snapshot
Figure 51 FMC Technologies, Inc.: Company Snapshot
Figure 52 General Electric Company: Company Snapshot
Figure 53 Sulzer AG: Company Snapshot
Figure 54 SPX Corporation: Company Snapshot
Figure 55 Flowserve Corporation: Company Snapshot


Growth opportunities and latent adjacency in Subsea Pumps Market